The popularity of index investing keeps gaining steam. As of September 30, 2024, more than 2,410 different index mutual funds and passively managed exchange-traded funds were being sold in the U.S., according to the leading association representing regulated investment funds The Investment Company Institute (ICI). These accounted for slightly more than $15.7 trillion in combined assets.1
But that's just part of the story. As we've chronicled over the years in our Deeper Look series, active managers are failing to outperform most of their passive investing rivals. Now, as part of IFA's ongoing analysis of how active managers at major fund companies are doing compared to their indexes, we're putting Goldman Sachs' mutual funds through our microscope.
The publicly traded investment banker, which was founded in 1869, is headquartered in New York. It employs some 45,000 professionals around the world and operates in financial services across investment banking, securities, investment management and consumer banking as well as institutional client services.
With more than $2.8 trillion assets under supervision as of the fourth quarter of 2023, Morningstar estimates that approximately 20% of its revenue comes from investment banking, 45% from trading, 20% from asset management and 15% from wealth management and retail financial services.2
Many investors are familiar with Goldman Sachs through their company sponsored retirement plans. Industry trade magazine Pensions & Investments has ranked Goldman Sachs Asset Management as one of the largest U.S. players in so-called outsourced investment management programs used by 401(k) and 403(b) retirement plan sponsors.
As mentioned above, we've taken a deeper look at the performance of several other large mutual fund companies in the past. One universal conclusion: Active fund managers have failed to deliver on the value proposition they profess, which is to reliably outperform a risk-comparable benchmark.
Controlling for Survivorship Bias
It's important for investors to understand the idea of survivorship bias. While there are 66 active mutual funds with five or more years of performance-related data currently offered by Goldman Sachs, it doesn't necessarily mean these are the only strategies this company has ever managed. In fact, there are 31 mutual funds with five-plus years of data that no longer exist. This can be for a variety of reasons, including poor performance or the fact that they were merged with another fund. We will show what their aggregate performance looks like shortly.
Fees & Expenses
Let's next examine the costs associated with Goldman Sachs' surviving 66 strategies. It should go without saying that if investors are paying a premium for investment "expertise," then they should be receiving above average results consistently over time. The alternative would be to simply accept a market's return, less a significantly lower fee, via an index fund.
The costs we examine include expense ratios, sales loads — front-end (A), back-end (B) and level (C) — as well as 12b-1 marketing fees. These are considered the "hard" costs that investors incur. Prospectuses, however, do not reflect the trading costs associated with mutual funds.
Commissions and market impact costs are real expenses associated with implementing a particular investment strategy and can vary depending on the frequency and size of the trades executed by portfolio managers.
We can estimate the costs associated with an investment strategy by looking at its annual turnover ratio. For example, a turnover ratio of 100% means that the portfolio manager turns over the entire portfolio in one year. This is considered a very active approach, and investors holding these funds in taxable accounts will likely incur a higher exposure to tax liabilities, such as short- and long-term capital gains distributions, than those incurred by passively managed funds.
The table below details the hard costs as well as the turnover ratio for all 66 surviving active funds offered by Goldman Sachs that have at least five years of complete performance history. You can search this page for a symbol or name by using Control F in Windows or Command F on a Mac. Then, click the link to see the Alpha Chart. Also, remember that this is what is considered an in-sample test; the next level of analysis is to do an out-of-sample test (for more information see here).
On average, an investor who utilized a surviving active equity mutual fund strategy from Goldman Sachs experienced a 0.90% expense ratio. Similarly, an investor who utilized a bond strategy from Goldman Sachs experienced a nearly 0.58% expense ratio. (Target-date retirement mutual funds, which follow varying glide paths, aren't included in this study.)
These types of expenses can have a substantial impact on an investor's overall accumulated wealth if they are not backed by superior performance. The average turnover ratios for equity and bond strategies from Goldman Sachs were 76.31% and 461.4%, respectively. This implies an average holding period of 2.60 to 15.73 months.
In general, we find that active managers at Goldman Sachs have made investment decisions based on relatively short-term outlooks, which means they've tended to trade more frequently in the past than a typical rival index fund. Again, this is a cost that is not itemized to the investor but is definitely embedded in the overall performance.
In contrast, most index funds have very long holding periods — decades, in fact. Such relatively longer holding periods, in effect, serves to help index fund investors lower exposure to the market's random noise that accompanies short-term portfolio movements. Again, turnover is a cost that is not itemized to the investor but is definitely embedded in a portfolio's overall performance.
Performance Analysis
The next question we address is whether investors can expect superior performance in exchange for the higher costs associated with Goldman Sachs' implementation of active management. We compared each of its 97 strategies with five or more years against the Morningstar-assigned benchmark to see just how well these active managers delivered on any perceived value proposition. We also used the oldest share class of each fund, which sometimes were older than its assigned benchmark. In these cases, comparisons could only be made for the length of time that the benchmark had data available.
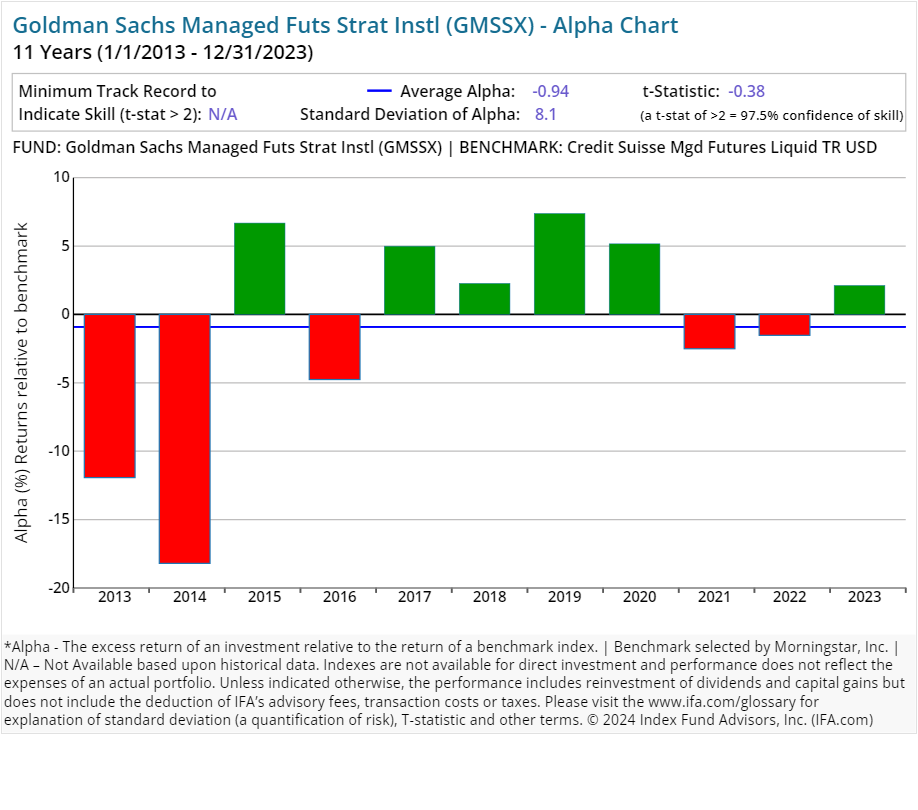
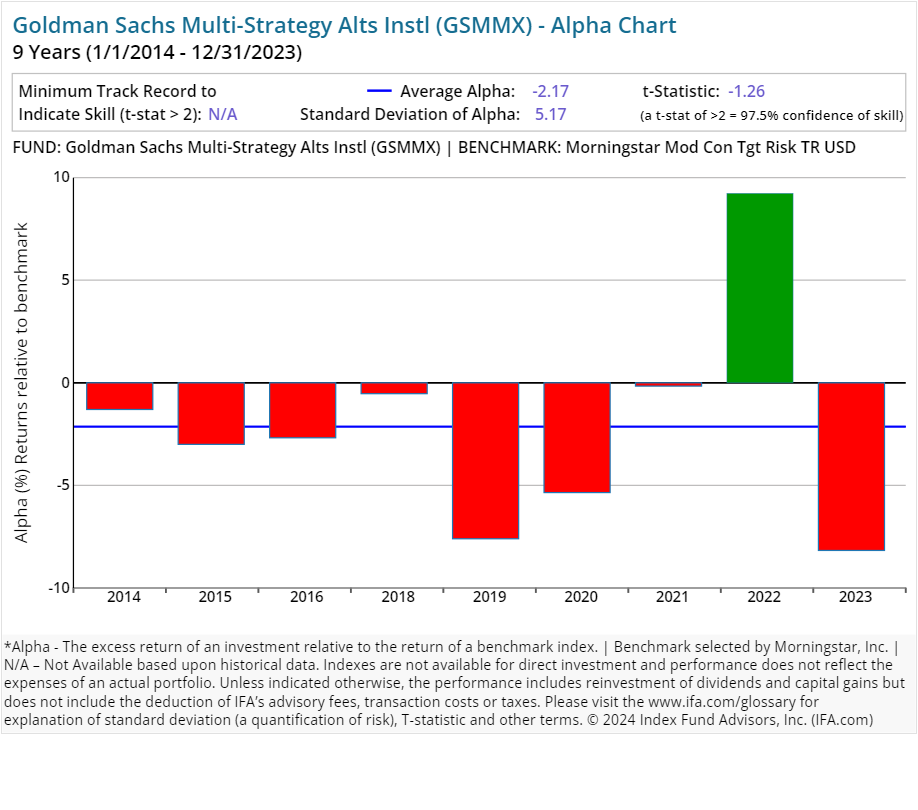
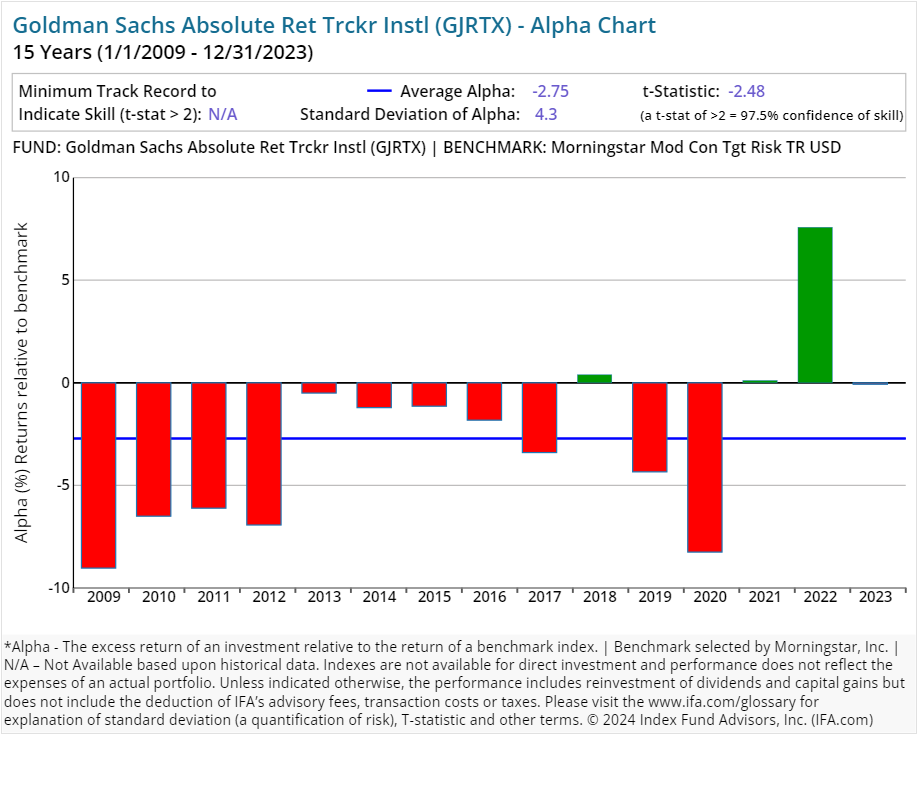
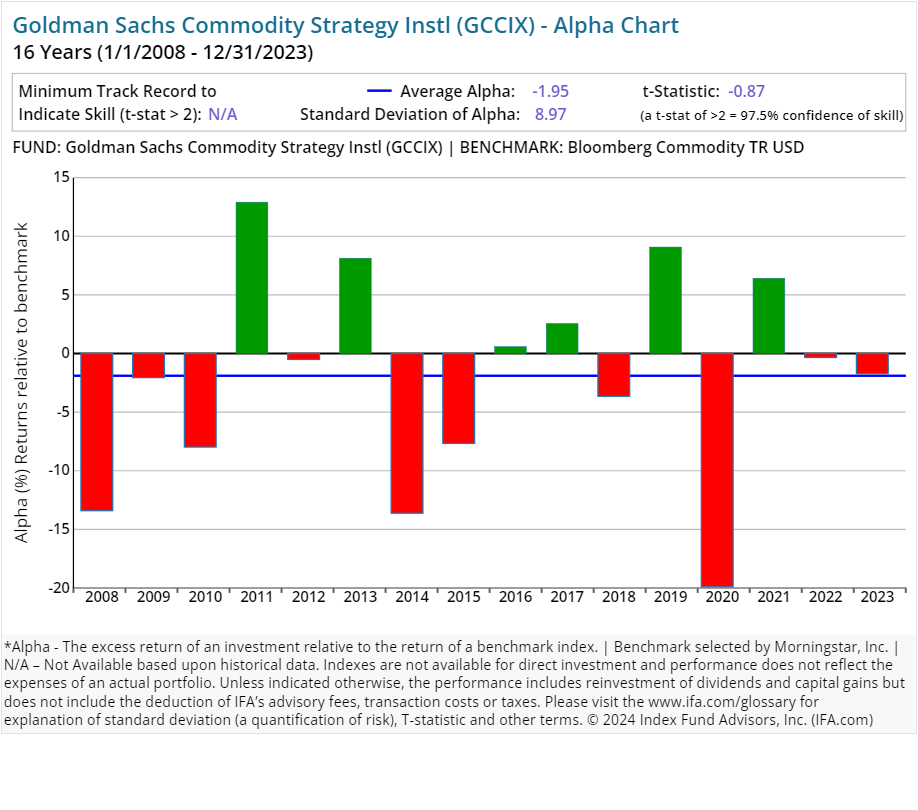
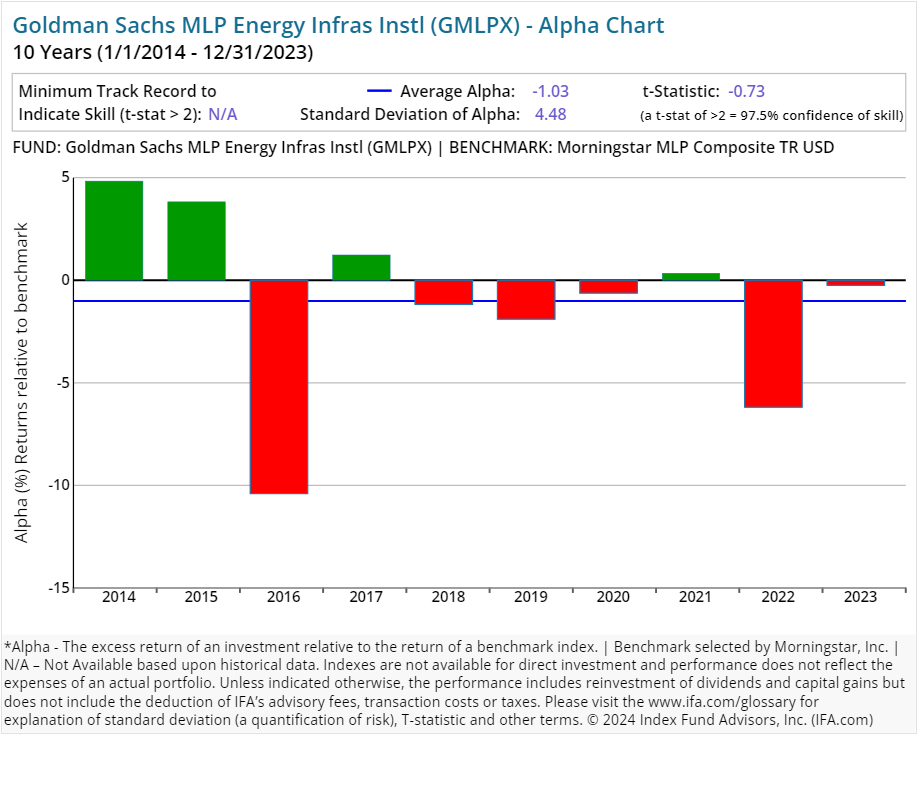
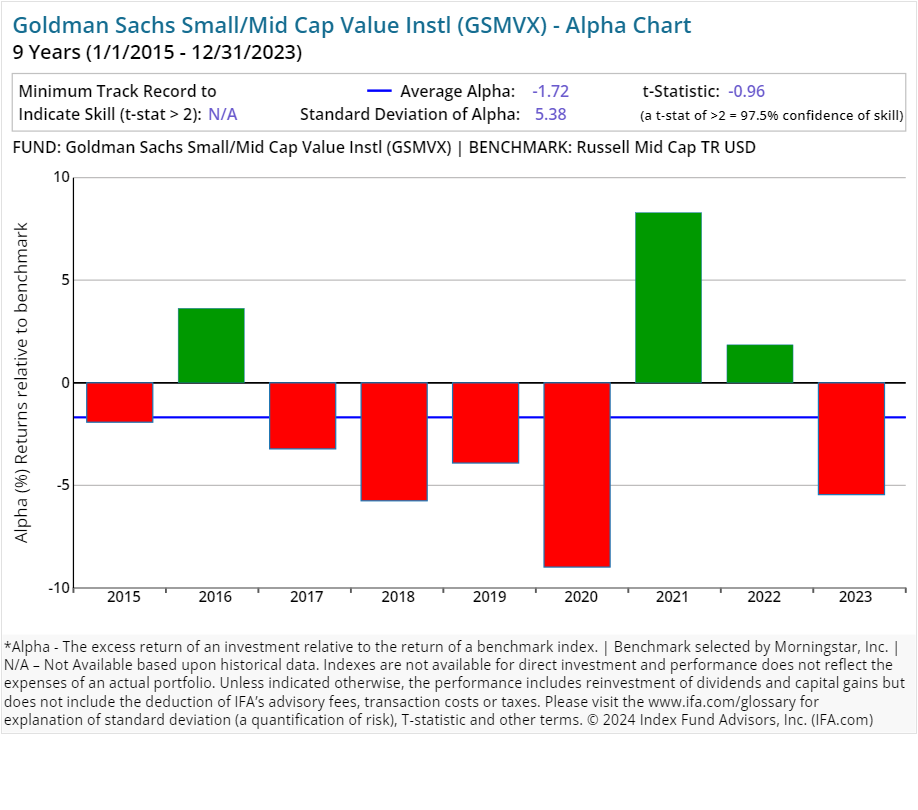
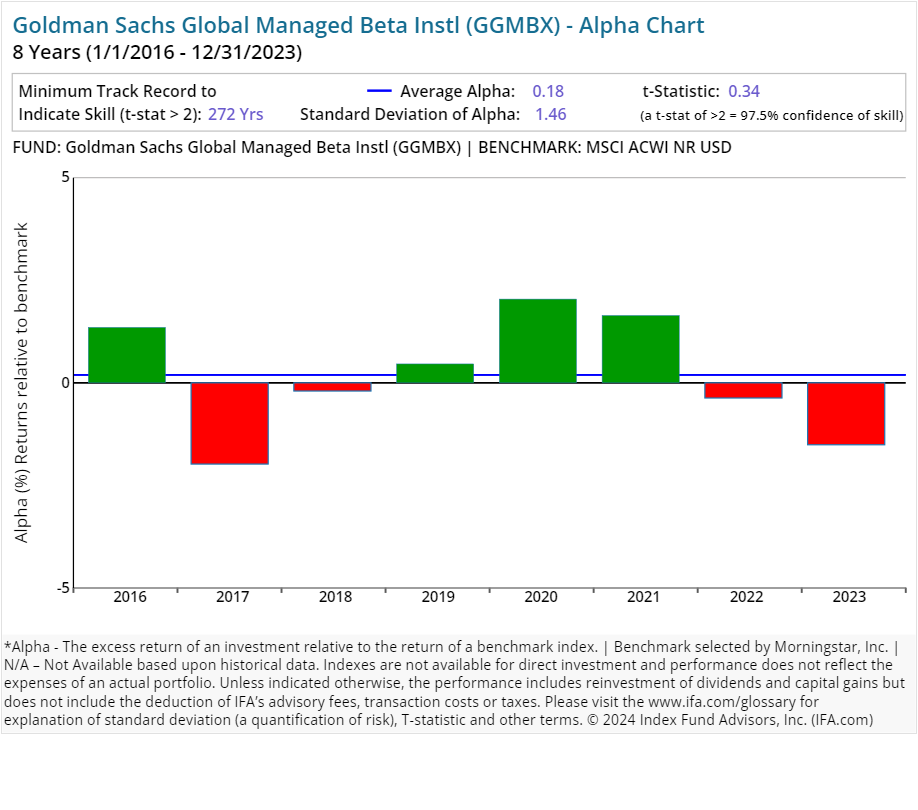
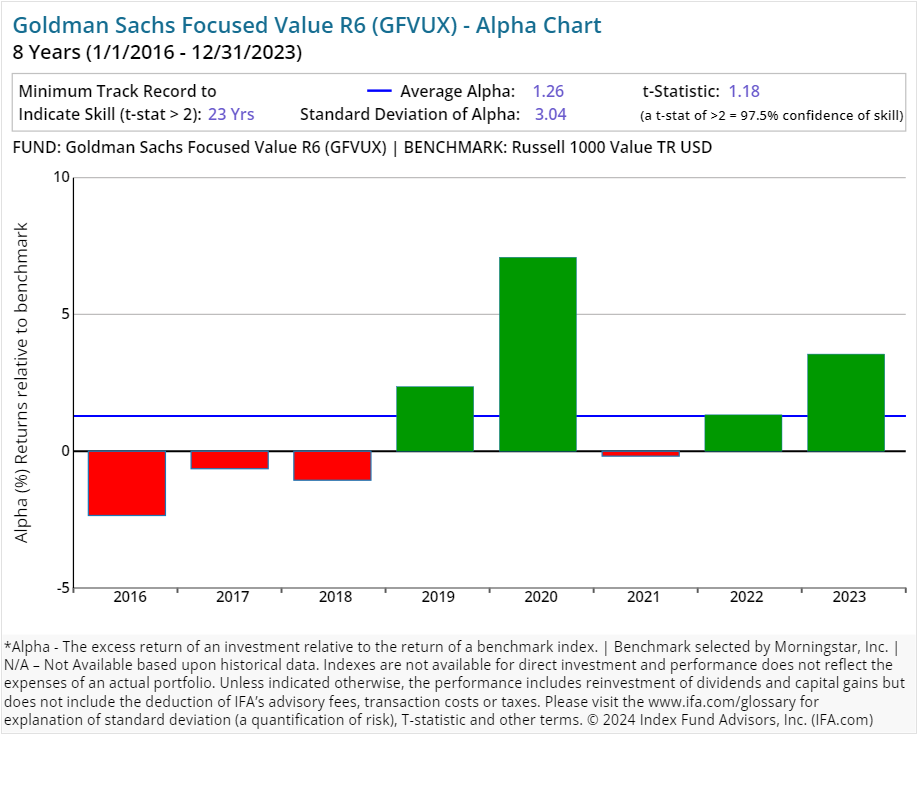
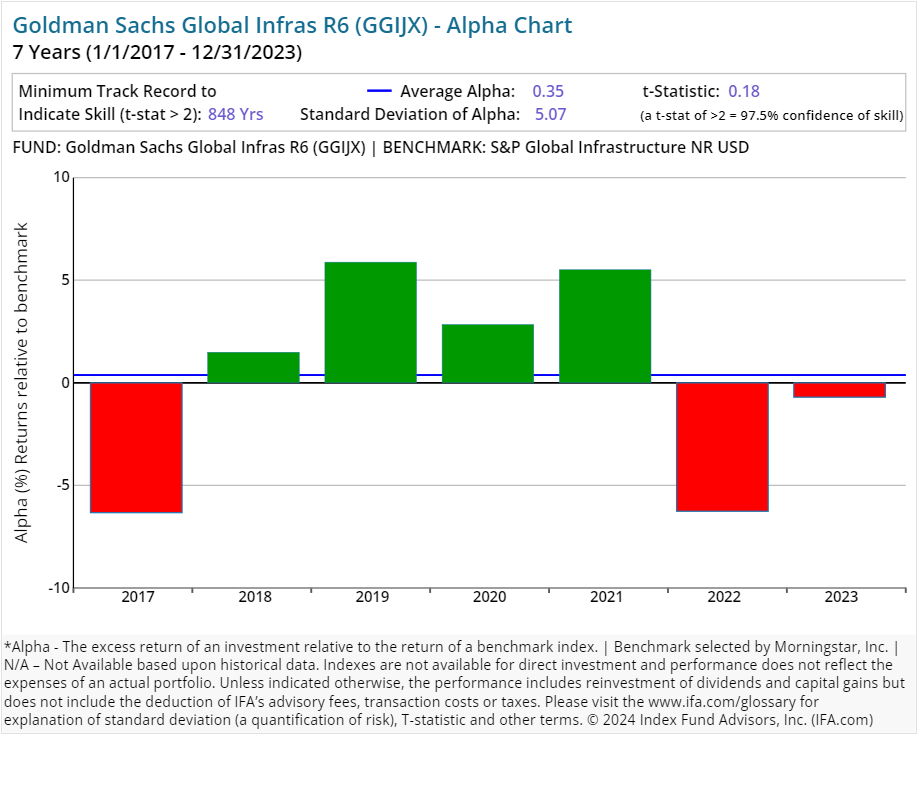
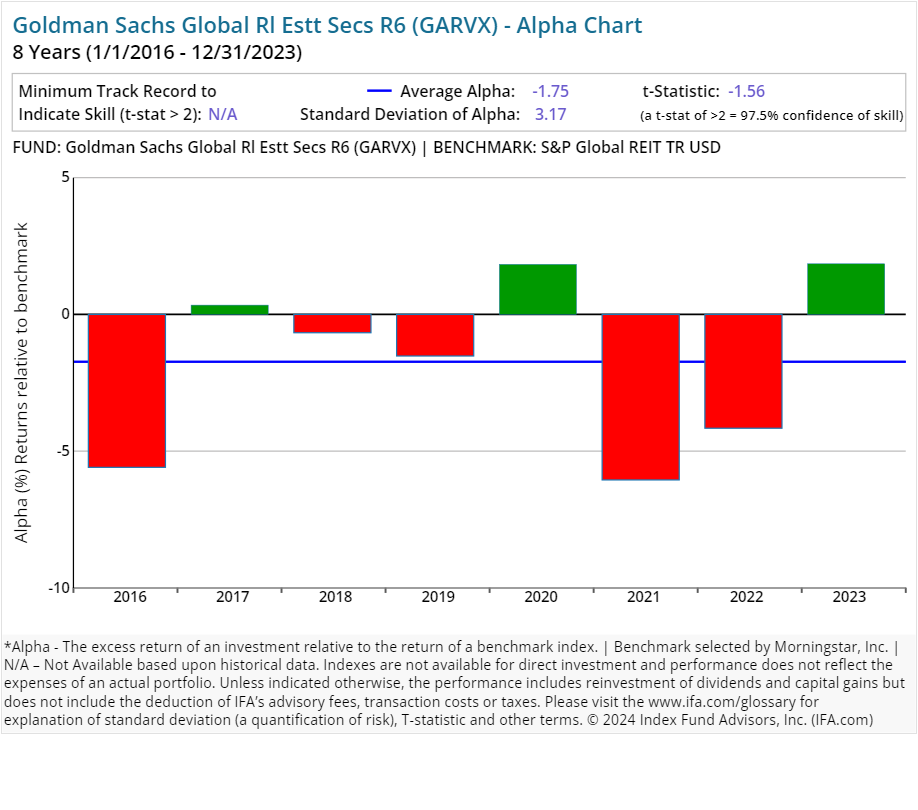
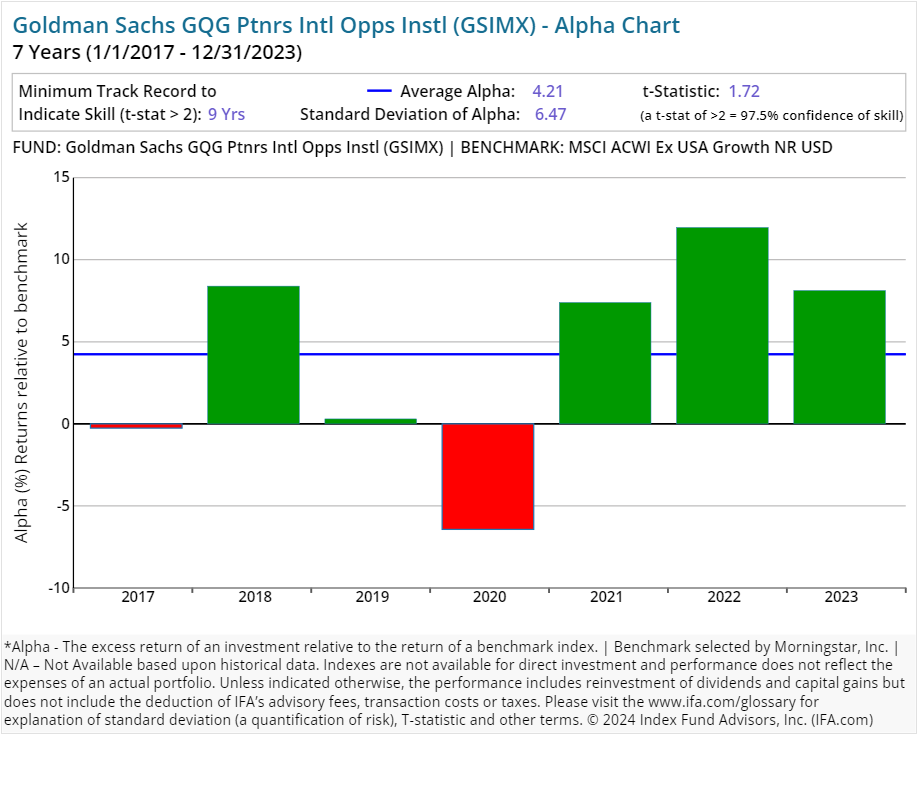
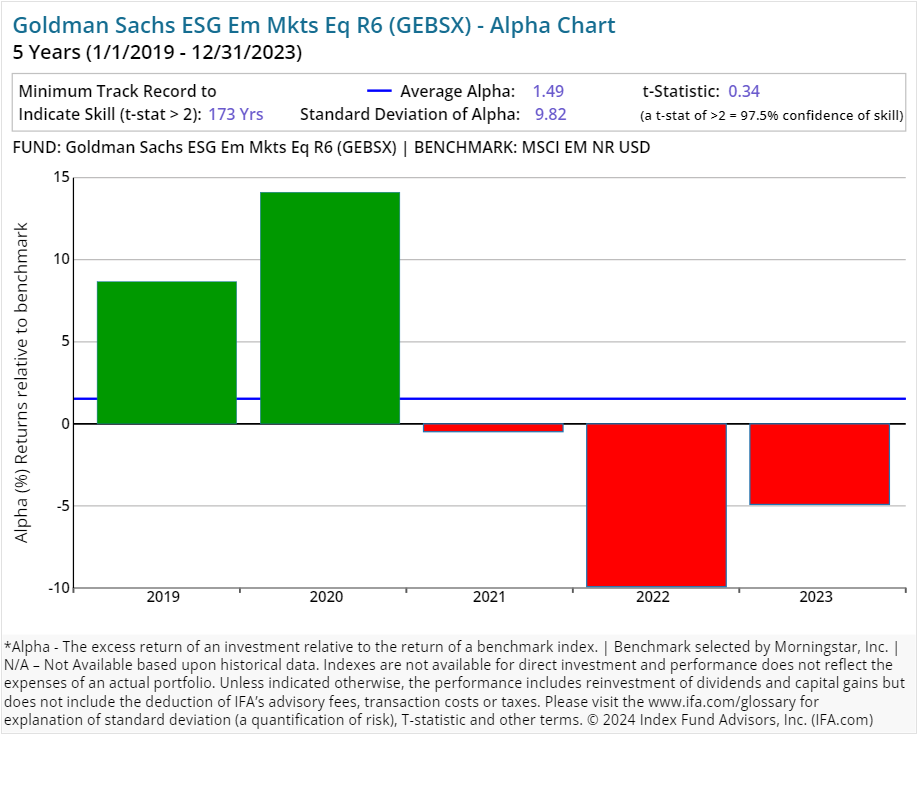
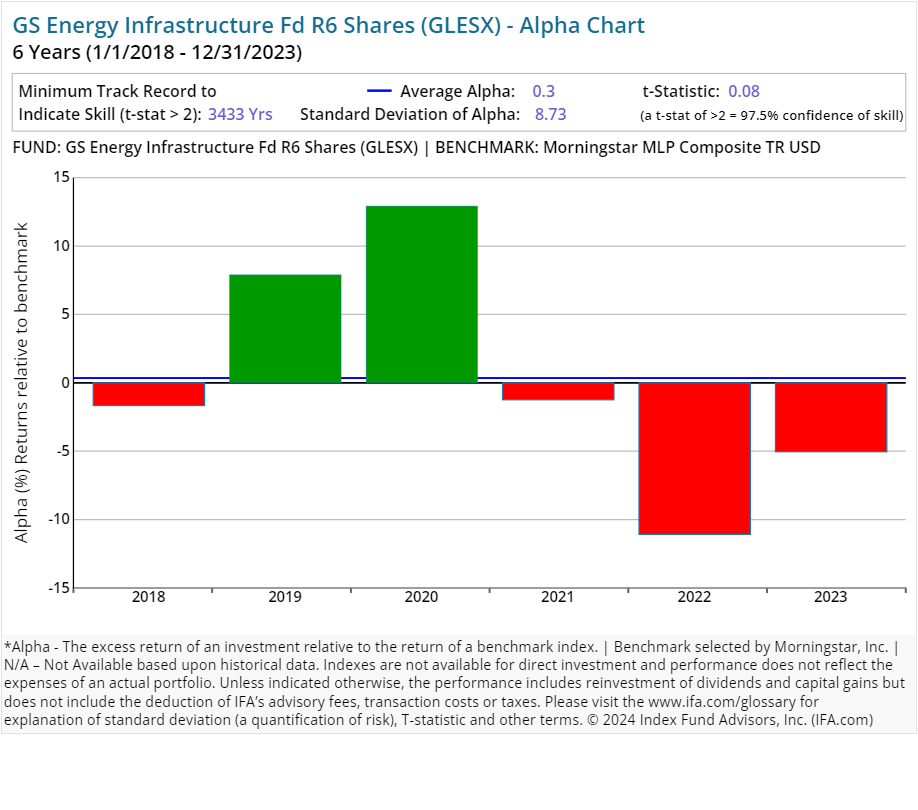
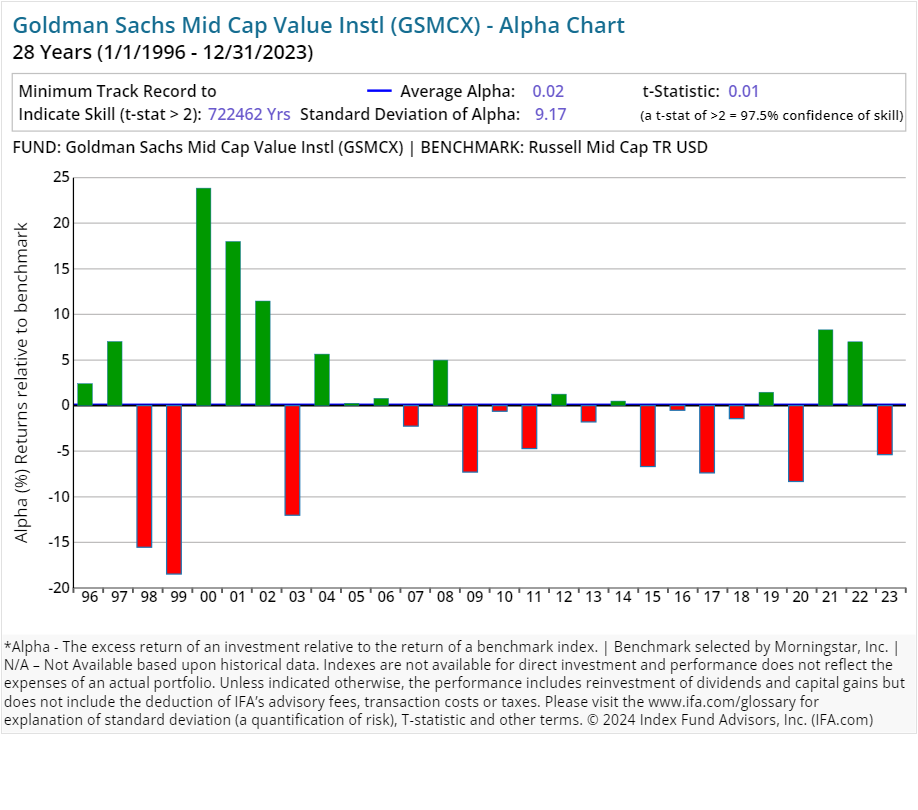
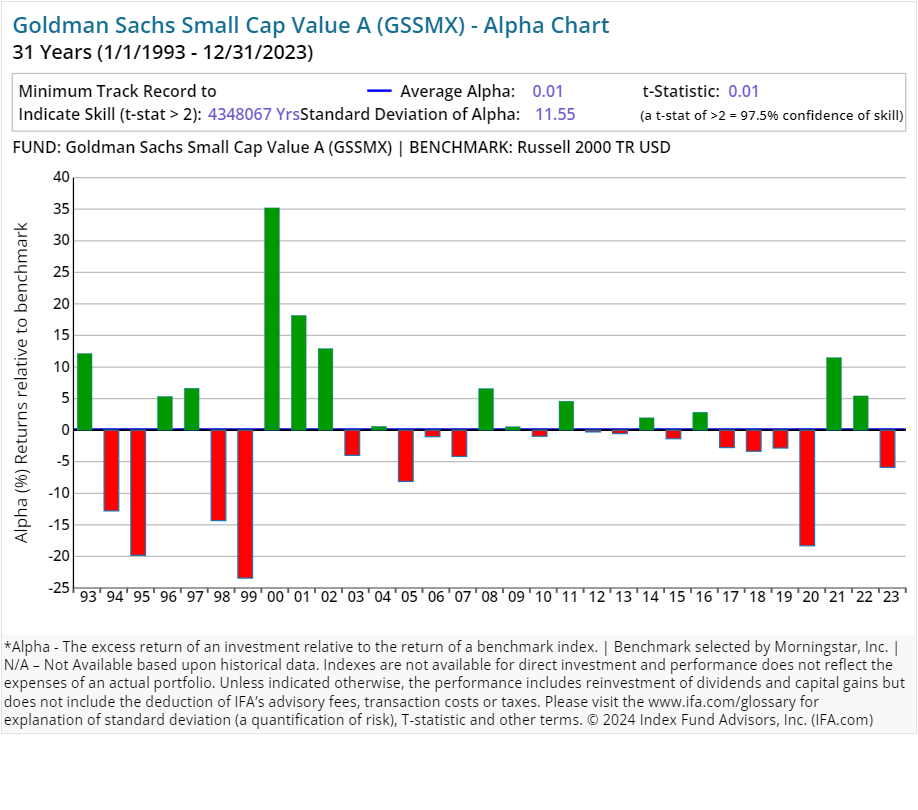
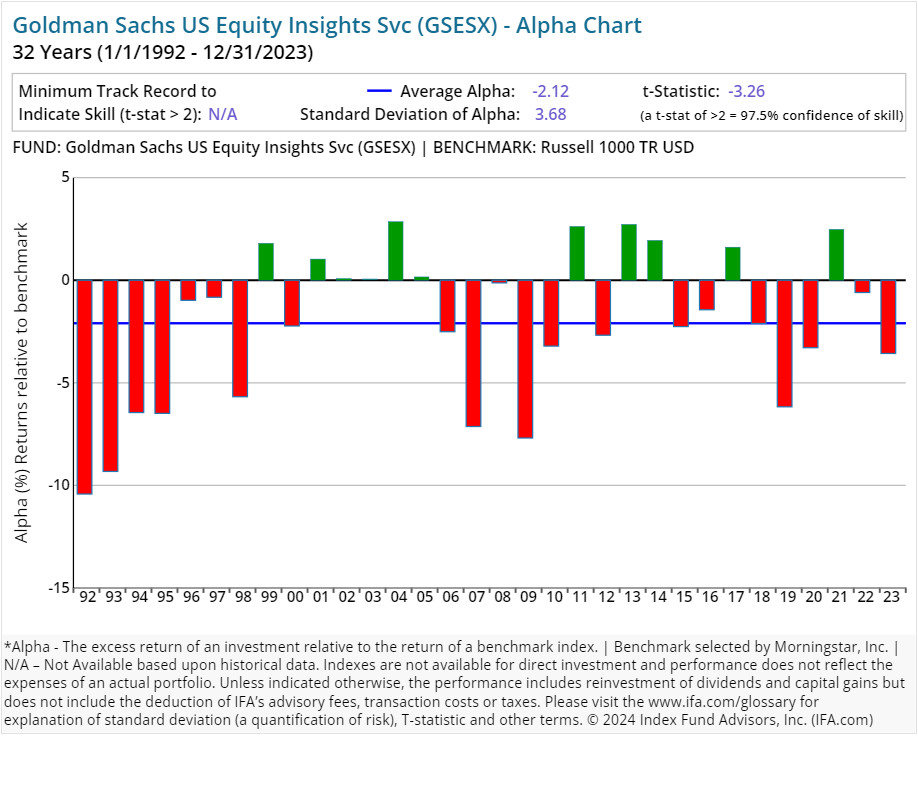
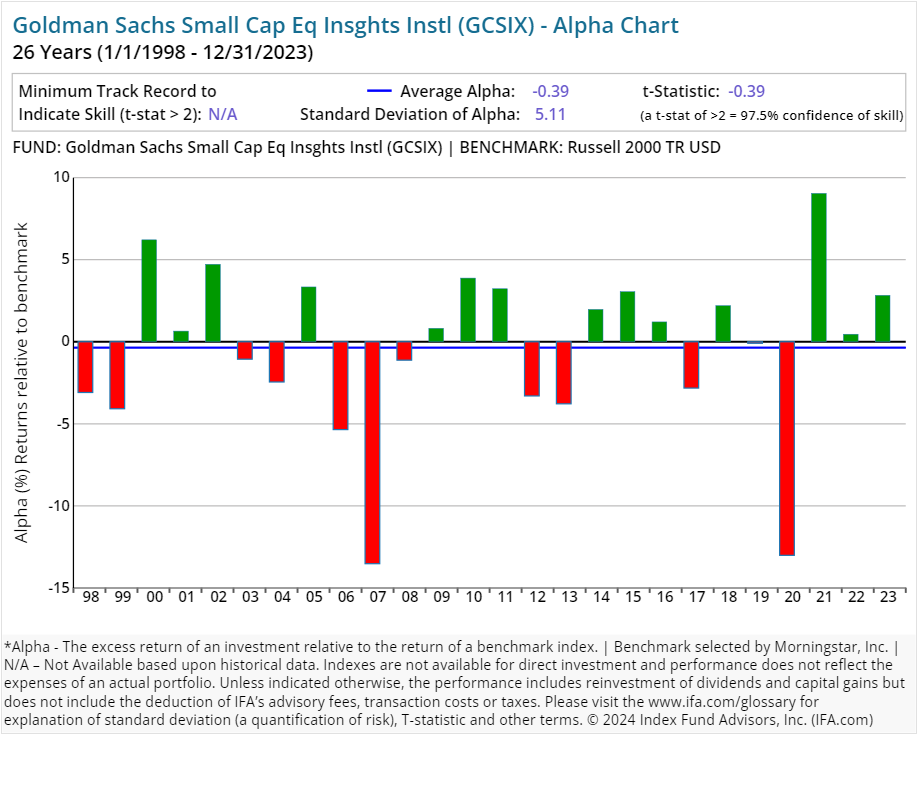
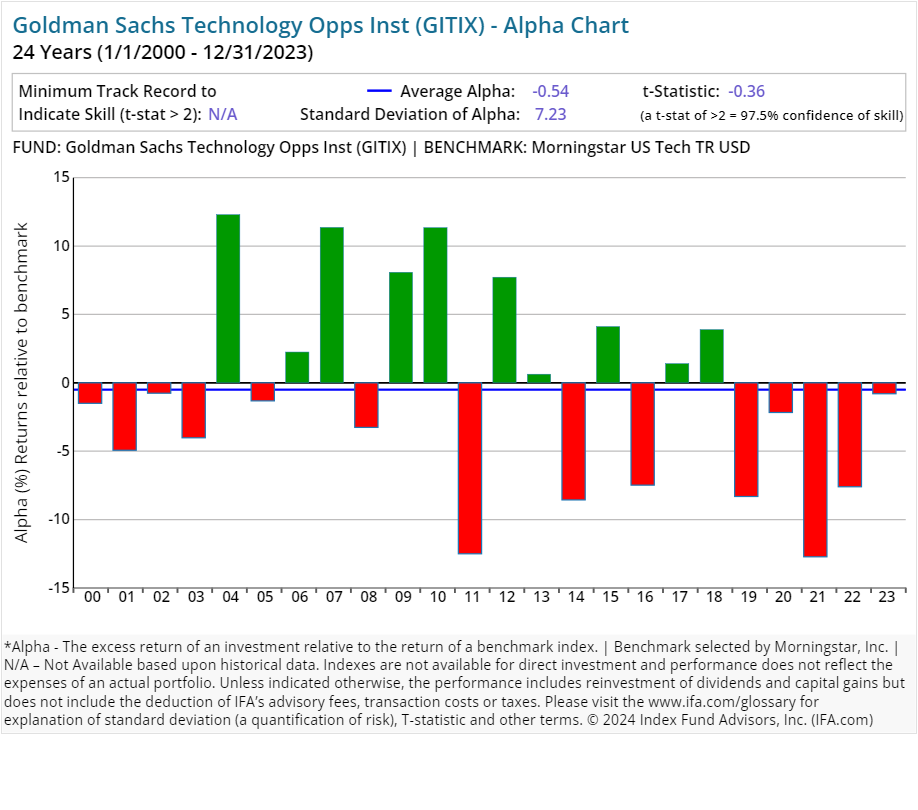
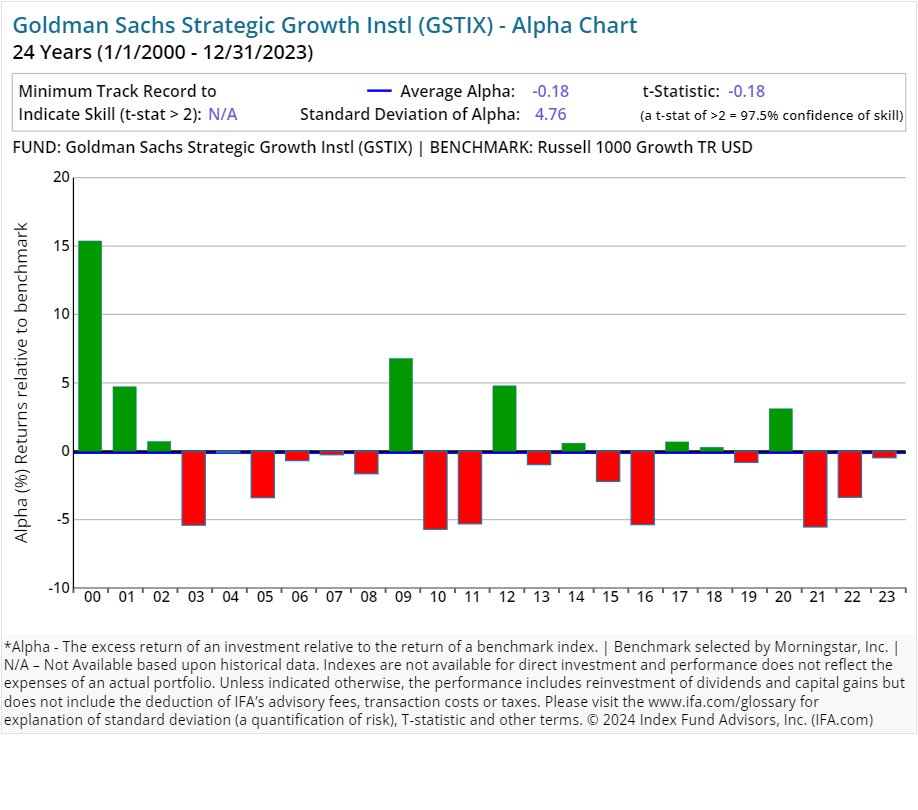
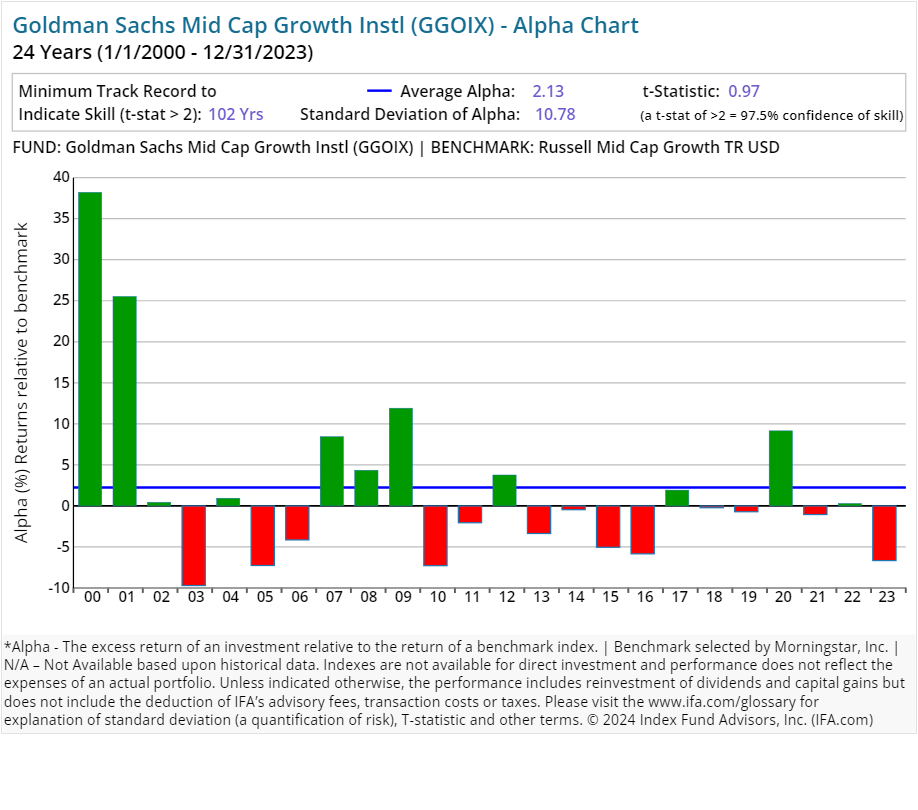
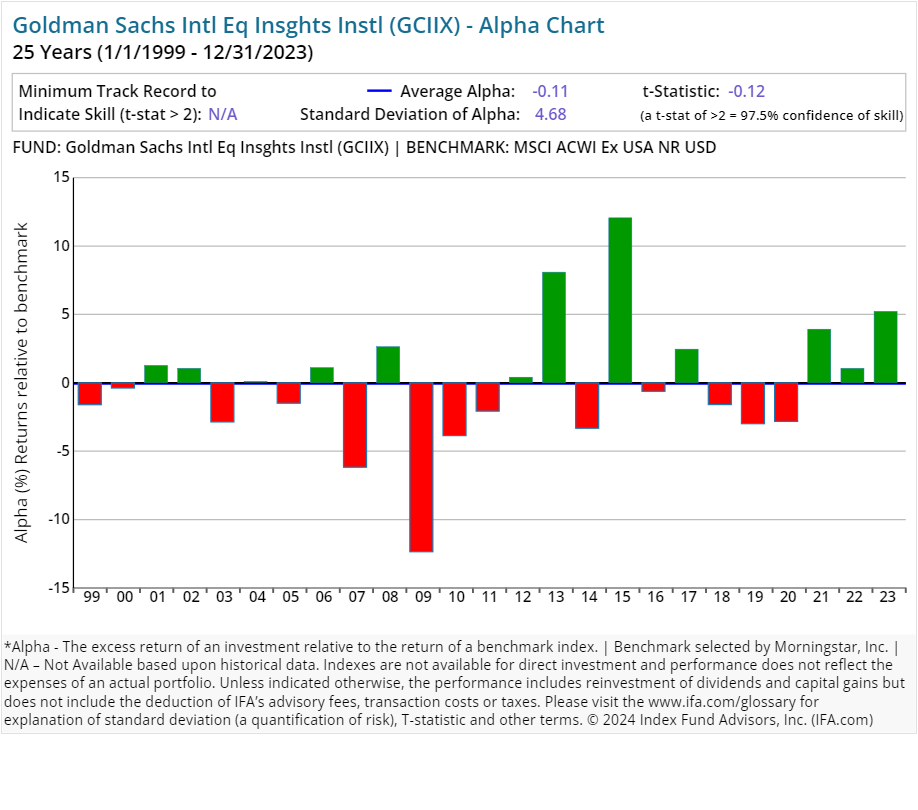
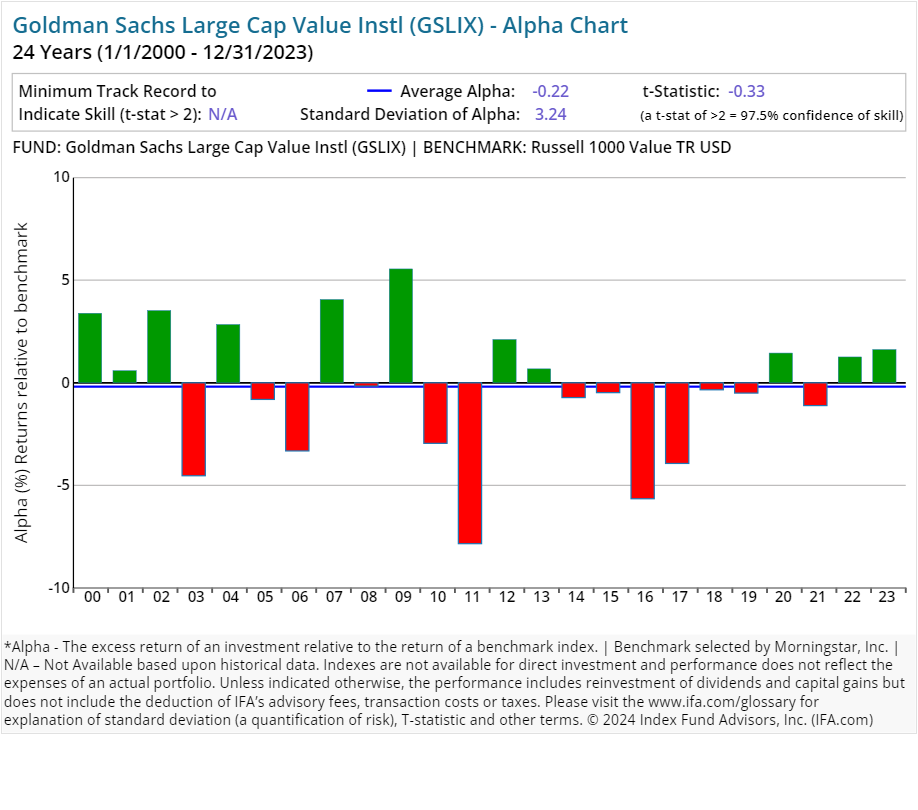
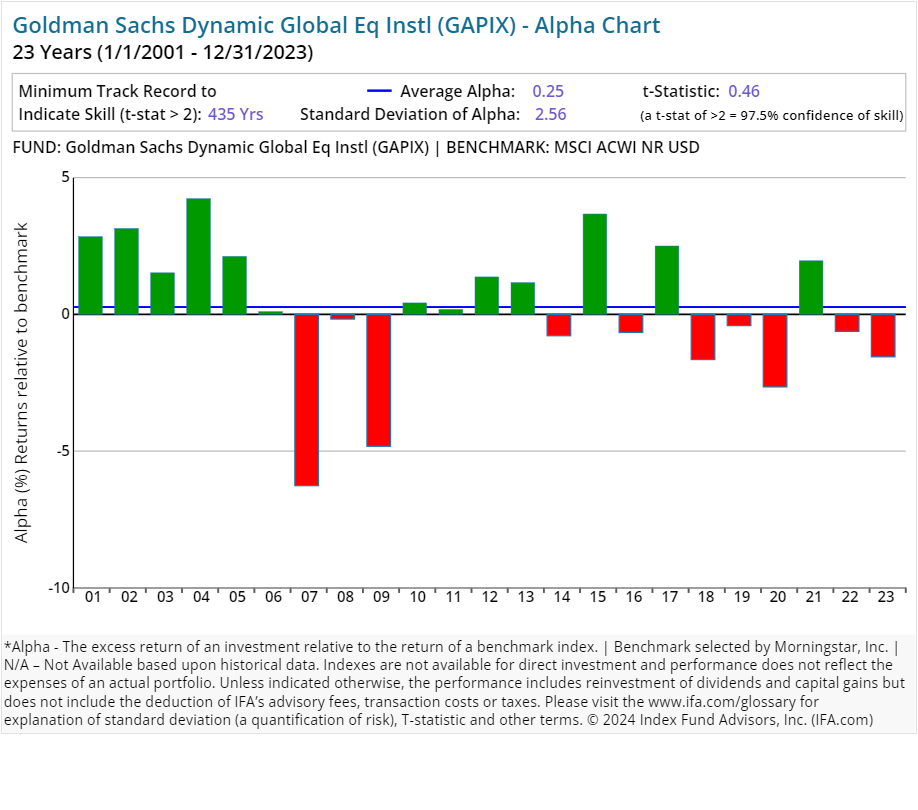
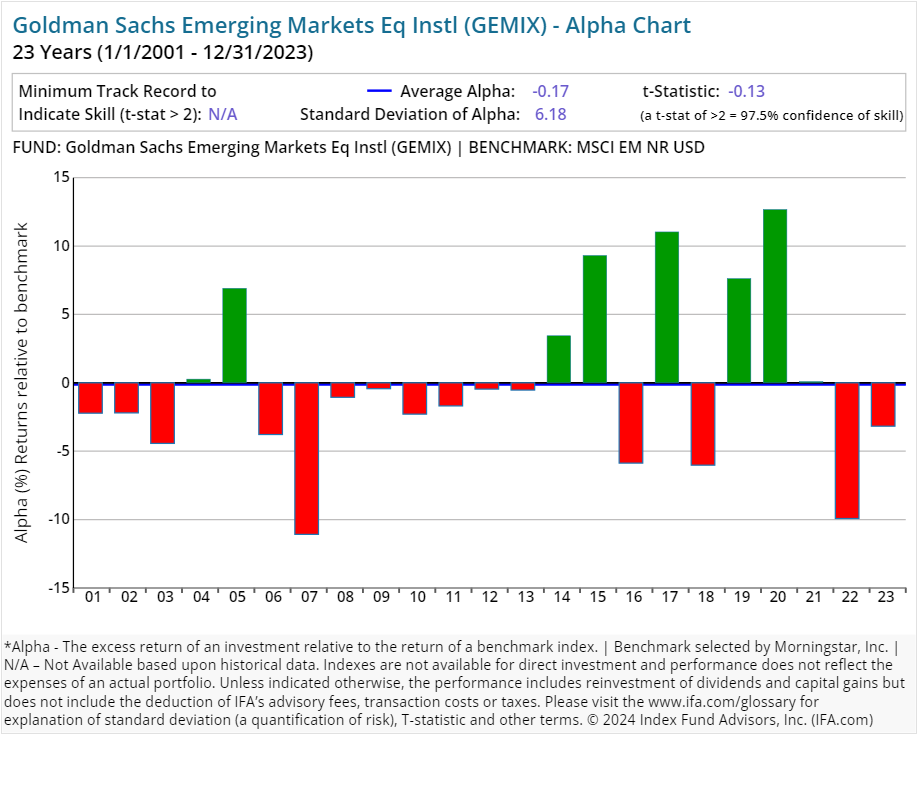
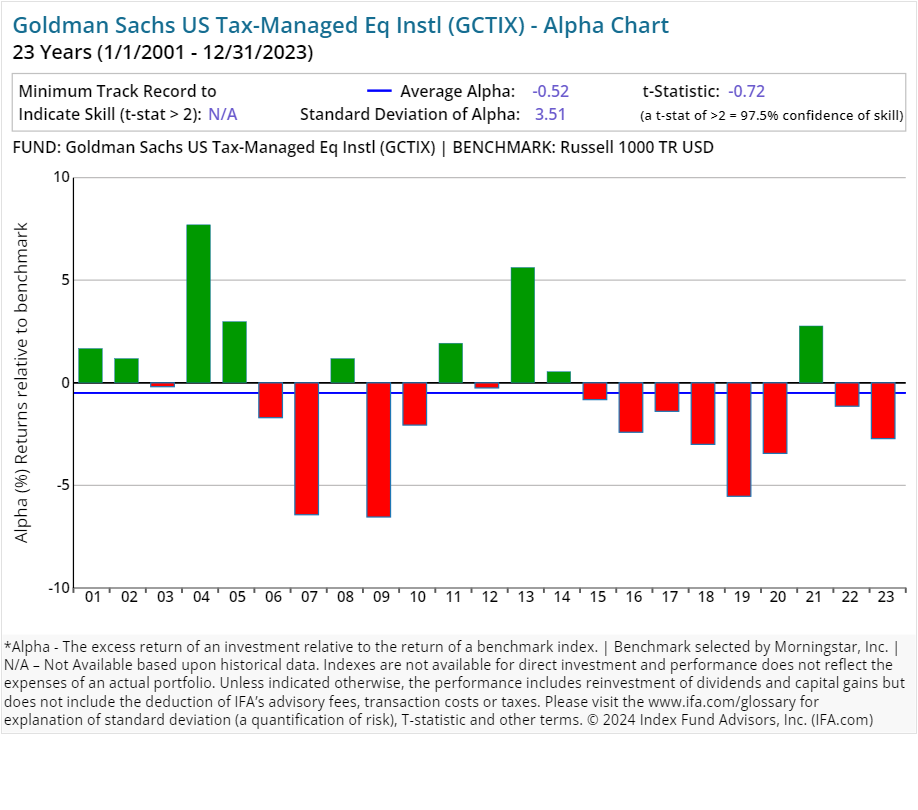
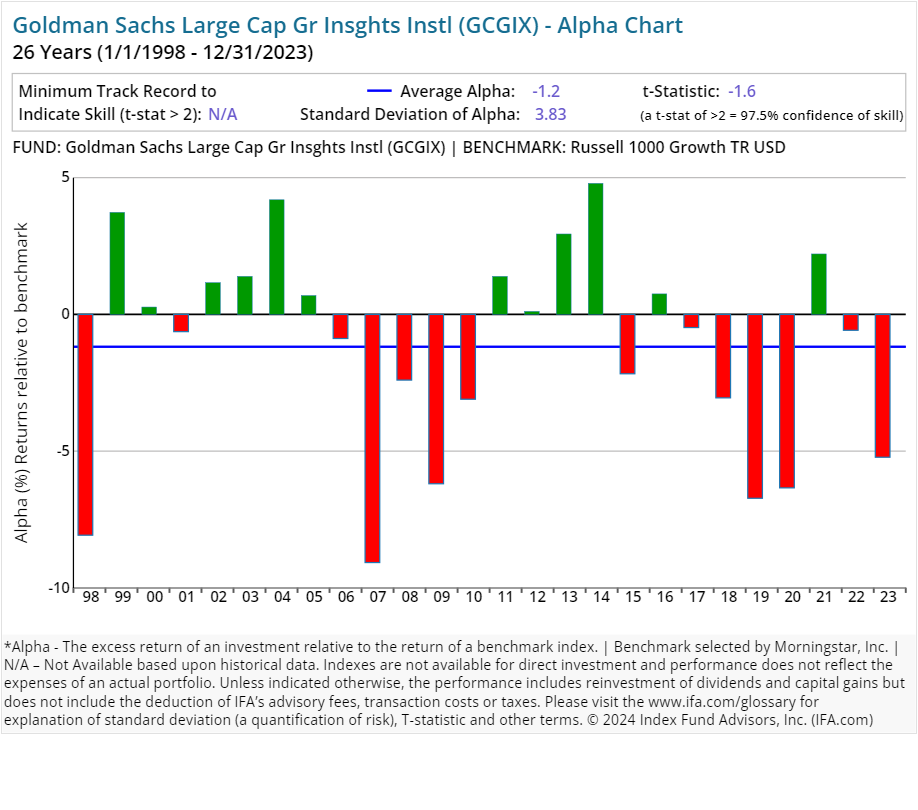
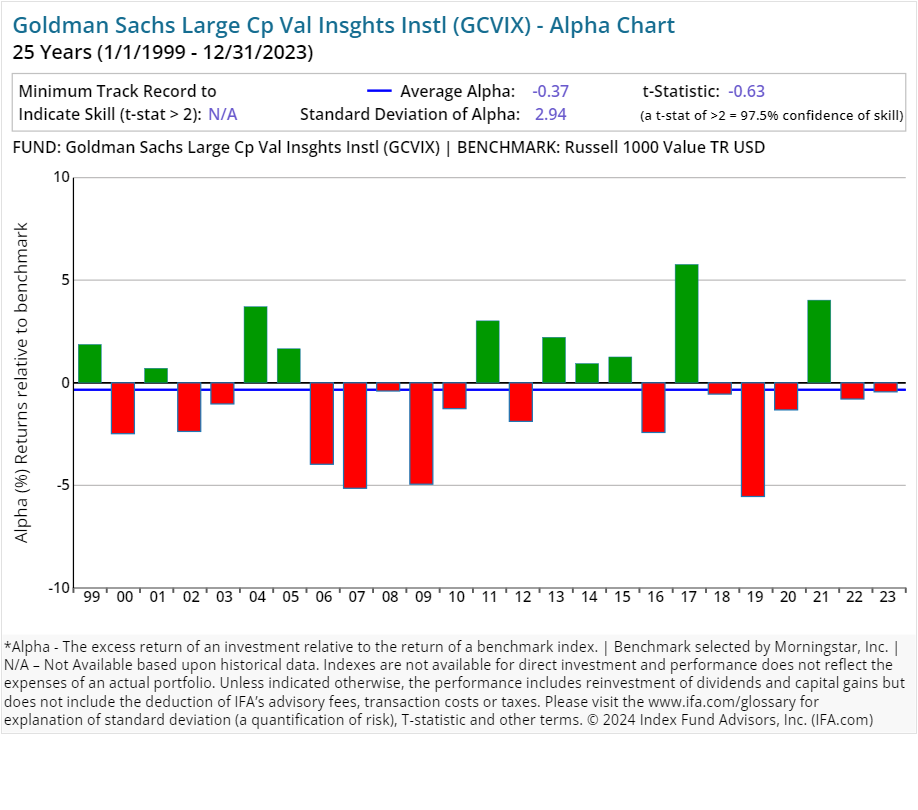
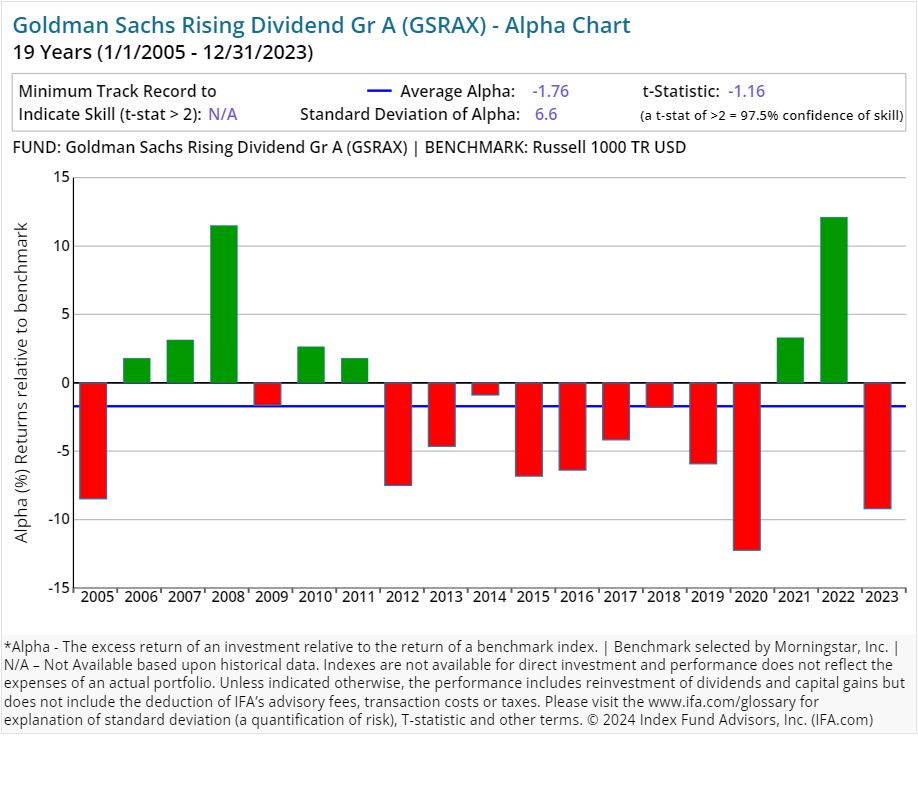
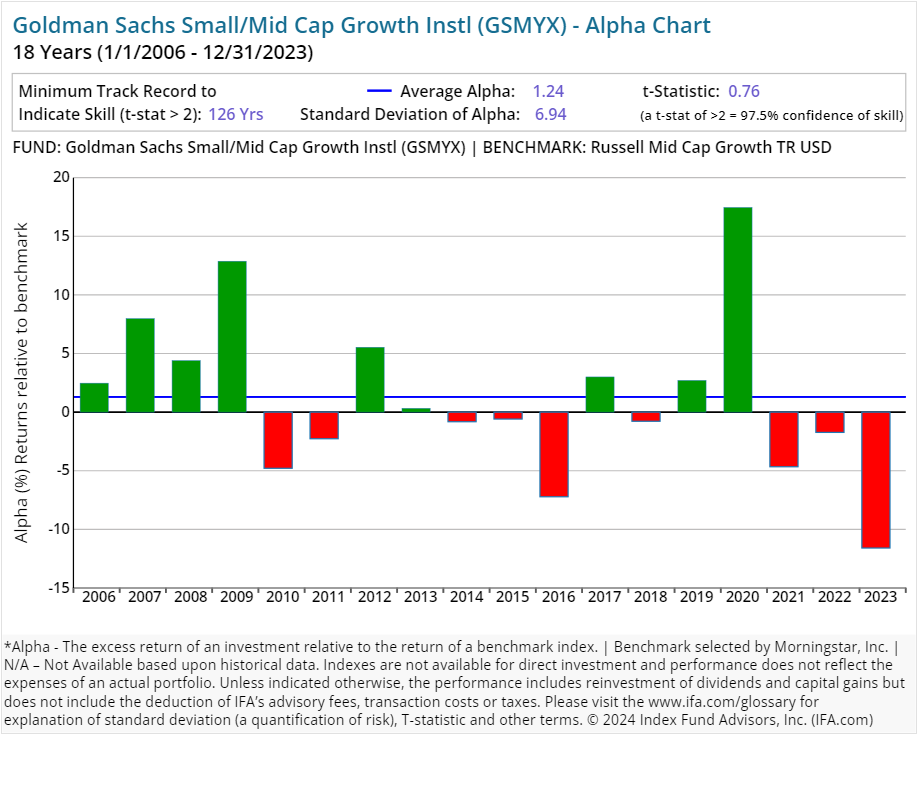
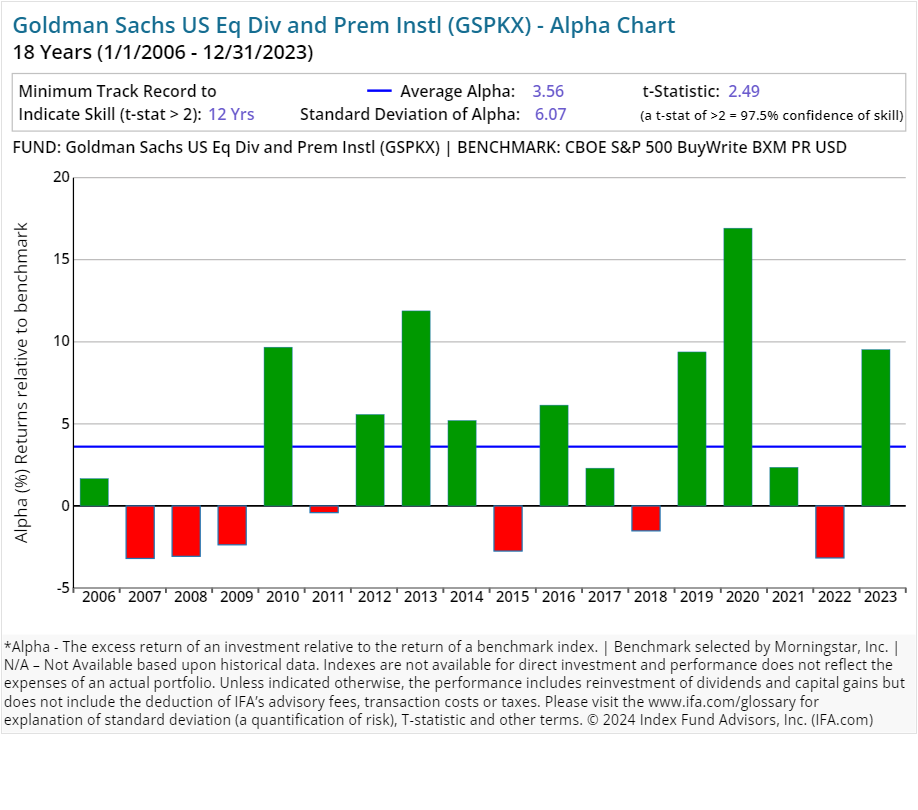
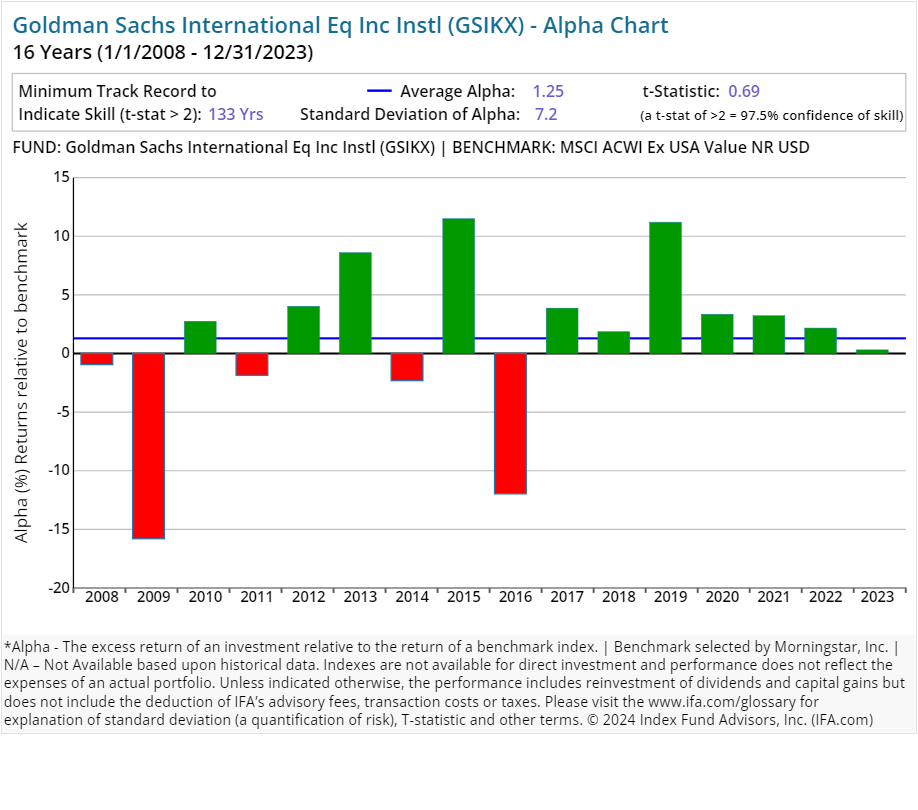
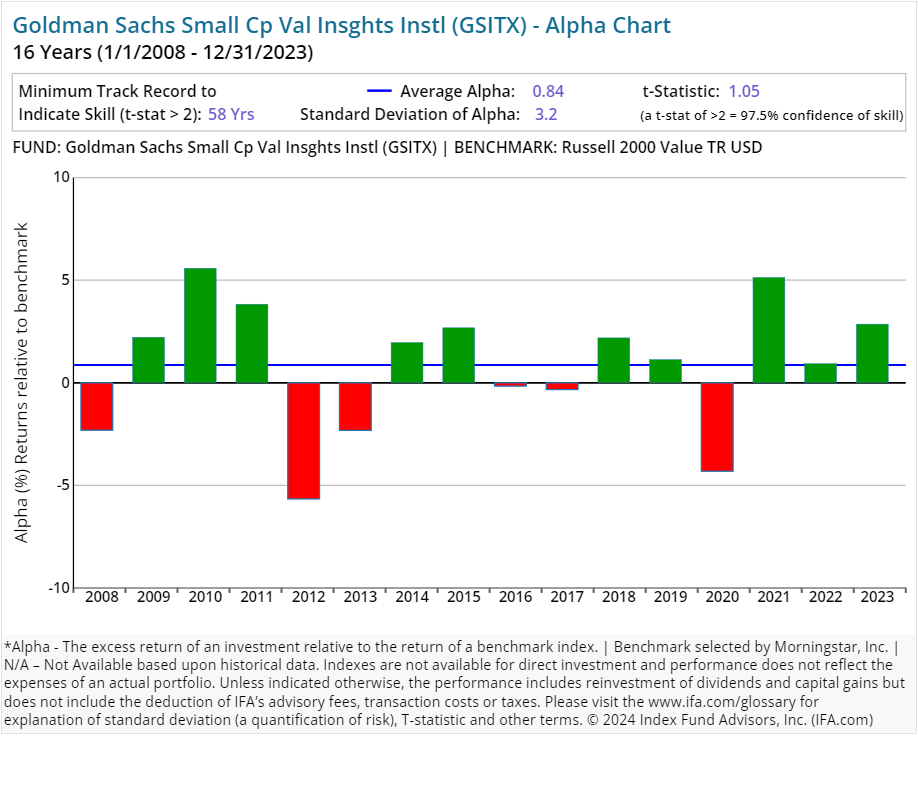
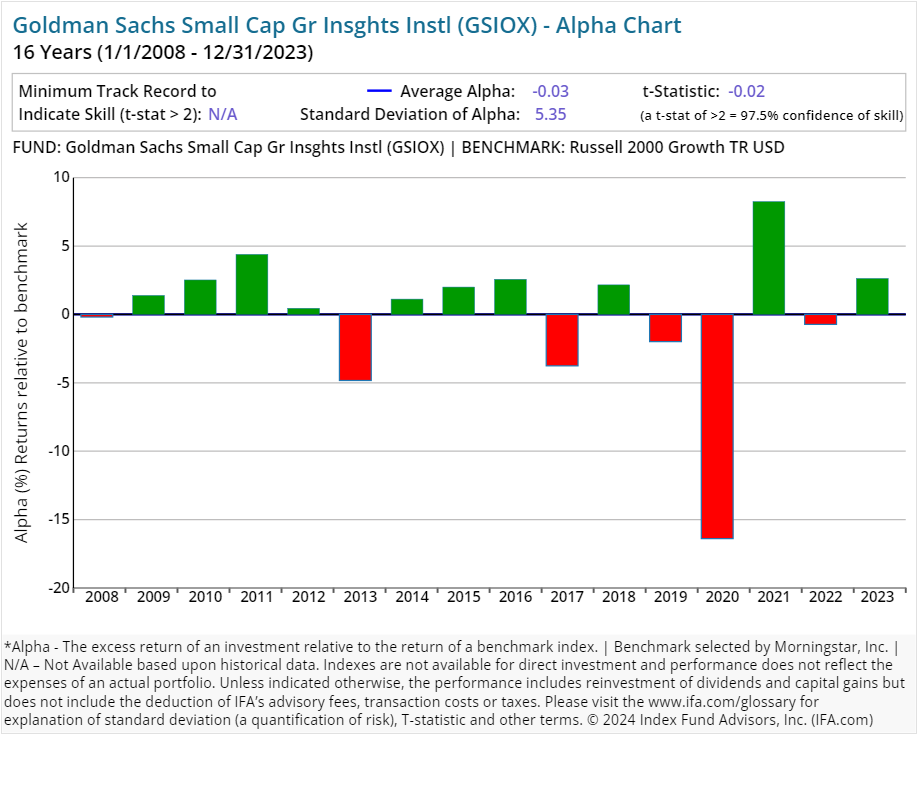
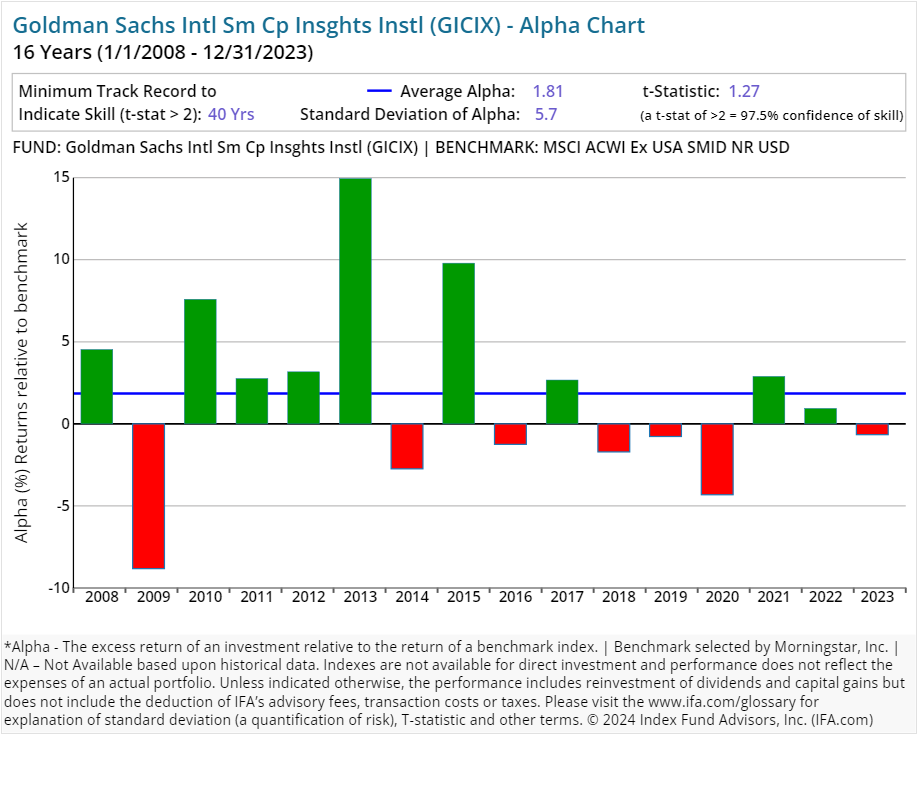
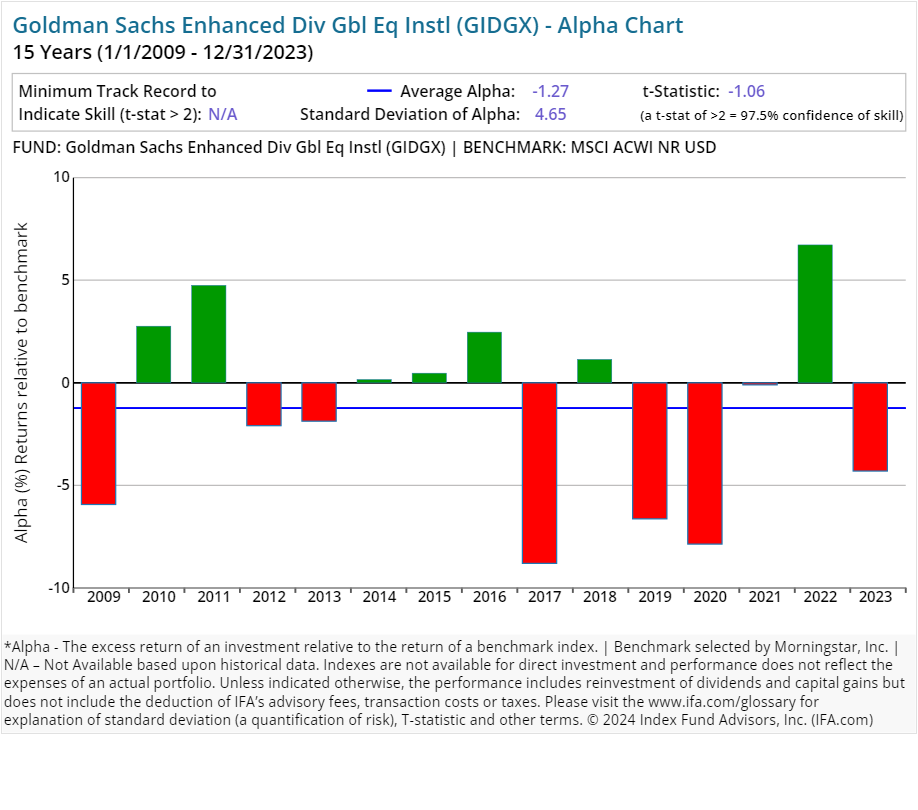
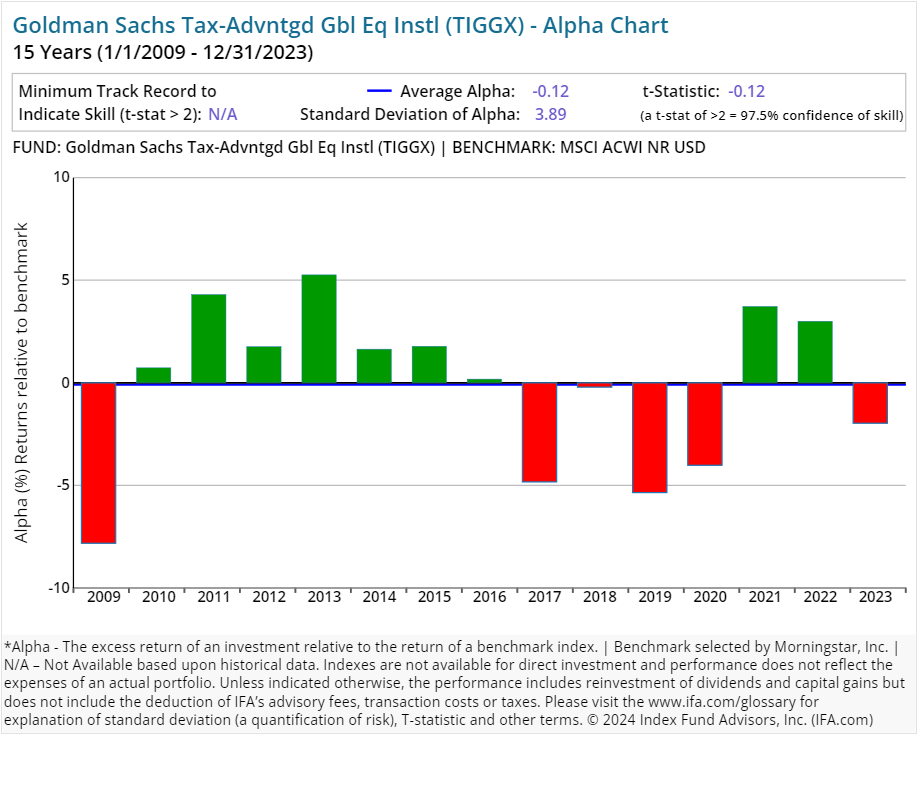
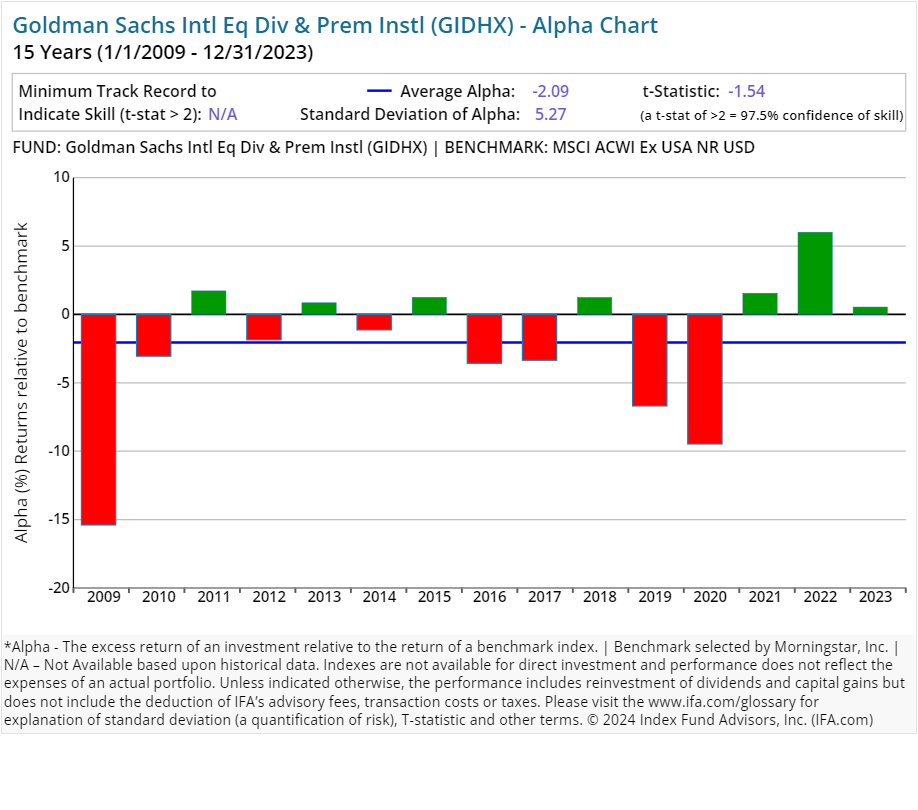
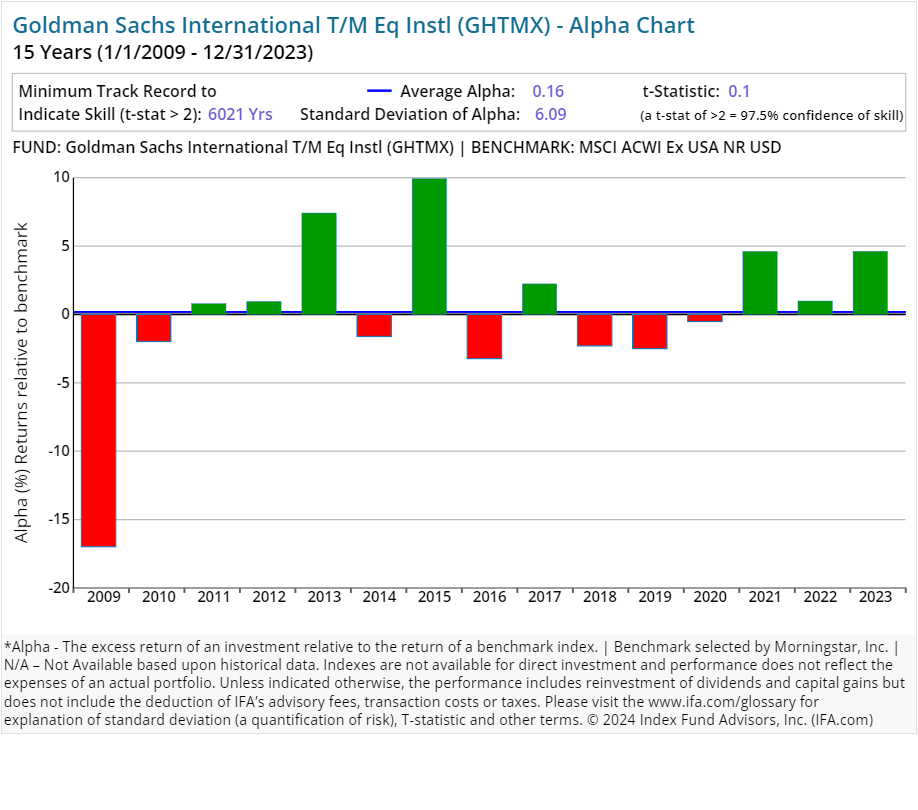
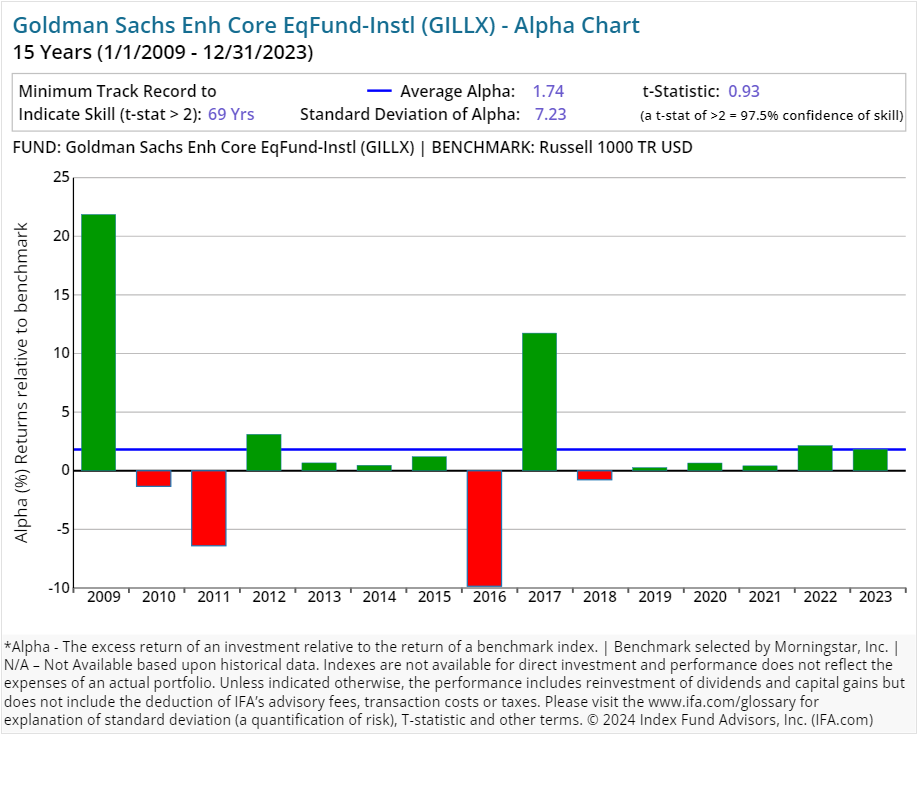
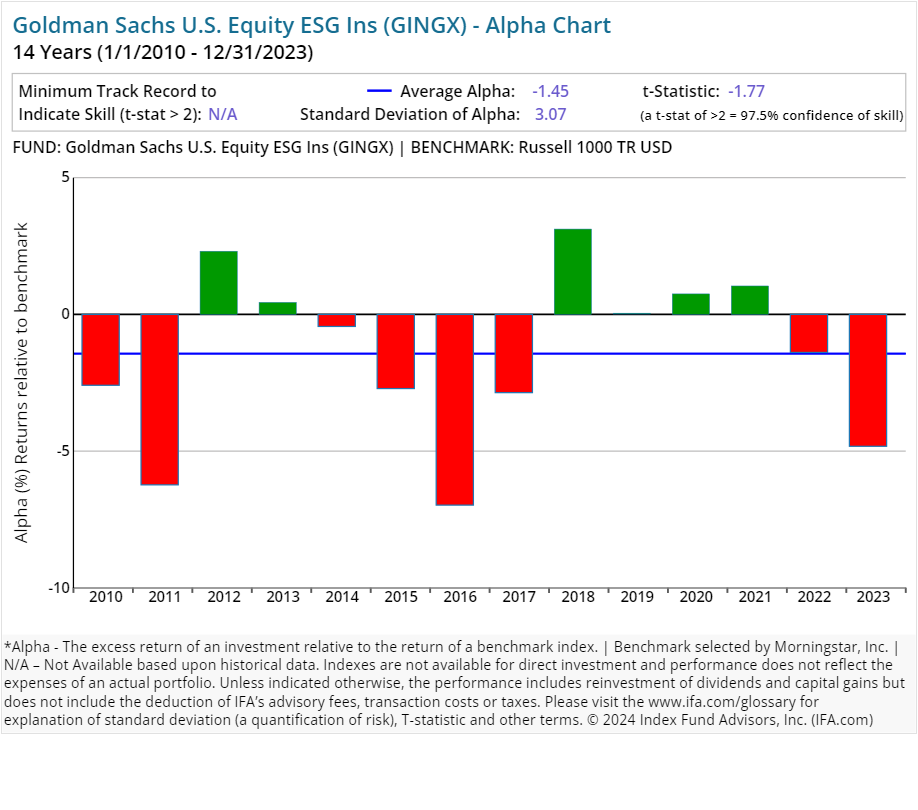
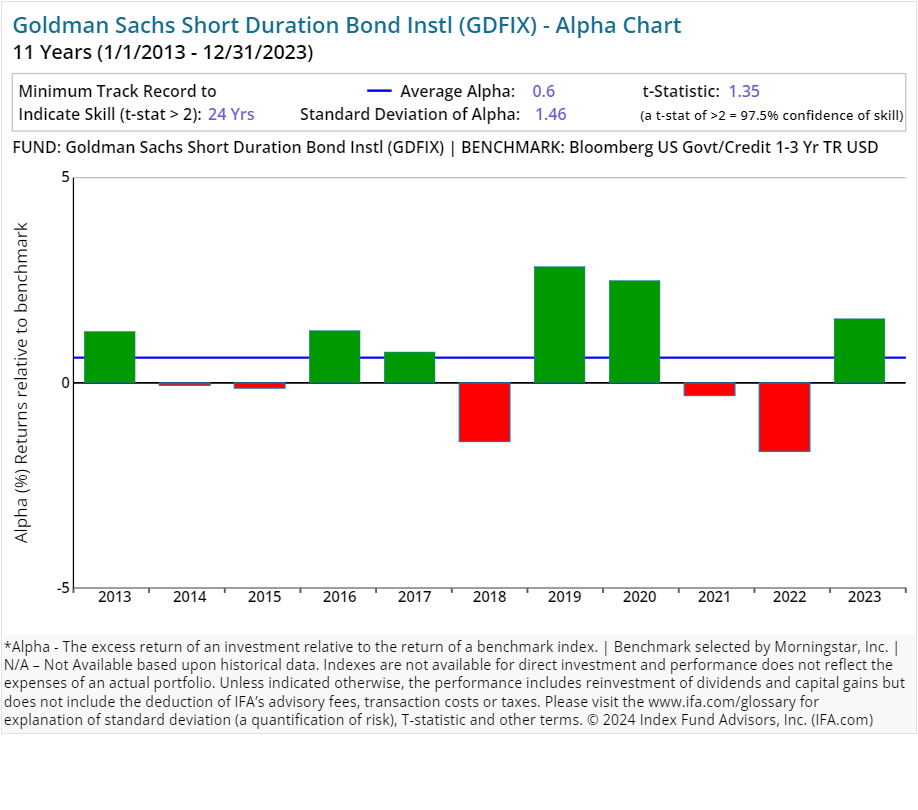
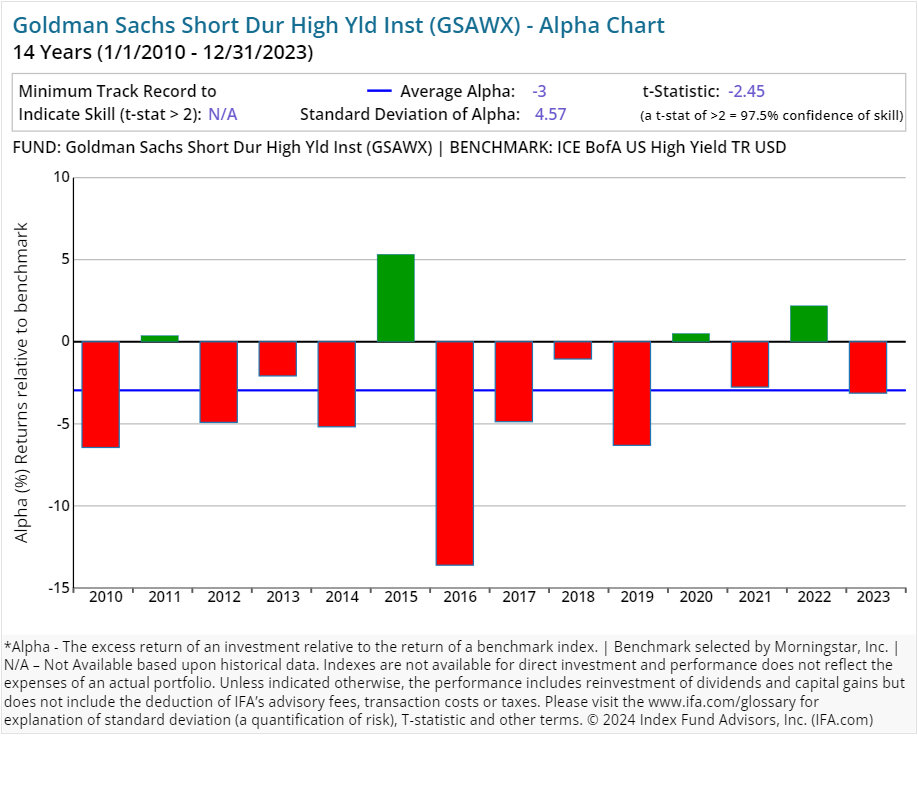
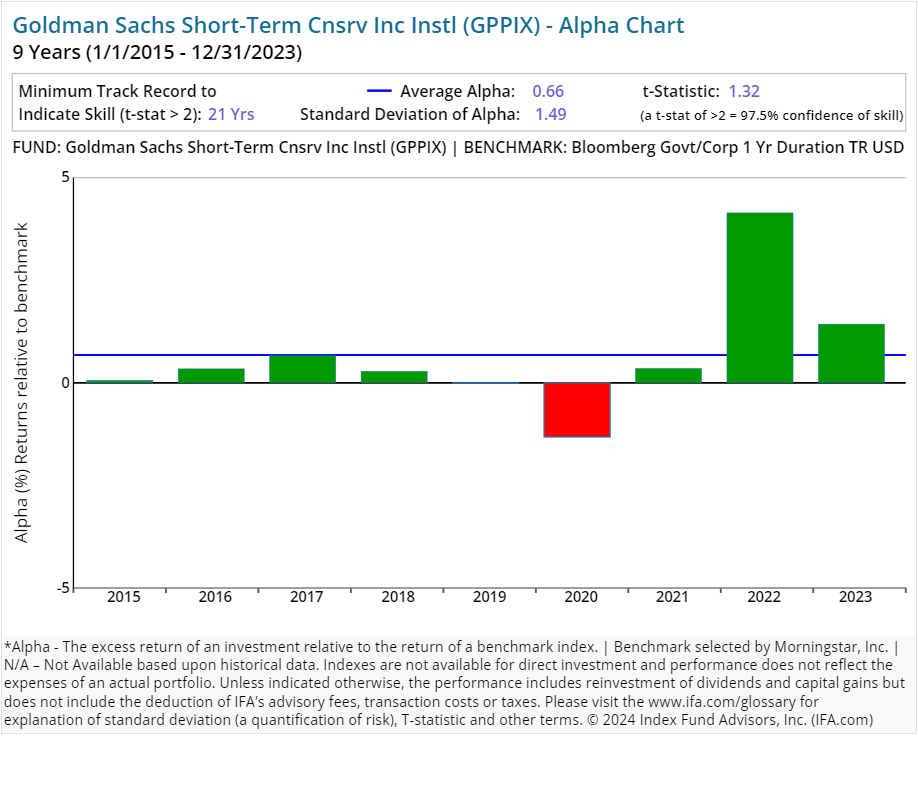
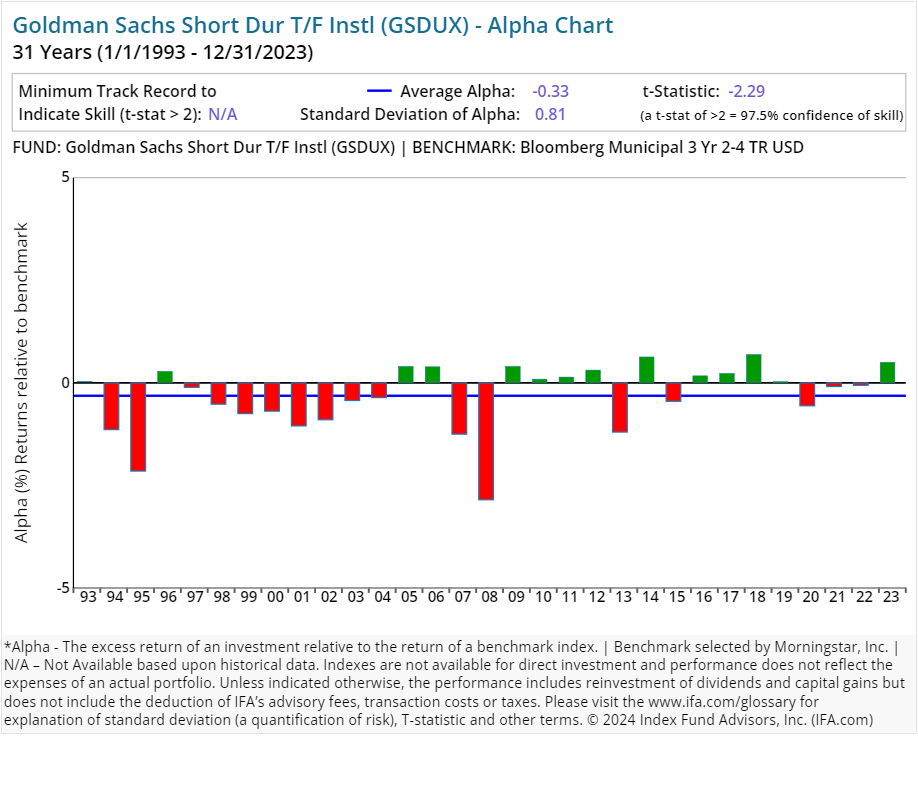
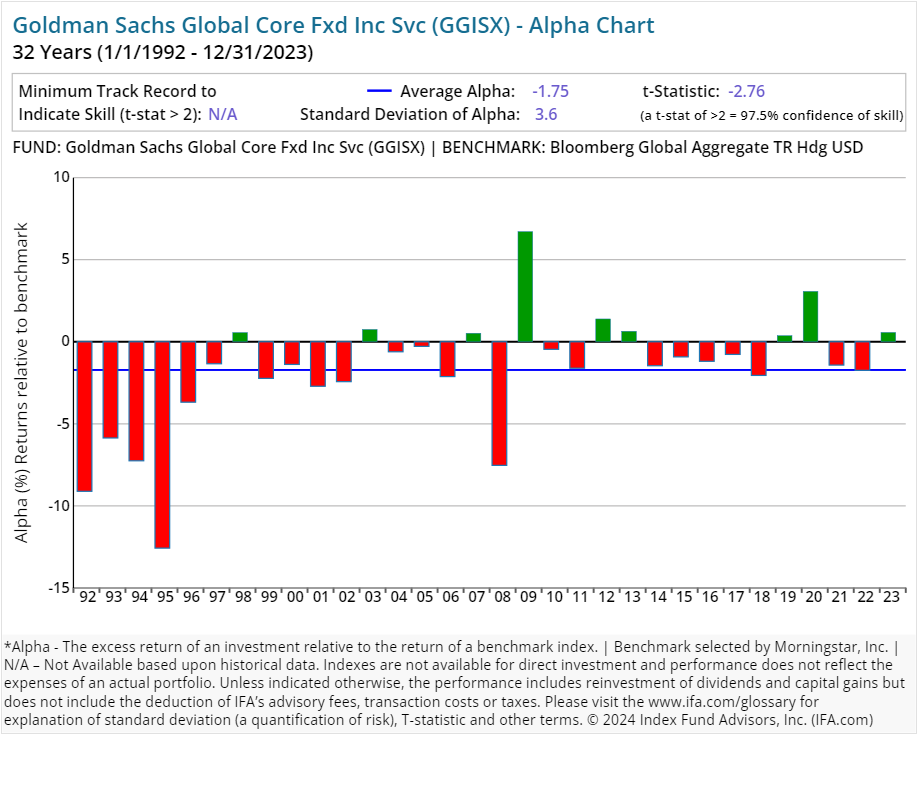
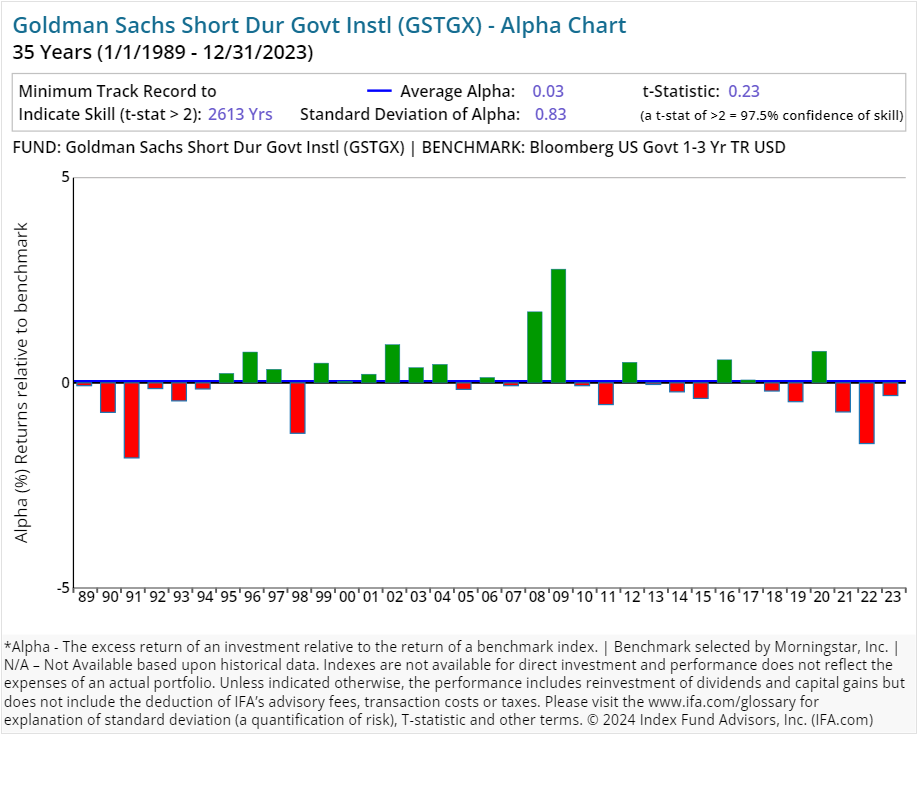
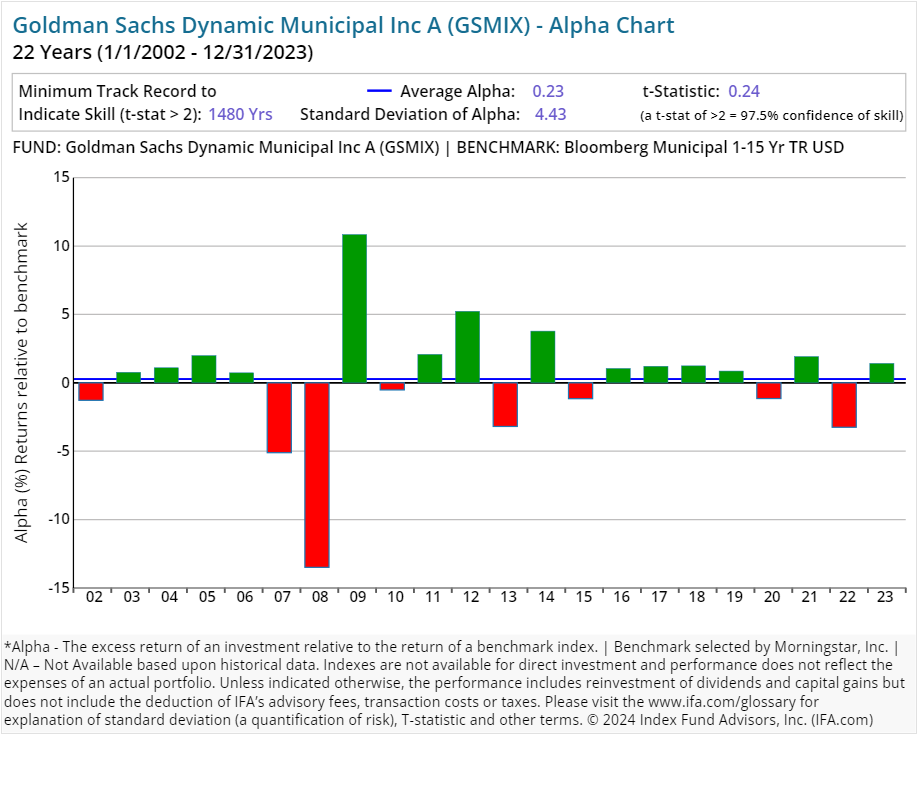
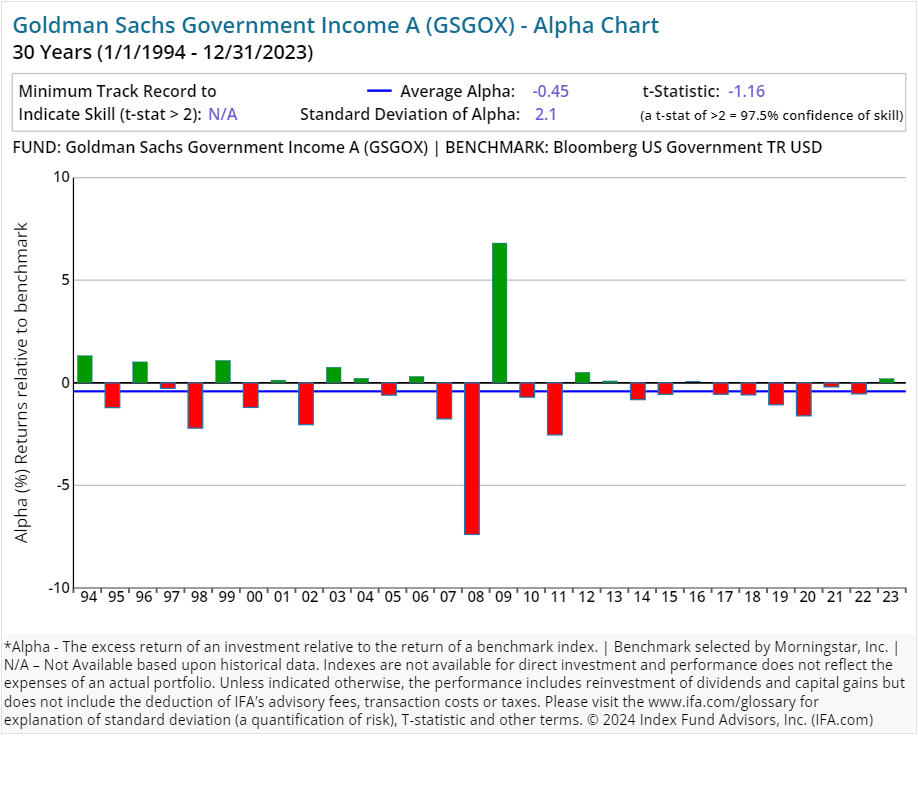
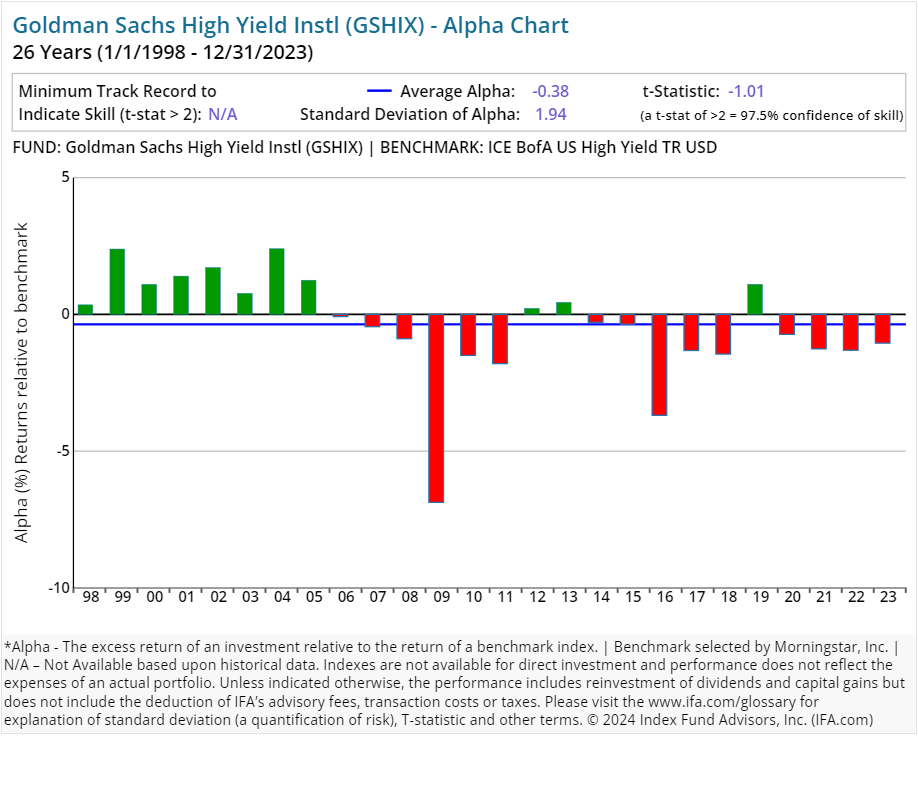
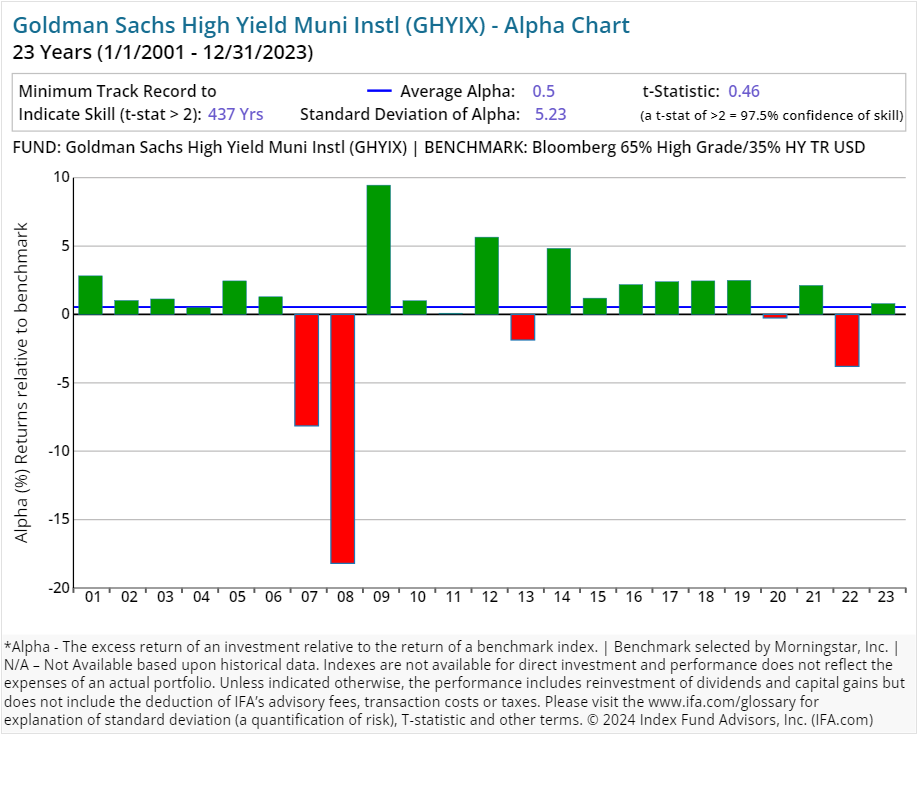
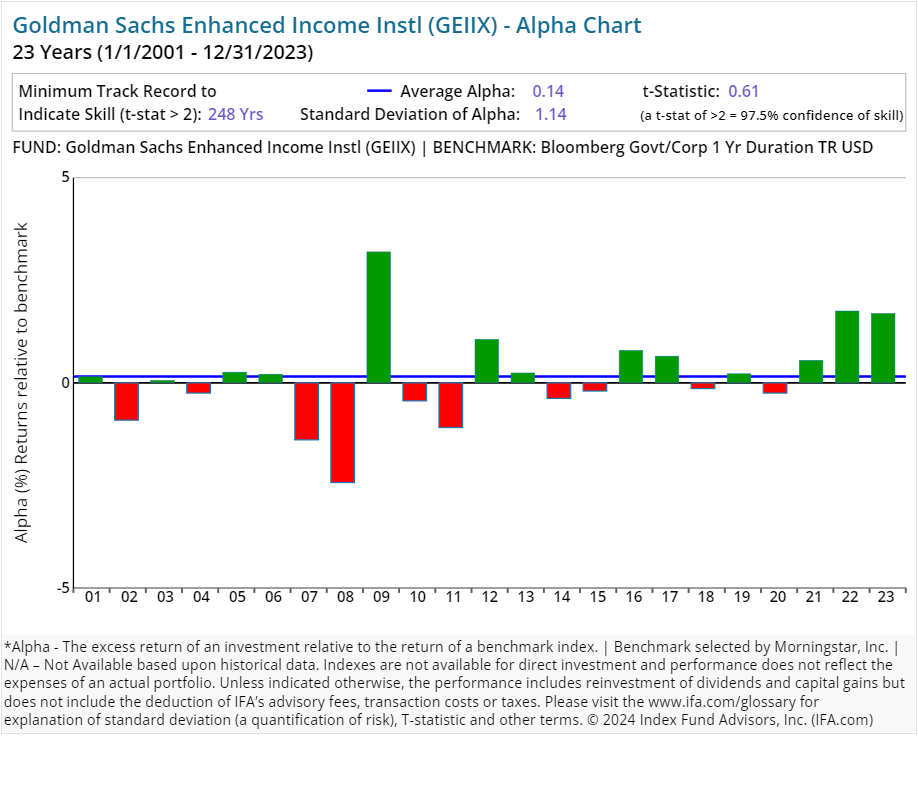
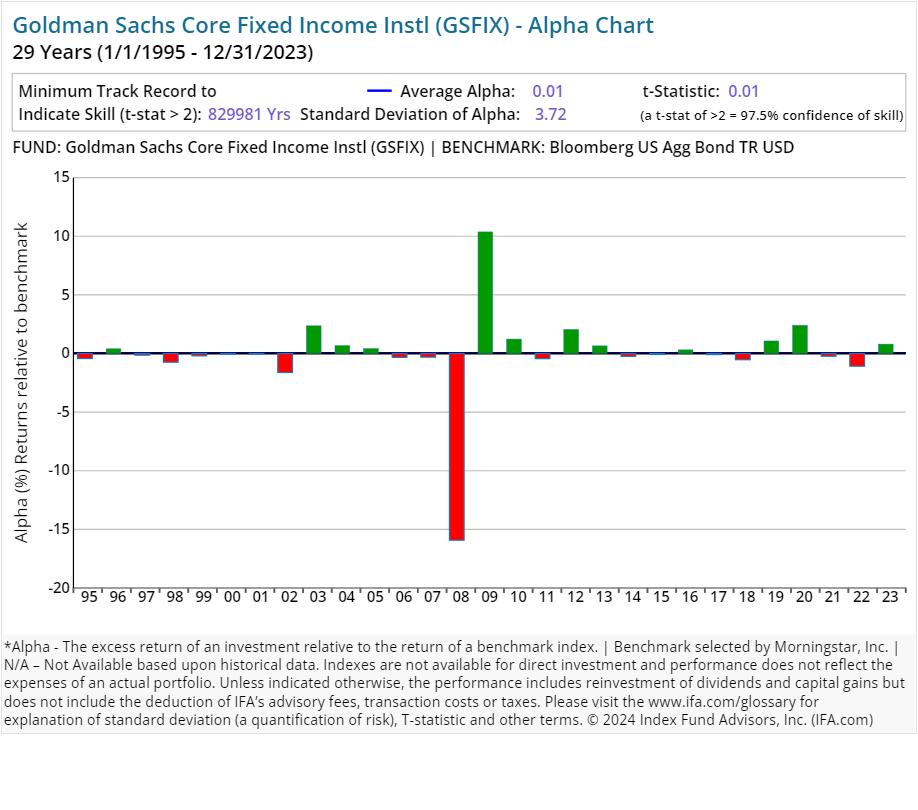
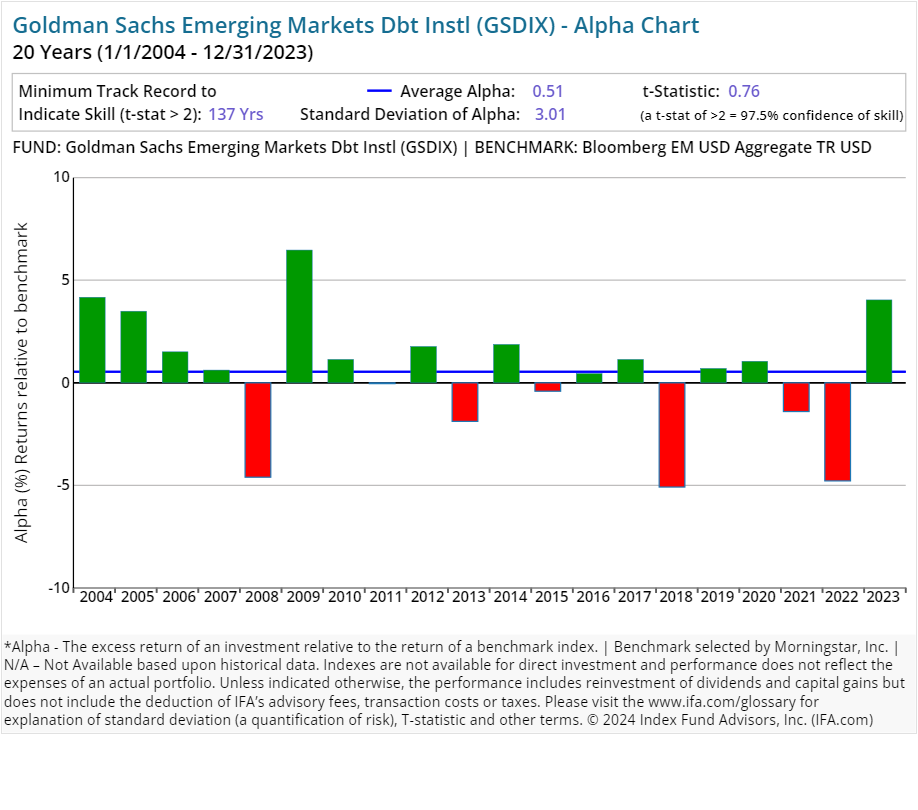
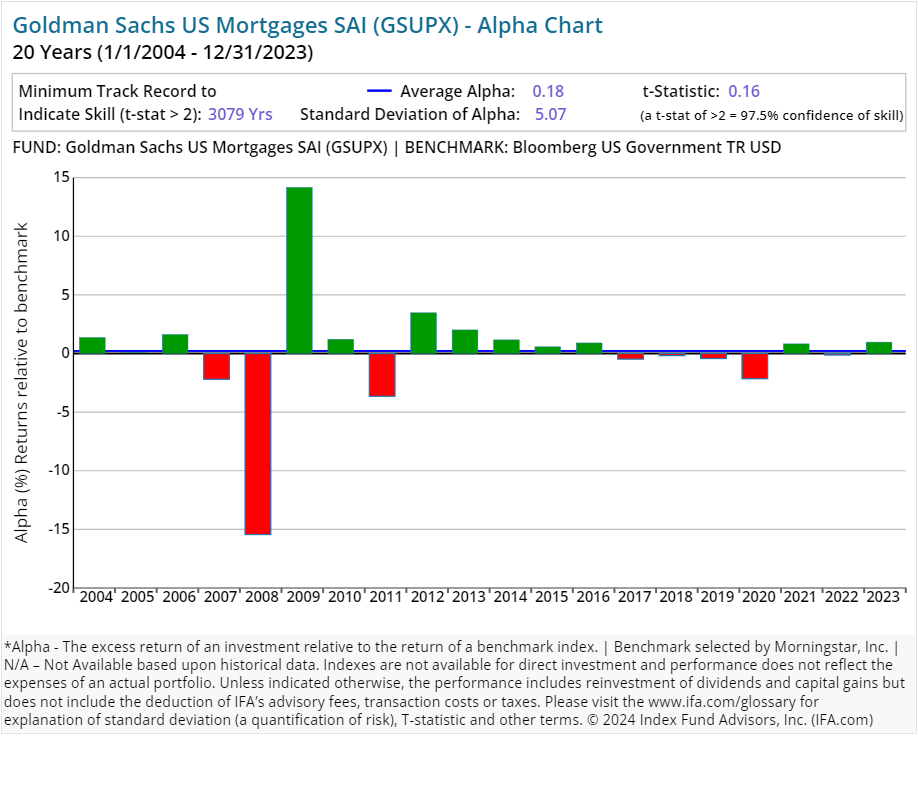
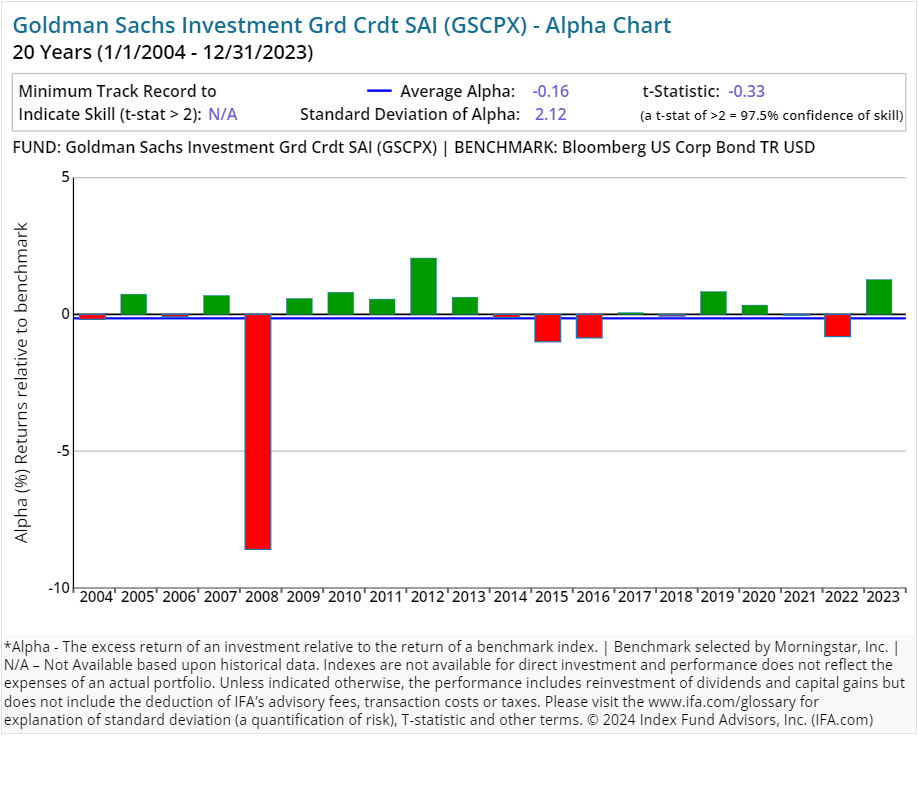
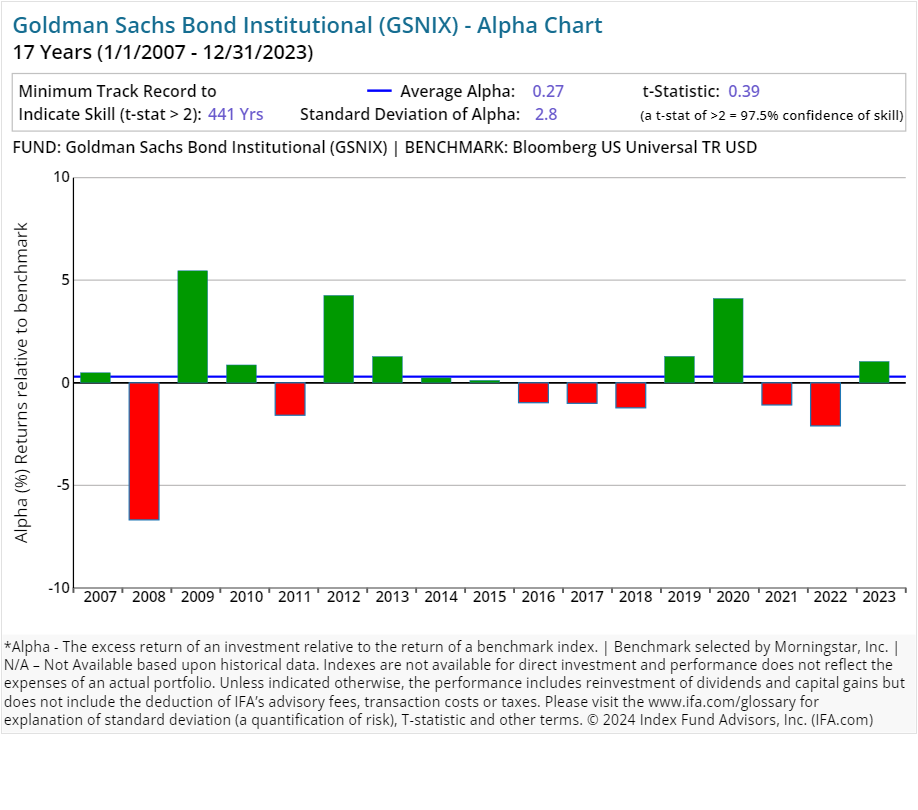
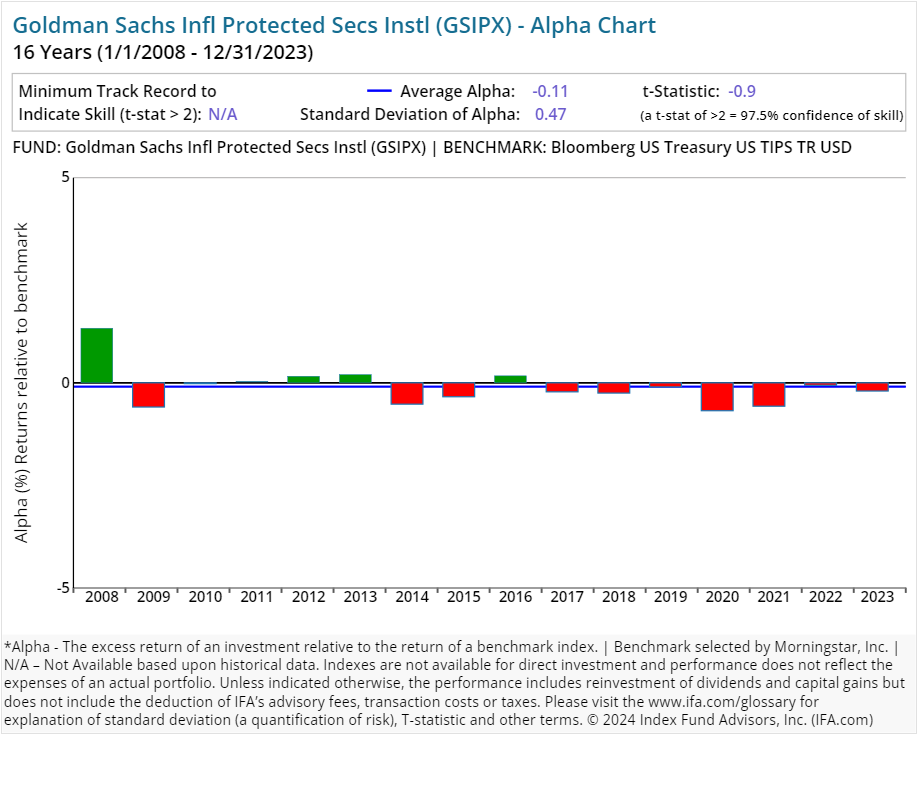
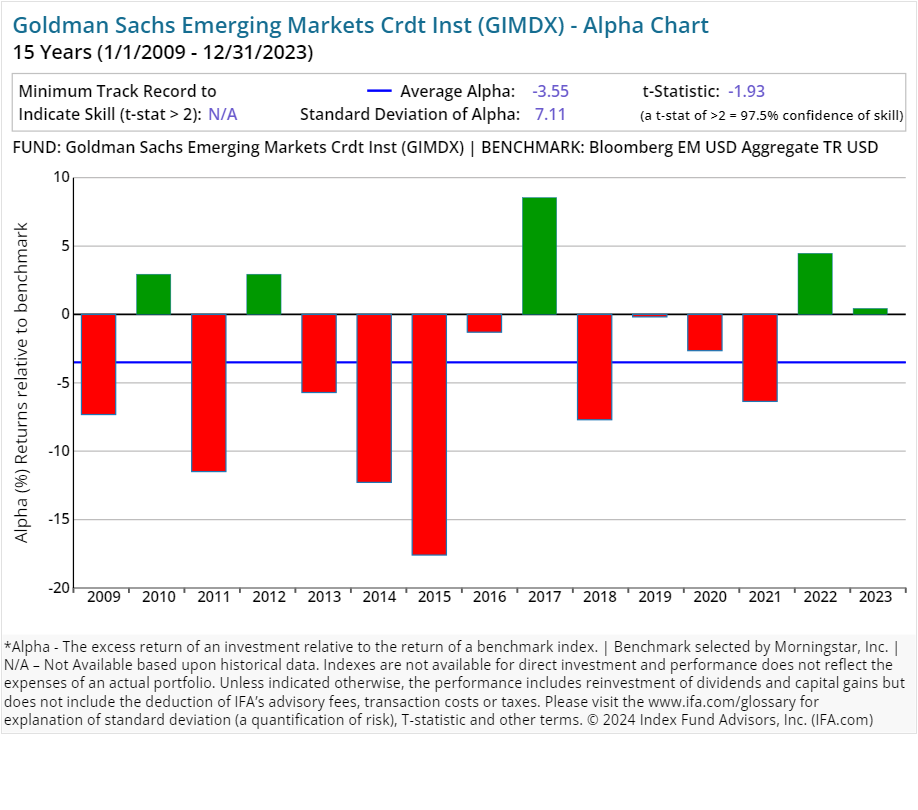
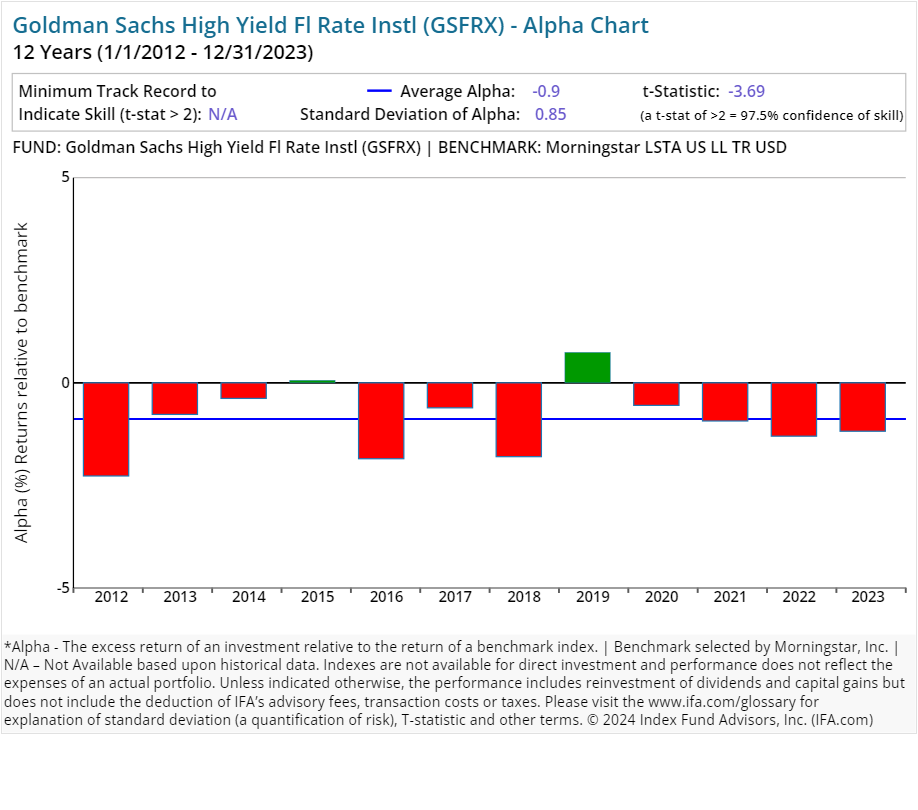
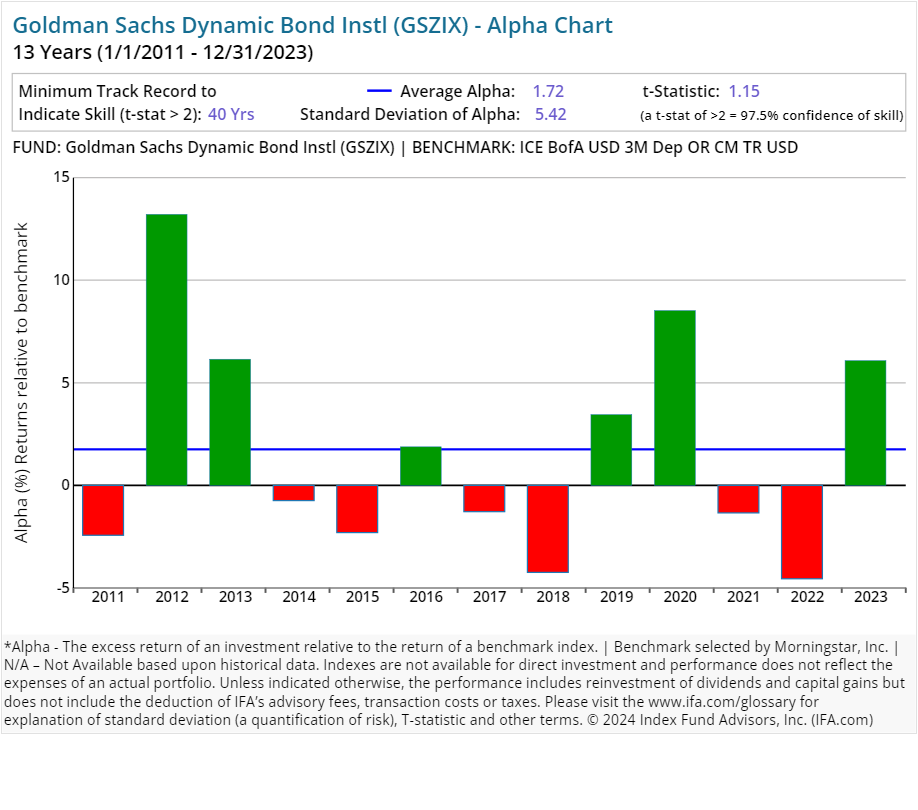
We have included alpha charts for each of Goldman Sachs' current active mutual fund strategies at the bottom of this article. Here is what we found:
- 69.07% (67 of 97 funds) have underperformed their respective benchmarks or did not survive the period since inception.
- 30.93% (30 of 97 funds) have outperformed their respective benchmarks since inception, having delivered a positive alpha.
Here's the real kicker, however:
- 1.03% (1 of 97 funds) have outperformed their respective benchmarks consistently enough since inception to provide 97.5% confidence that such outperformance will persist as opposed to being based on random outcomes.
So, relatively few — only 1% — of Goldman Sachs' active mutual fund managers were able to deliver statistically significant benchmark outperformance. The inclusion of the statistical significance of alpha is key to this exercise, as it indicates which outcomes are due to a skill that is likely to repeat and those that are more likely due to a random outcome.
As a result, this study shows that a majority of funds offered by Goldman Sachs have not outperformed Morningstar-assigned benchmarks. The inclusion of statistical significance is key to this exercise as it indicates an outcome that's attributable to skill and potentially repeatable.
Regression Analysis
How we define or choose a benchmark is extremely important. If we relied solely on commercial indices assigned by Morningstar, then we may form a false conclusion that Goldman Sachs has the "secret sauce" as active managers.
Since Morningstar is limited in terms of trying to fit the best commercial benchmark with each fund in existence, there is of course going to be some error in terms of matching up proper characteristics such as average market capitalization or average price-to-earnings ratio.
A better way of controlling these possible discrepancies is to run multiple regressions where we account for the known dimensions (betas) of expected return in the U.S. (i.e., market, size, relative price, etc.).
For example, if we were to look at all of the U.S. based strategies from Goldman Sachs that have been around for the last 10 years, we could run multiple regressions to see what their alpha looks like — once we control for the multiple betas that we know are being systematically priced into the overall market.
Besides using common mathematical concepts of regression analysis, our methodology for this study incorporates a standard point of demarcation for determining the number of years reviewed. Given that many active families have few survivors with records spanning a decade or more, we use this number (10) as a basic threshold for comparing active managers as part of our ongoing Deeper Look series.
The chart below displays the average alpha and standard deviation of that alpha for the past 10 years through 2023. Screening criteria include funds with holdings of 90% or greater in U.S. equities and uses the oldest available share classes.
As shown above, thirty of the mutual funds studied had positive excess returns over the stated benchmarks. At the same time, no actively managed funds produced a statistically significant level of alpha, based on a t-stat of 2.0 or greater. Why is this important? Given the lower costs associated with index funds, we'd have greater confidence of experiencing a more desirable result using a passively managed portfolio of funds compared to one constructed around more expensive actively managed funds. (A review of how to calculate a fund's t-stat can be found at the end — right after the presentations of the individual alpha charts for each Goldman Sachs fund included in this study.)
Conclusion
Like many of the other largest financial institutions, a deep analysis into the performance of Goldman Sachs has yielded a not so surprising result: Active management is likely to fail many investors. We believe this is due to market efficiency, costs and increased competition in the financial services sector.
As we always like to remind investors, a more reliable investment strategy for capturing the returns of global markets is to buy, hold and rebalance a globally diversified portfolio of index funds.
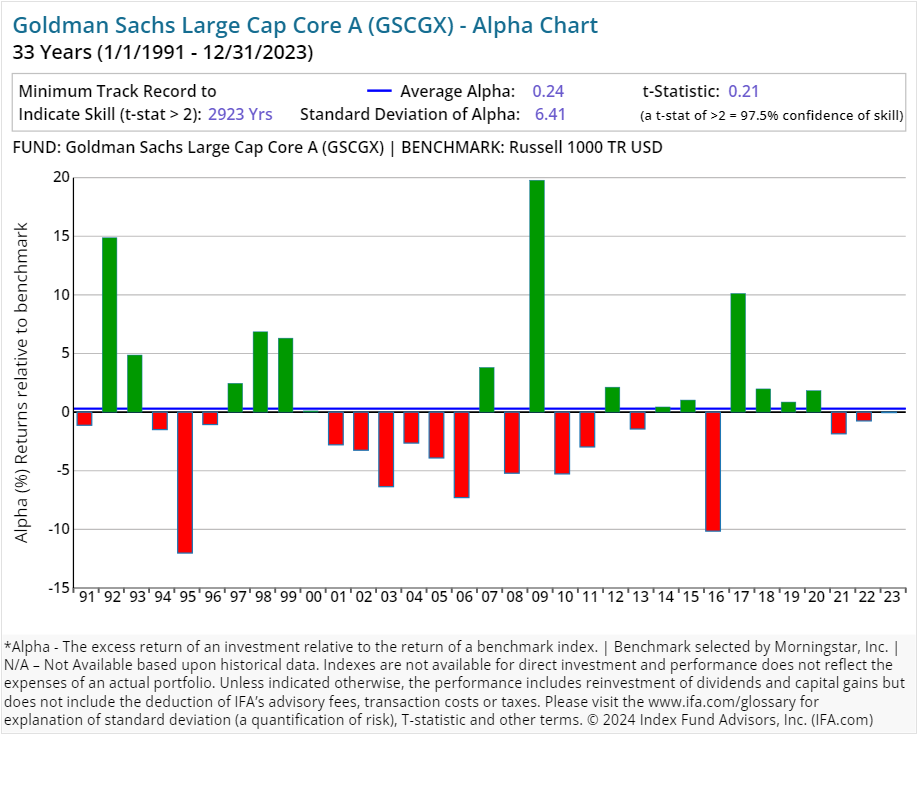
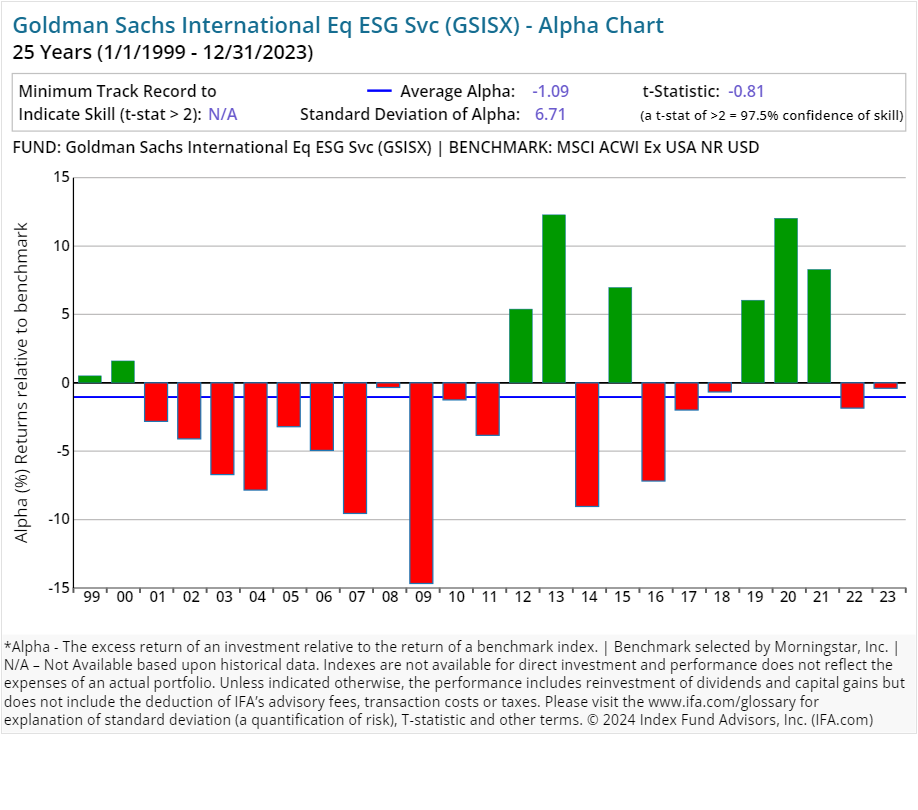
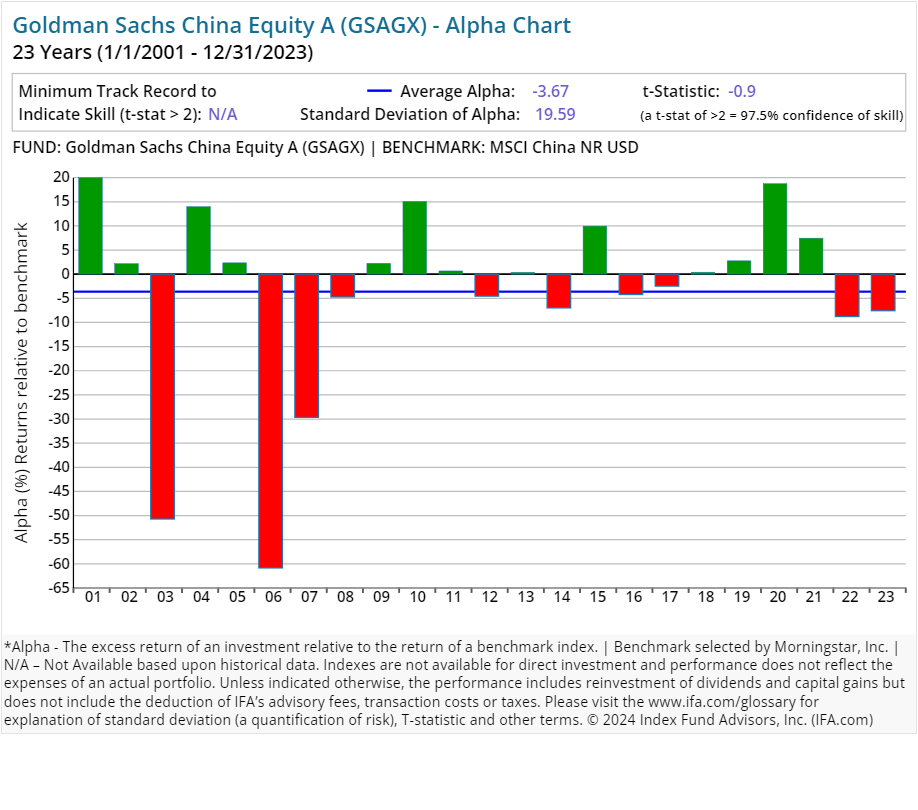
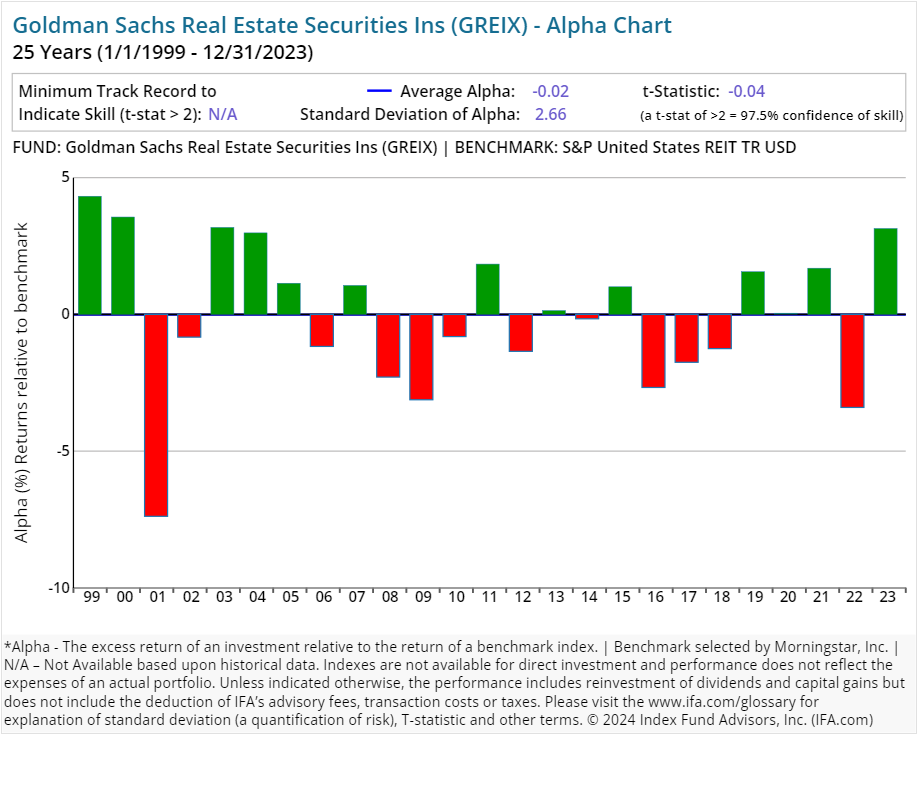
Below are the individual alpha charts for the existing Goldman Sachs funds that have five years or more of a track record.
Here is a calculator to determine the t-stat. Don't trust an alpha or average return without one.
The Figure below shows the formula to calculate the number of years needed for a t-stat of 2. We first determine the excess return over a benchmark (the alpha) then determine the regularity of the excess returns by calculating the standard deviation of those returns. Based on these two numbers, we can then calculate how many years we need (sample size) to support the manager's claim of skill.
Footnotes:
1.) Active and Index Combined Long-Term Mutual Funds and Exchange‑Traded Funds (ETFs), August 2024, https://www.ici.org/research/stats/combined_active_index
2.) Goldman Sachs Earnings: Strong Start to Year as Investment Banking and Trading Power Results. https://www.morningstar.com/stocks/goldman-sachs-earnings-strong-start-year-investment-banking-trading-power-results
This is not to be construed as an offer, solicitation, recommendation, or endorsement of any particular security, product or service. There is no guarantee investment strategies will be successful. Investing involves risks, including possible loss of principal. Performance may contain both live and back-tested data. Data is provided for illustrative purposes only, it does not represent actual performance of any client portfolio or account and it should not be interpreted as an indication of such performance. IFA Index Portfolios are recommended based on time horizon and risk tolerance. Take the IFA Risk Capacity Survey (www.ifa.com/survey) to determine which portfolio captures the right mix of stock and bond funds best suited to you. For more information about Index Fund Advisors, Inc, please review our brochure at https://www.adviserinfo.sec.gov/ or visit www.ifa.com.

