As many of our readers know, we don't think highly of any form of active investing. In particular, we see more harm than good coming from investment products and strategies put forward by members of the actively managed funds industry.
Such stock and bond jockeys specialize in trying to identify mispriced securities in relatively concentrated portfolios. These managers operate with a hope of trying to beat an underlying index. But a host of fact-based independent research by leading academics — ranging from Nobel laureates Eugene Fama and Harry Markowitz to William Sharpe and Myron Scholes, to name just a few — raise red flags about the wisdom of such an investment thesis.
Along with this growing body of independent academic research, we've undertaken several studies of our own digging into the historical performance of active management. All of this evidence leads IFA's investment committee to a resounding conclusion: these active funds on the whole have failed to deliver on the value proposition they profess, which is to reliably outperform a risk-comparable benchmark.
Although our portfolio management and research team has analyzed some of the largest active mutual fund families in the industry, it does beg the question: What about Dimensional Fund Advisors, the family that IFA most frequently advises its clients to own?
This is a good topic because it allows us to educate our investors about the basic philosophical differences between the approaches taken by the actively managed firms and Dimensional Fund Advisors, which is commonly referred to simply as DFA. (For an in-depth look at DFA's systematic investing approach, you can read "A Blurring of the Lines: What Really is an Index Fund?")
Simply put, those differences can be summarized by stating that markets work, diversification reduces risk and certain company characteristics explain key drivers of long-term returns. Here are five underlying themes inherent in DFA's investment strategies:
1.) Financial markets are efficient. As free-market prices fully incorporate available information, price change consequently reflects unexpected new information; therefore the current price is the best estimate of a fair price.
2.) Risk and return are inseparable. Although there is no such thing as return without risk, not all risks are rewarded. Long-term historical risk and return data informs IFA's investment selection process, and IFA's Index Portfolios seek to capture the historical risk factors that have appropriately compensated investors for risks taken, including market, size, value, and profitability for equity and term and default for fixed income.
3.) Diversification is essential. Diversification within and among asset classes lets investors effectively capture the returns offered by the financial markets, in accordance with their risk capacity.
4.) Structure explains performance. The expected return of a diversified portfolio is determined by its exposure to the compensated risk factors, therefore the high costs and risks of active management are unnecessary and potentially harmful to an investor's long-term outlook.
5.) Advisor Advantage. There are distinct measurable benefits to enlisting the services of a passively oriented advisor, including disciplined rebalancing, tax-loss harvesting, asset allocation, asset location and glide path.
In a nutshell, Dimensional accepts the basic premise that markets are fairly pricing securities based on the associated risks. By contrast, most of DFA's active rivals believe that free markets most of the time aren't performing the basic function of setting fair prices. As a result, active managers generally believe they can buy securities at "undervalued" prices and time those deals in ways that can avoid holding "overvalued" assets. As Rex Sinquefeld cleverly put it, "So who believes markets don't work? Apparently it is only the North Koreans, the Cubans and the active managers."
Dimensions of Expected Stock and Bond Returns
Is there only one type of risk that investors should consider? Actually, there are multiple dimensions of risk associated with stock and bond markets. Those identified by leading academics include: size, value, profitability, capital investment, default rates and term structures.
Think of these factors as the components of the engine in your car. Like an auto's ability to perform, the driving force behind stock and bond returns are these factors that are being considered by investors and are therefore (consciously or subconsciously) being embedded into securities prices.
This is extremely important to understand because it's going to explain the discrepancies that we see when examining performances of both actively managed funds as well as passively managed mutual funds and ETFs. It also allows us to explain the outperformance of DFA's strategies against well-known index fund rivals such as Vanguard.
When comparing index funds to indexes, the analysis is more about the differences in indexes (factor exposures) rather than the existence of alpha (selecting stocks or bonds from within a benchmark). This is what makes Dimensional different — by including tilts to size, value and profitability, DFA's portfolio managers essentially create their own measures to capture different asset classes. Then, they execute implementation of those securities in their funds using rules that minimize market impact and other (explicit as well as implicit) trading costs.
The chart below illustrates the difference among Russell indexes and Dimensional's asset class-based funds over 40-plus years (1979 through 2024), a period that starts from some of these Russell benchmarks' inception dates.
The scales on this chart are important to understand. On the y-axis you have a scale of company size, with 0 representing the average company size of a total market index fund, 0.92 representing a micro-cap company and -0.33 representing a mega-cap firm. The x-axis scale represents a book-to-market ratio, which is a value quantification. On the left side are growth companies, and on the right side are value companies.
This type of an analysis using a popular benchmarking family is another piece of evidence giving IFA's investment committee confidence that an index fund with a smaller and more value tilted design is preferred to a larger and less-value tilted one. Data over an even longer period also supports that small and value tilts had higher returns in U.S. markets.
Based on our review of long-term data, there has been an investment premium for patient investors holding consistent exposure to such risk factors. These are referred to as: the U.S. Equity Premium (Risk of the Total Market Minus Risk Free 30 day T-Bill); the U.S. Value Premium (High Book to Market Minus Low Book to Market); and the U.S. Size Premium (Small Companies Minus Big Companies).
An important consideration for investors is the likelihood that these risk "premiums" are actually zero (i.e., there is no premium) despite a historical mean that is positive. The starting point is calculating a t-stat for each premium return series as outlined in the bar charts and data below. The blue bars indicate a positive excess return for the factor premium and the red bars indicate a negative factor premium. The t-stats, as shown in the bottom section of the chart, are all considered statistically significant (i.e., greater than 2), and we can almost be 97.5% sure that all three risk premiums are positive.
Fees & Expenses
Let's get into the actual data. We examined funds offered by Dimensional Fund Advisors that Index Fund Advisors recommends to its clients. There are many other funds from DFA that are either duplications of existing asset classes or funds that IFA does not think will add incremental value to a globally diversified portfolio.
The costs we examine include expense ratios, front end (A), deferred (B) and level (C) loads, and 12b-1 fees (there are no loads or 12b-1 fees in Dimensional's funds). These are considered the "hard" costs that investors incur. Prospectuses, however, do not reflect the trading costs associated with mutual funds. Commissions and market impact costs are real costs associated with implementing a particular investment strategy and can vary depending on the frequency and size of the trades taken by portfolio managers.
We can estimate the costs associated with an investment strategy by looking at its annual turnover ratio. For example, a turnover ratio of 100% means that the portfolio manager turns over the entire portfolio in one year. This is considered an active approach and investors holding these funds in taxable accounts will likely incur a higher exposure to tax liabilities such as short and long term capital gains distributions than those incurred by passively managed funds.
The table below details the hard costs, as well as the turnover ratios, for 82 mutual funds and exchange-traded funds offered by DFA that IFA utilizes in our IFA Index Portfolios. You can search this page for a symbol or name by using Control F in Windows or Command F on a Mac. Then click the link to see the alpha chart. Also remember: this is considered an in-sample test; the next level of analysis is to do an out-of-sample test.
On average, an investor who utilized an equity strategy from Dimensional experienced a 0.31% expense ratio. Similarly, an investor who utilized a bond strategy from DFA paid an average annual expense ratio of 0.19%. The average turnover ratios for equity and bond strategies from Dimensional were 12.82% and 54.66%, respectively. This implies an average holding period of about 21.95 months for equity funds and 93.58 months for fixed-income funds. (Of note: The relatively higher turnover rates associated with DFA's bond funds are due to the majority of them being shorter-term in nature with variable-terms and associated credit strategies employed.)
Factor Gap
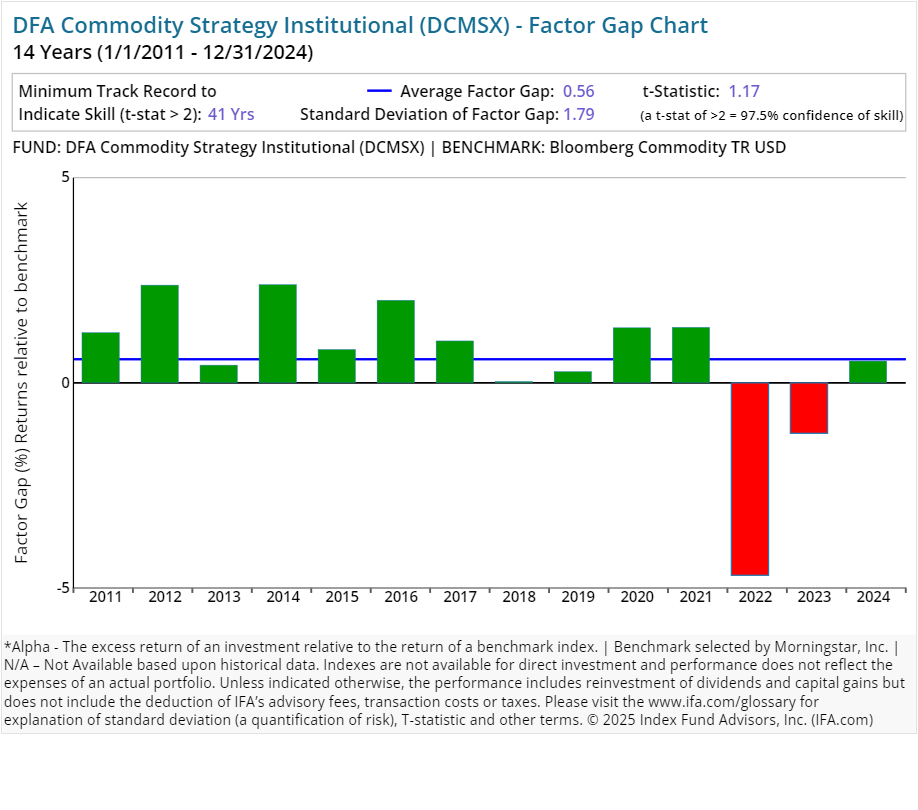
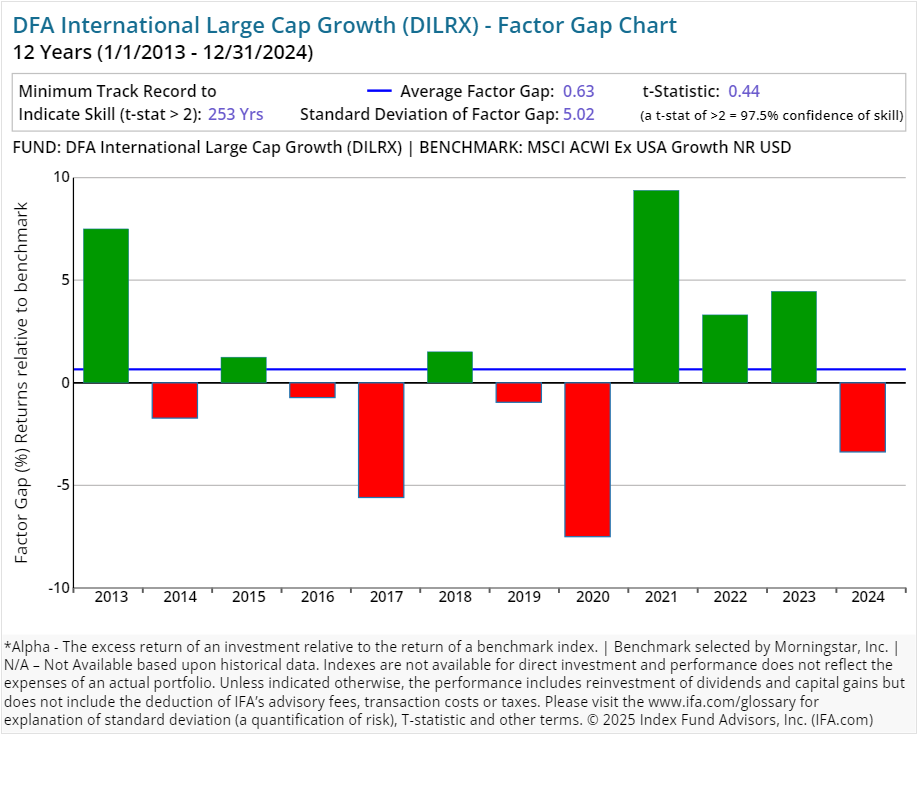
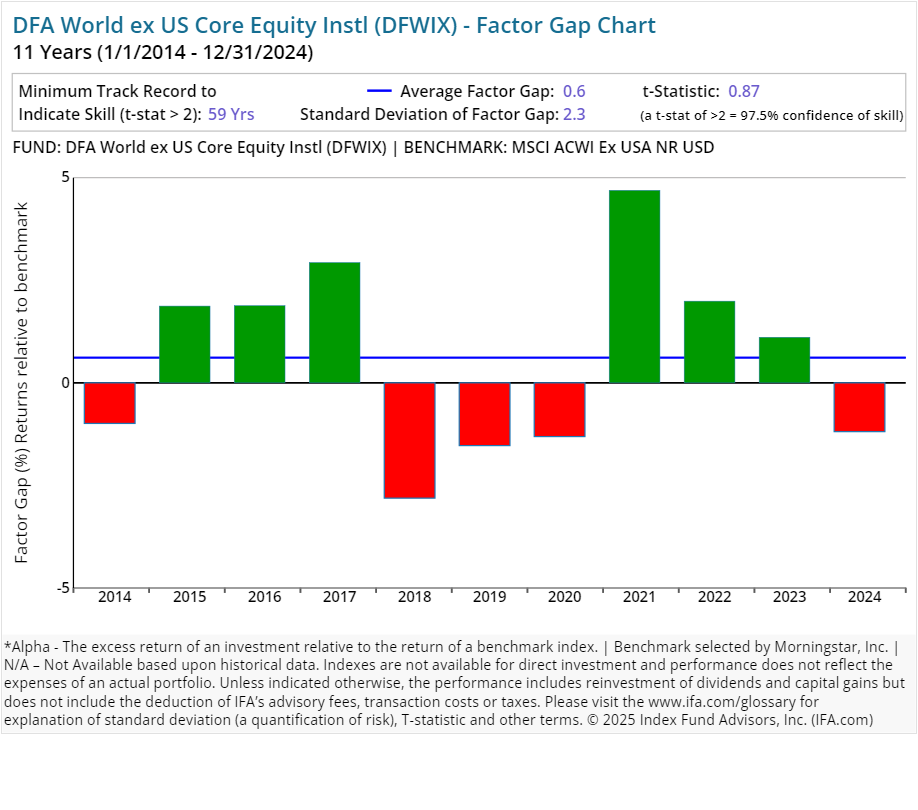
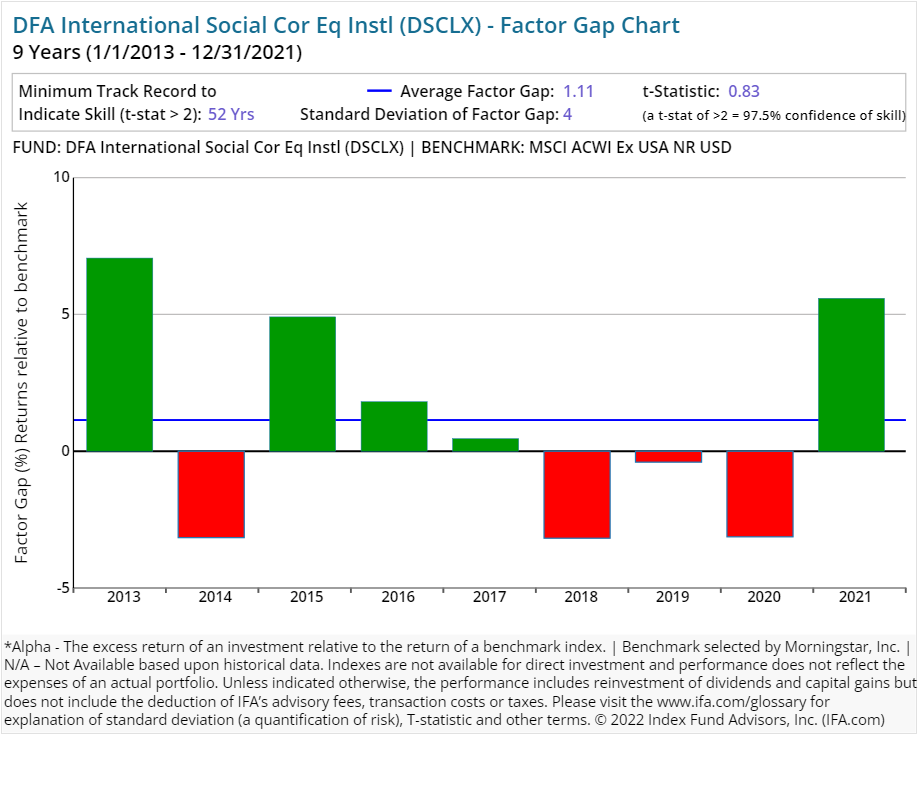
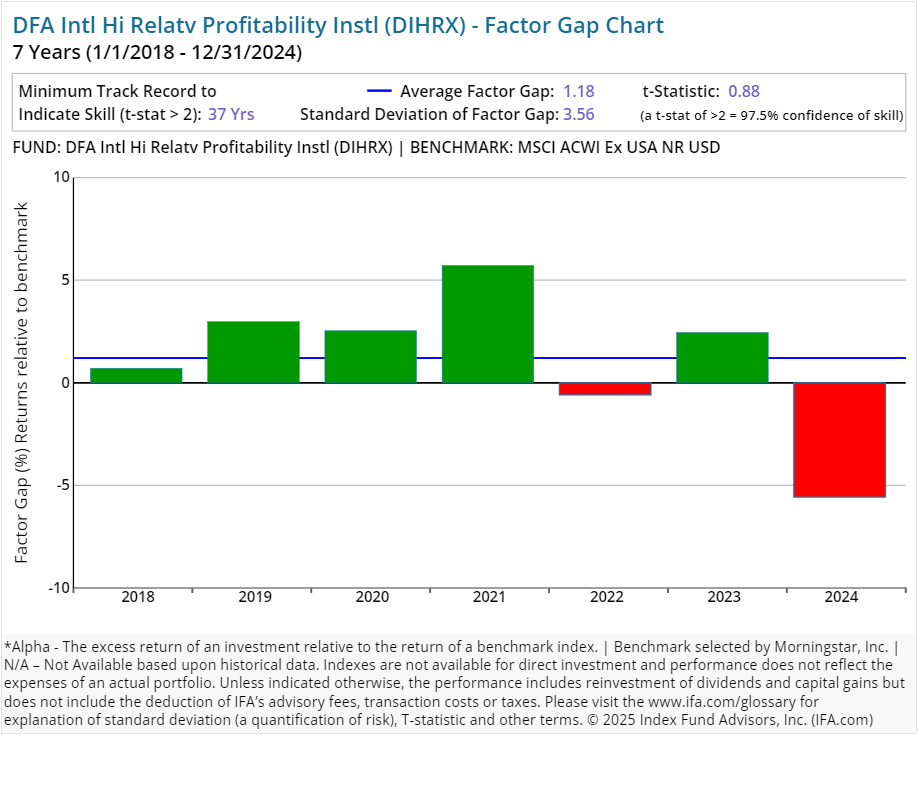
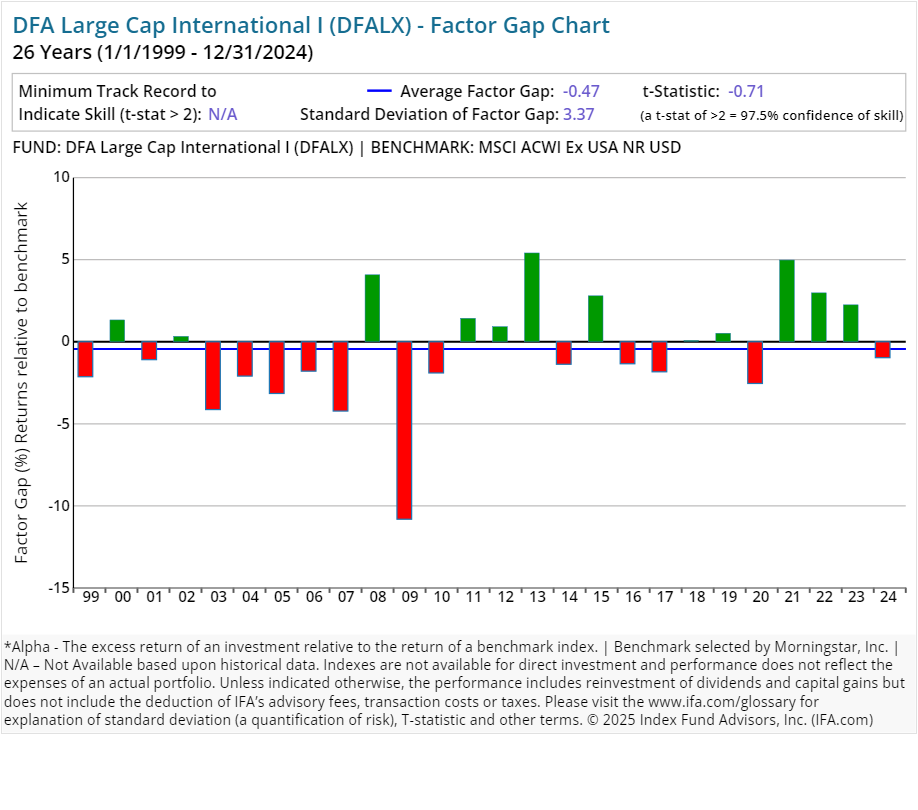
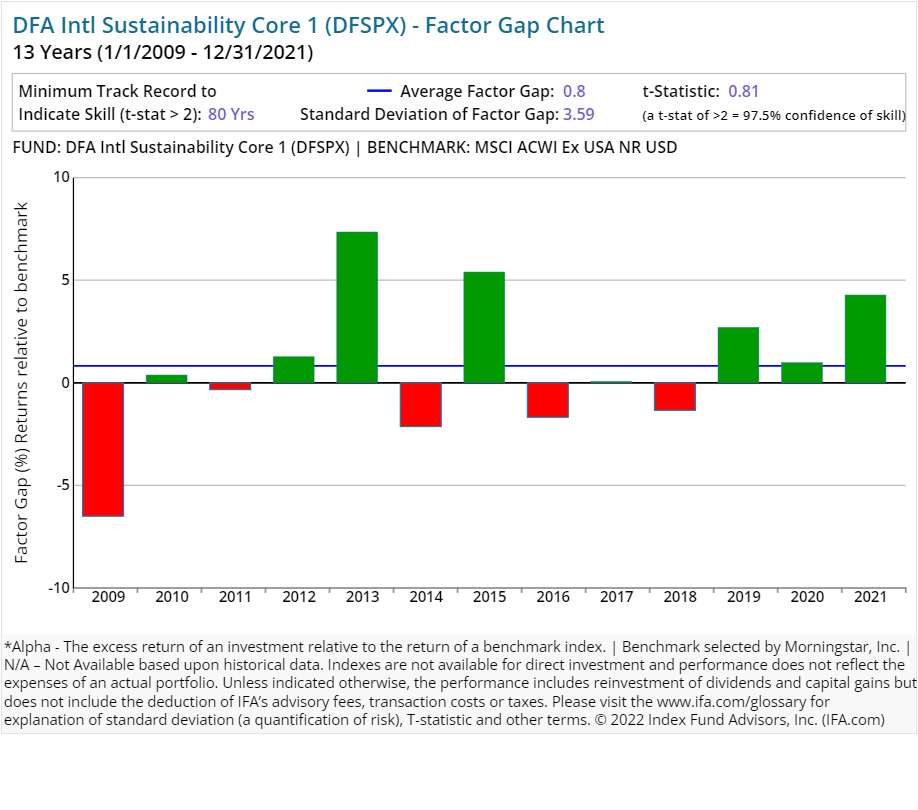
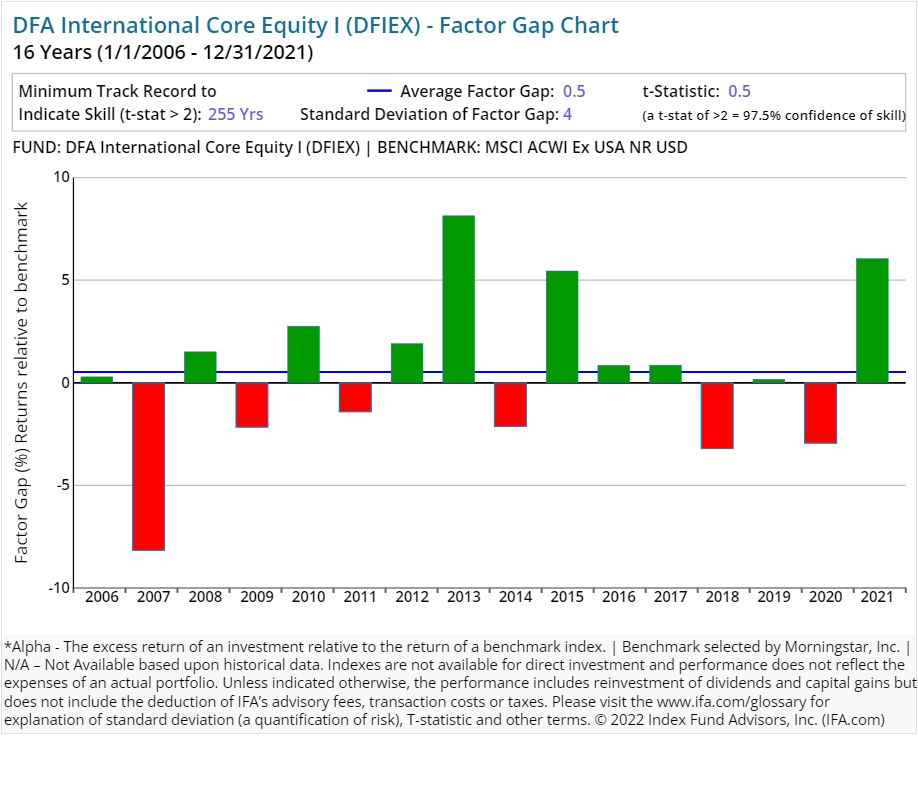
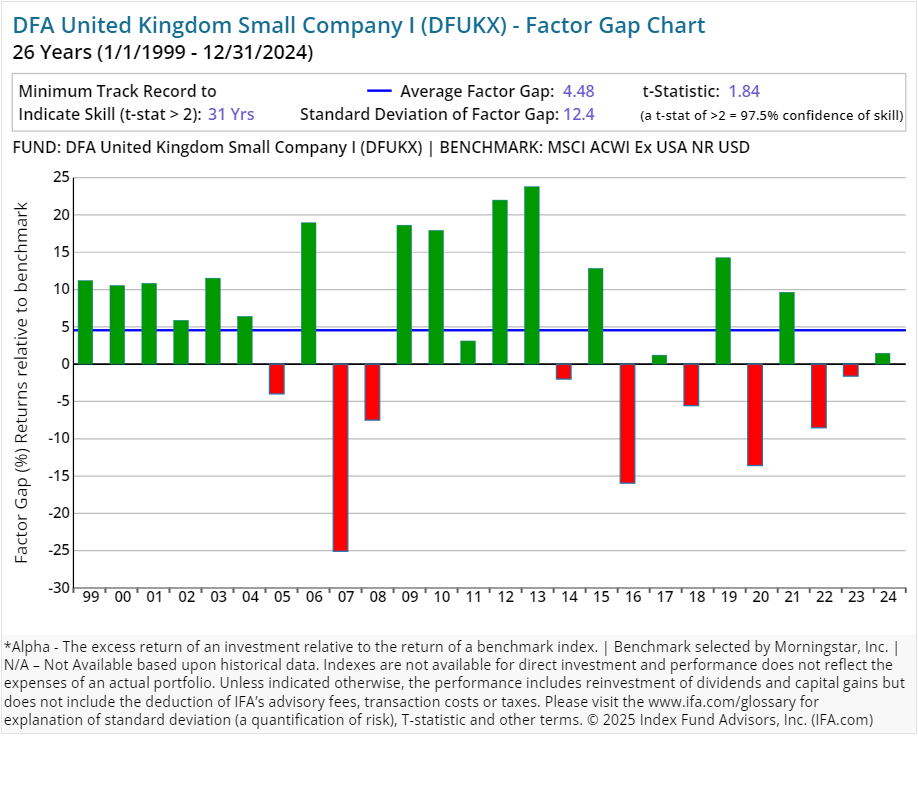
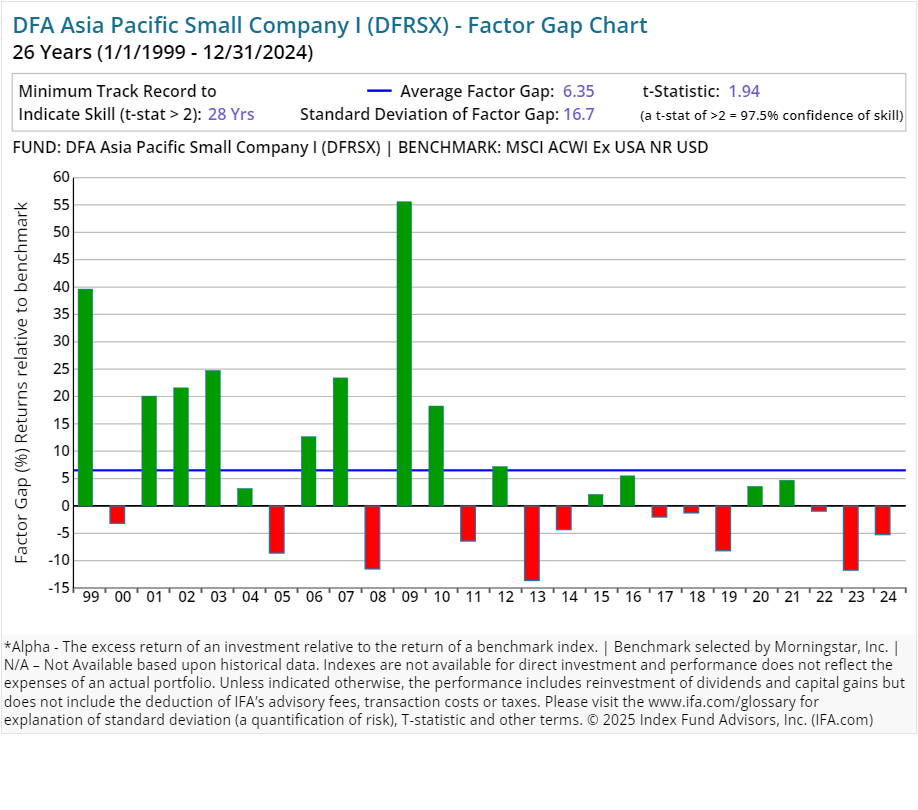
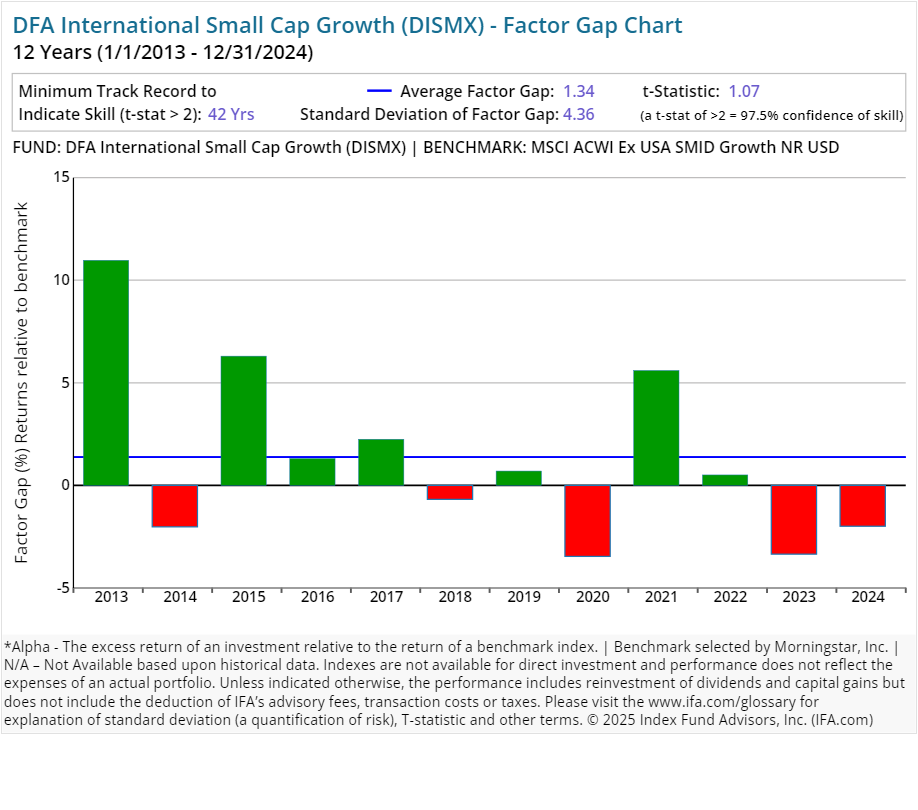
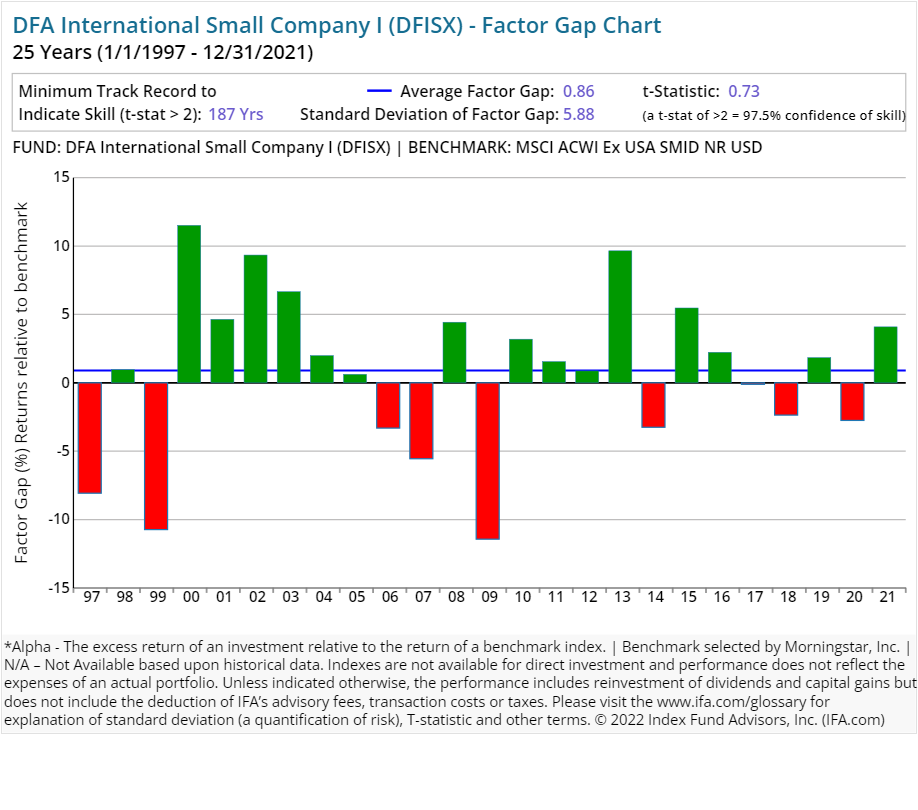
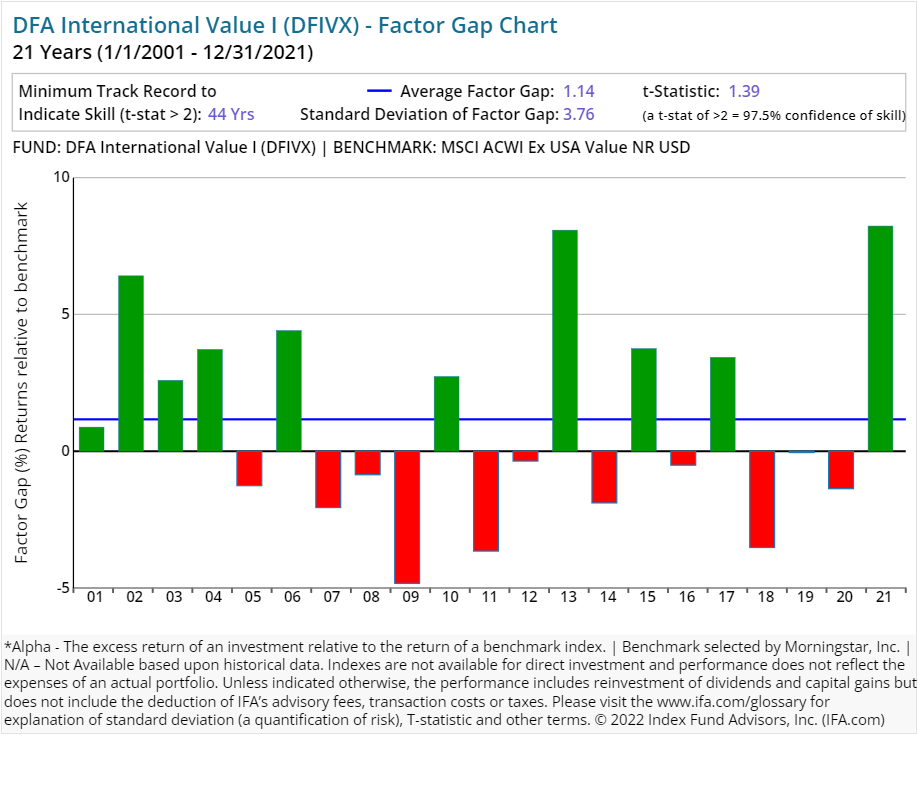
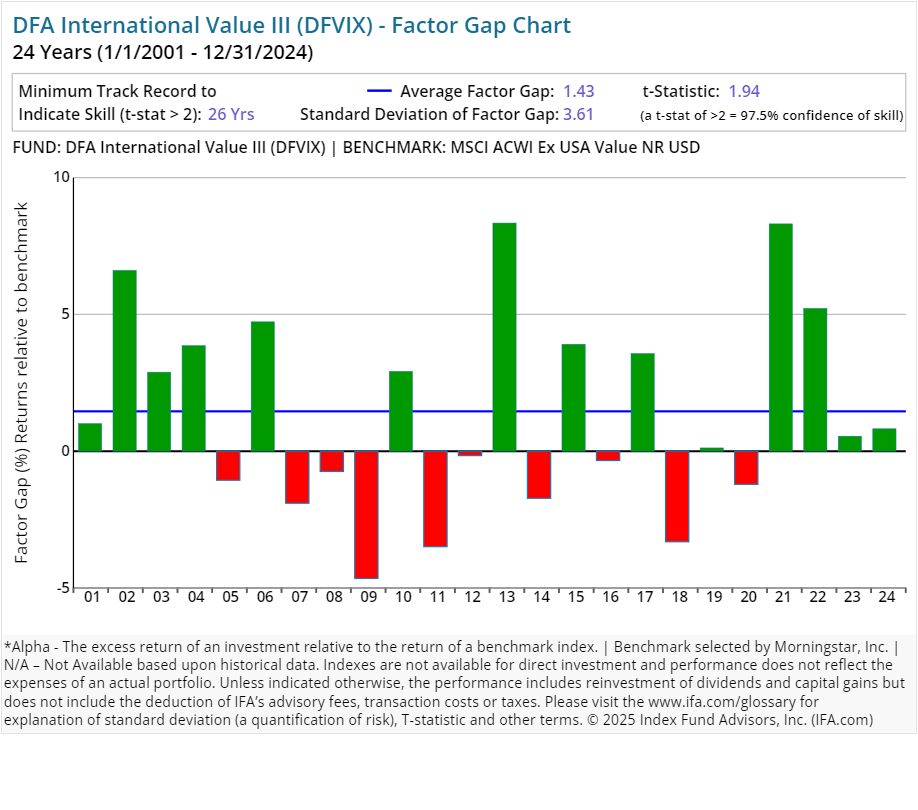
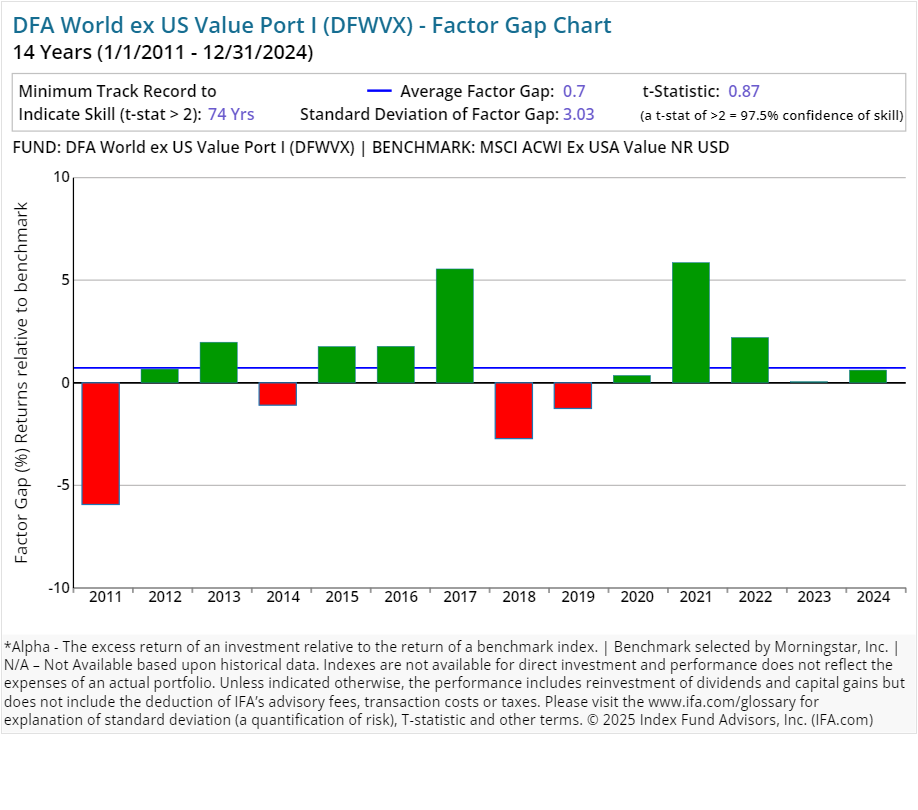
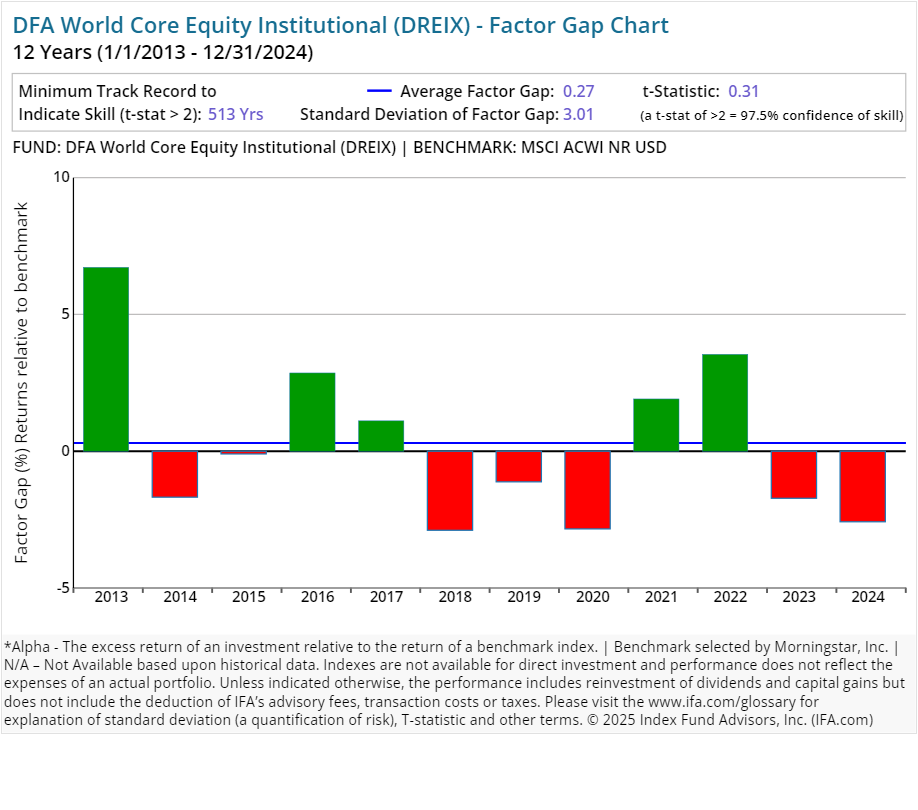
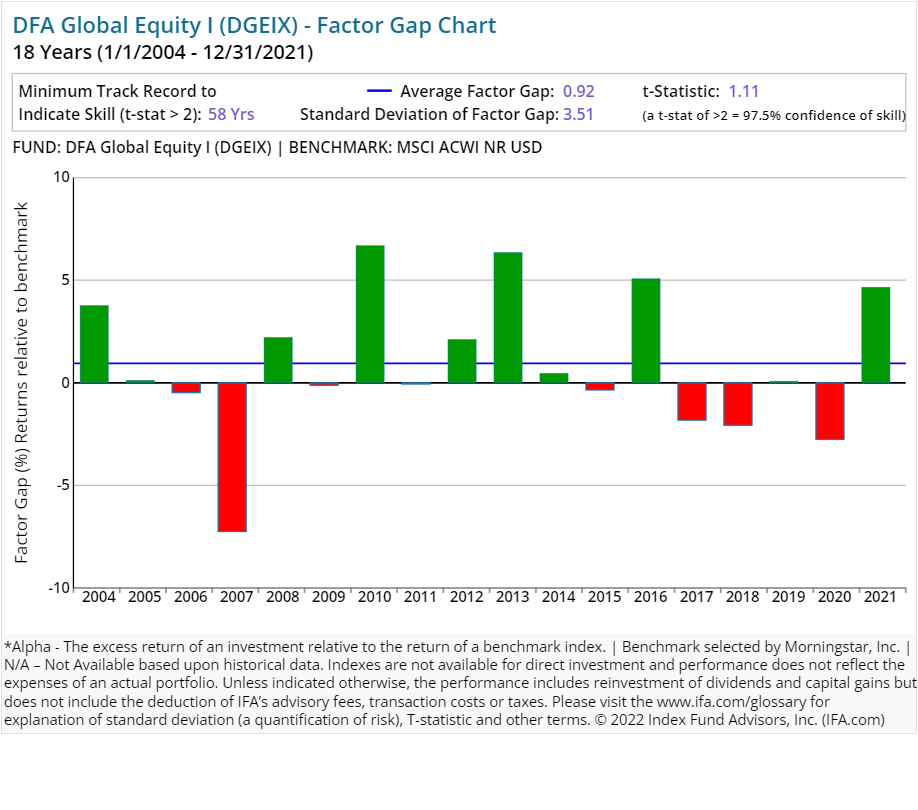
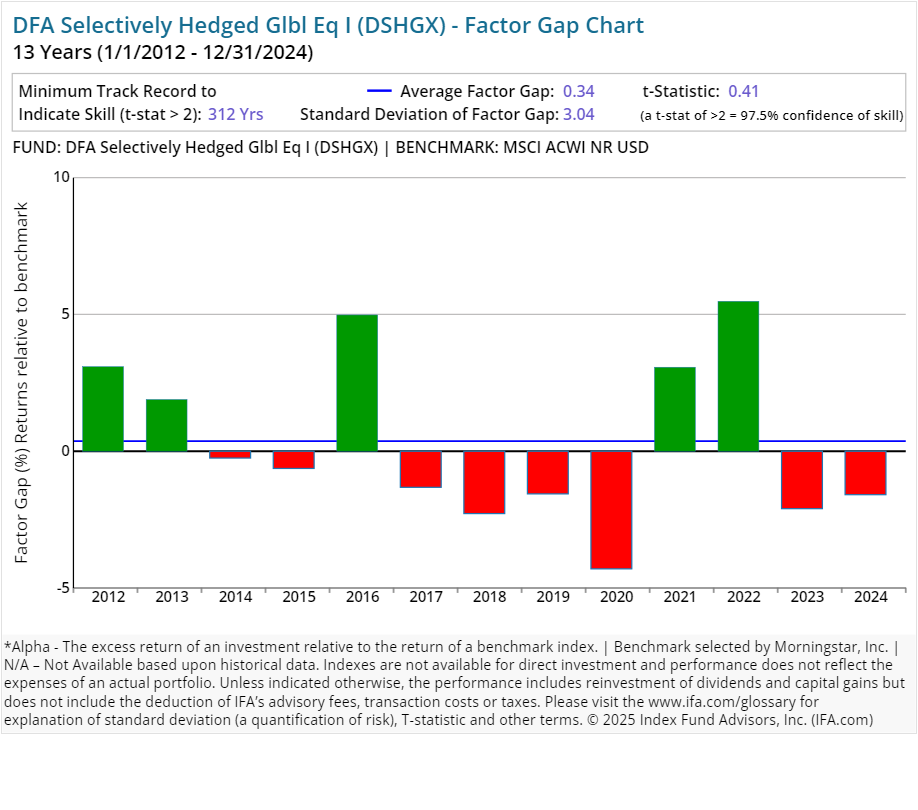
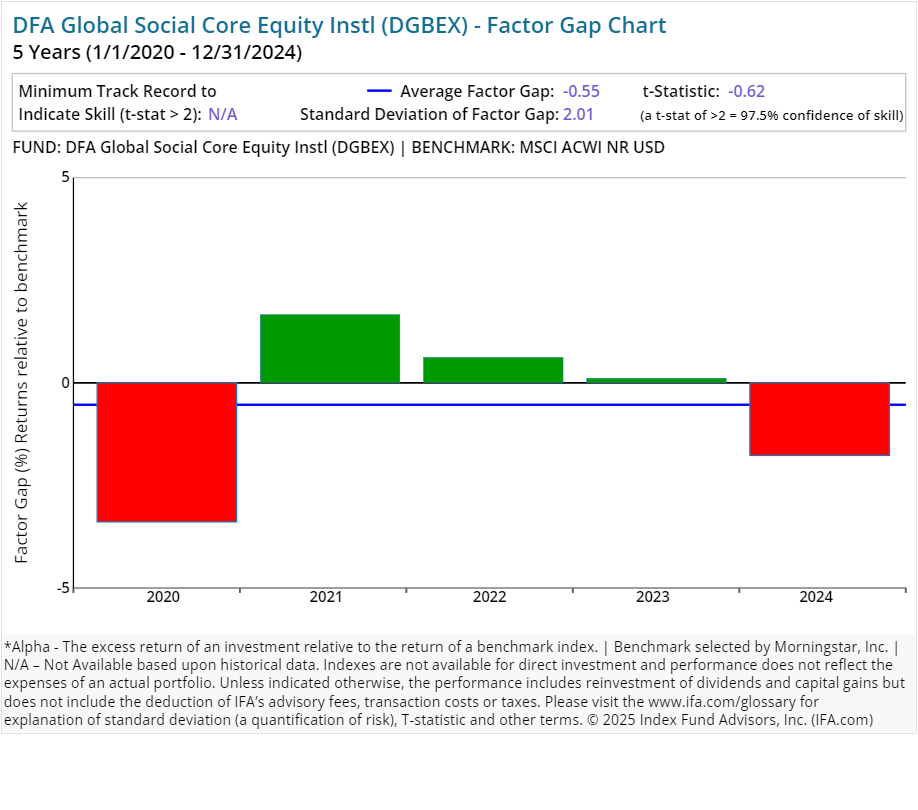
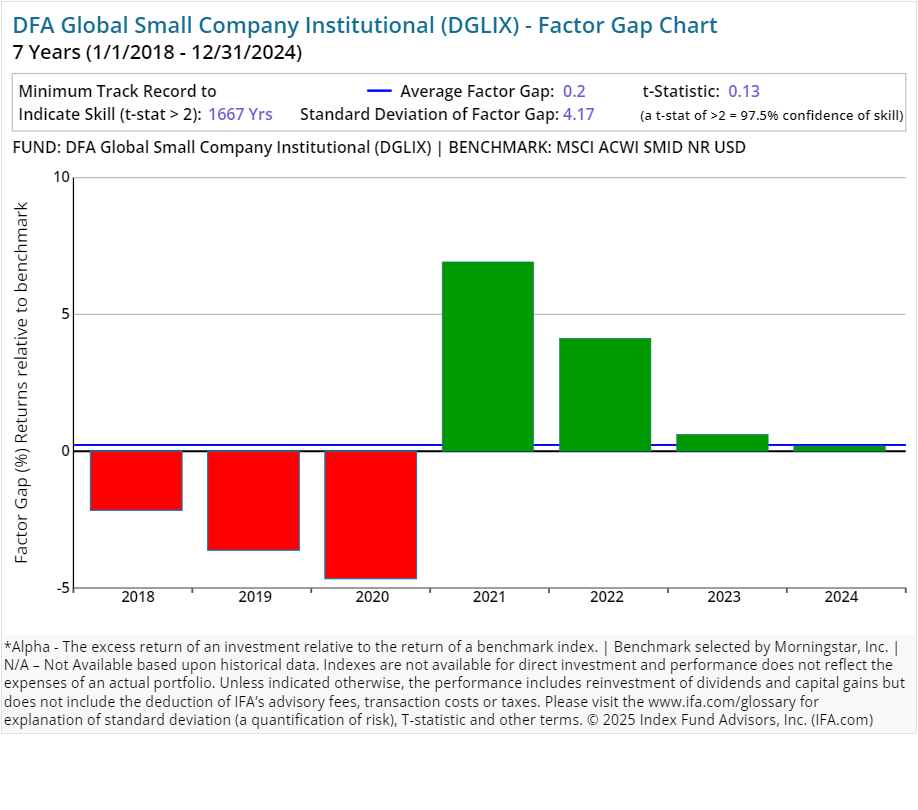
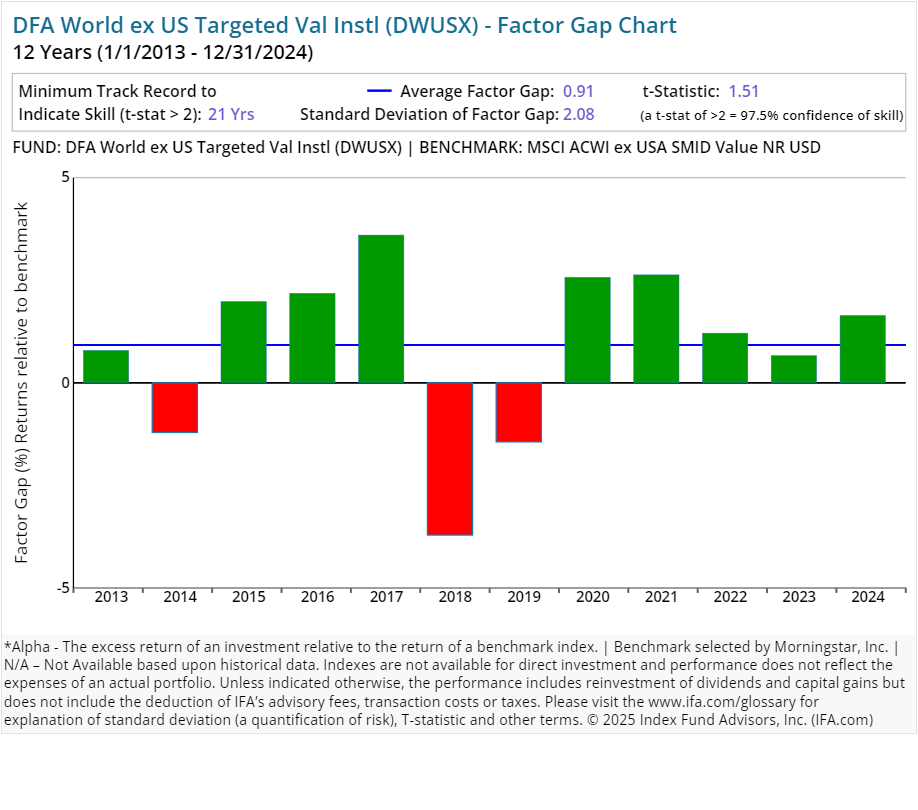
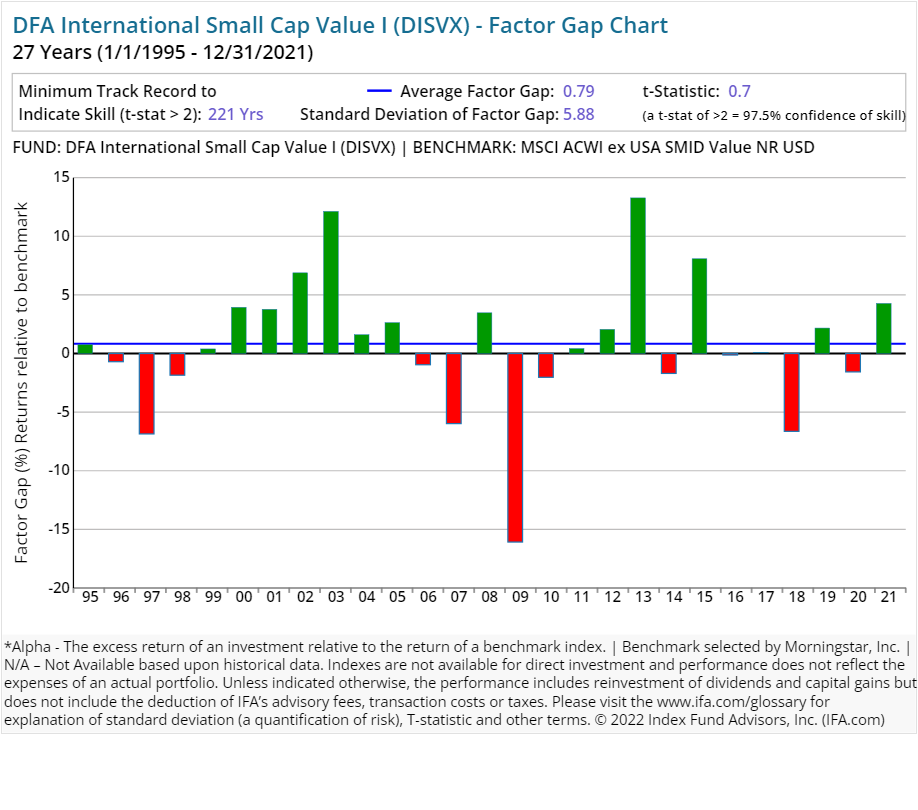
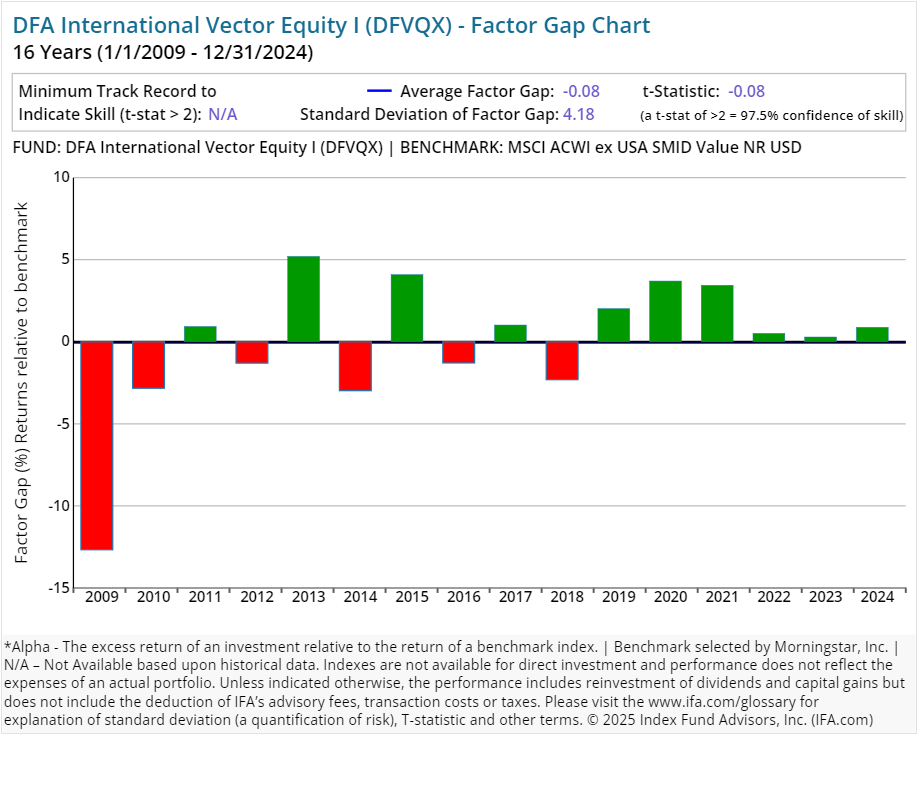
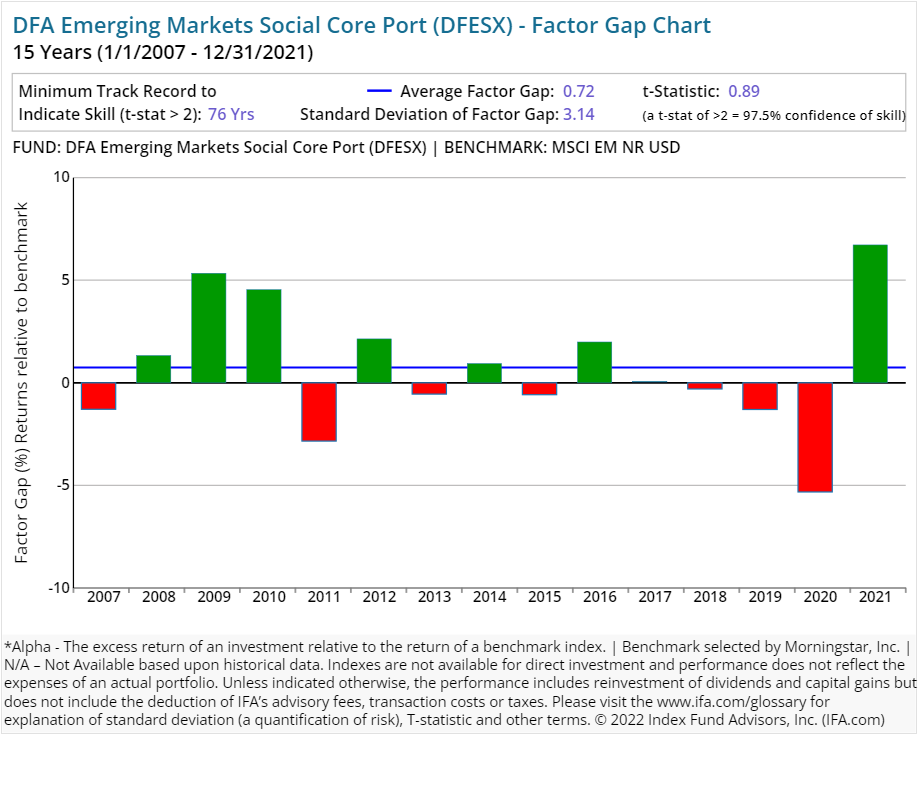
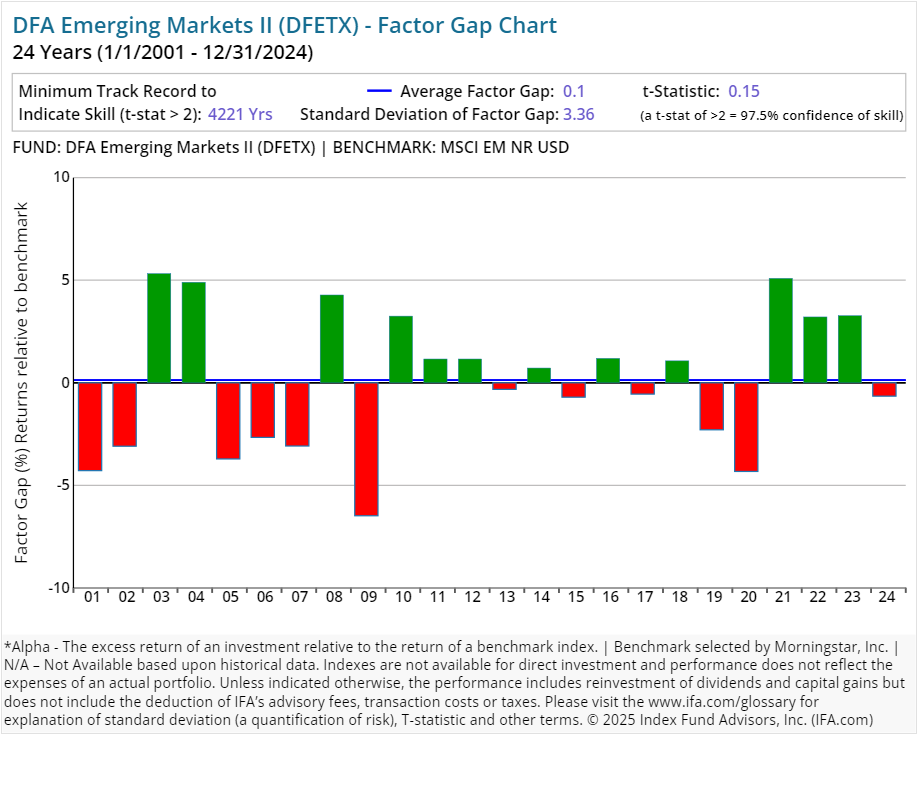
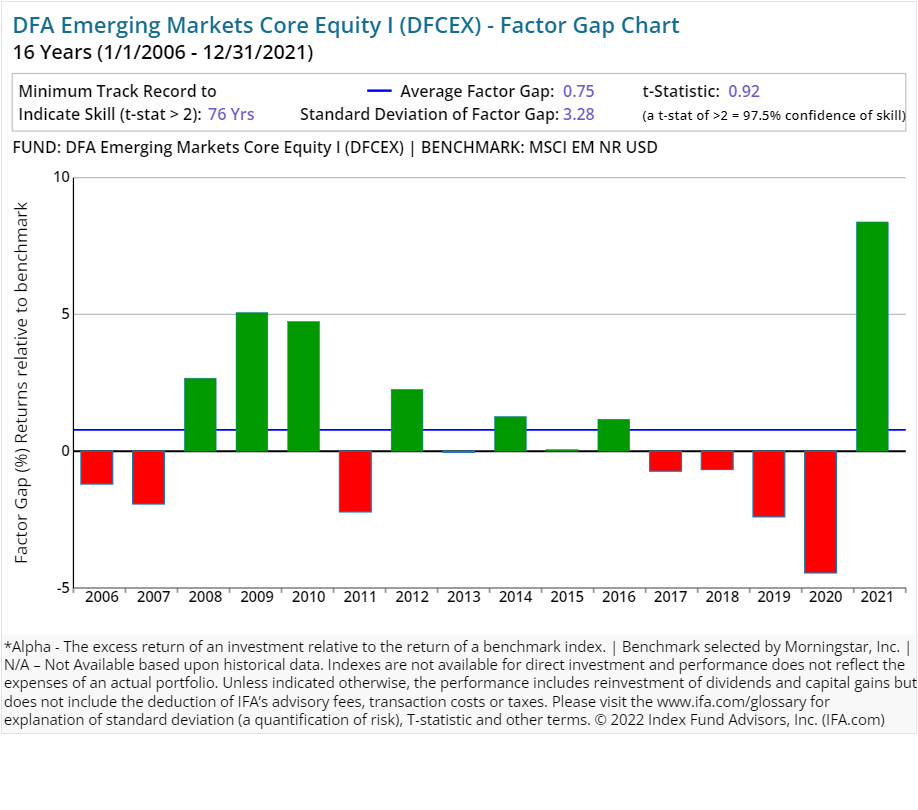
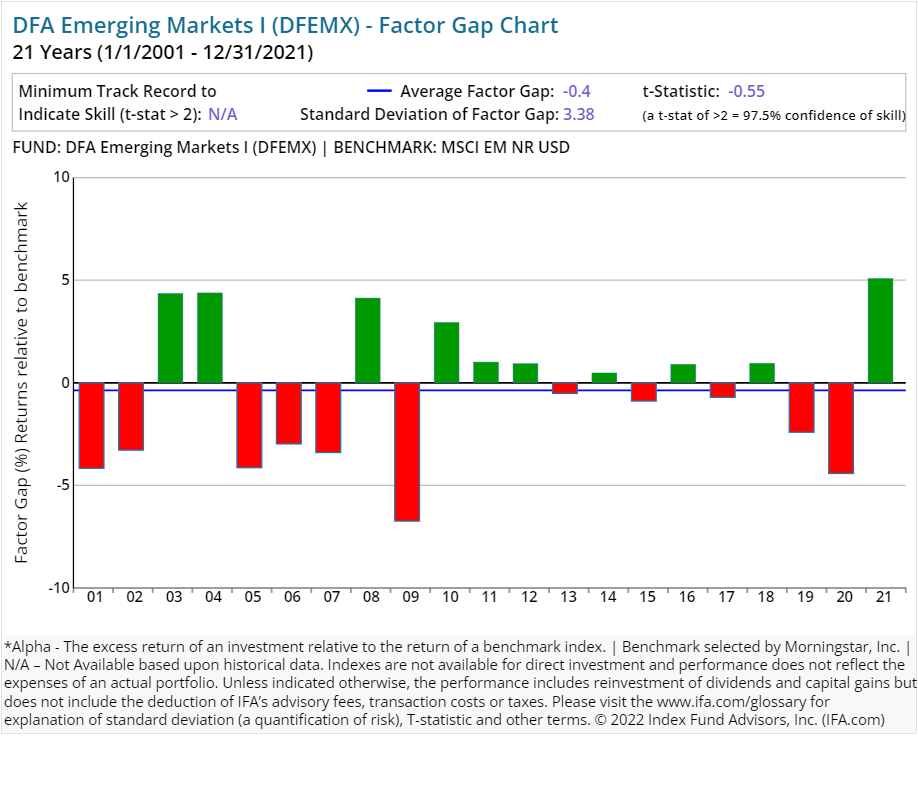
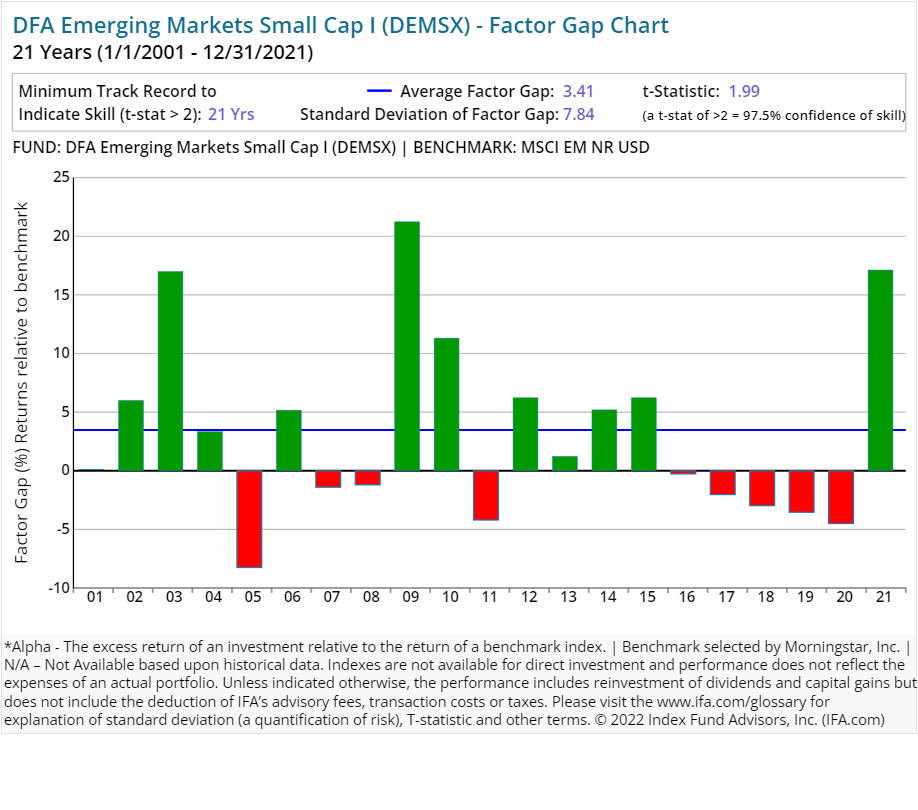
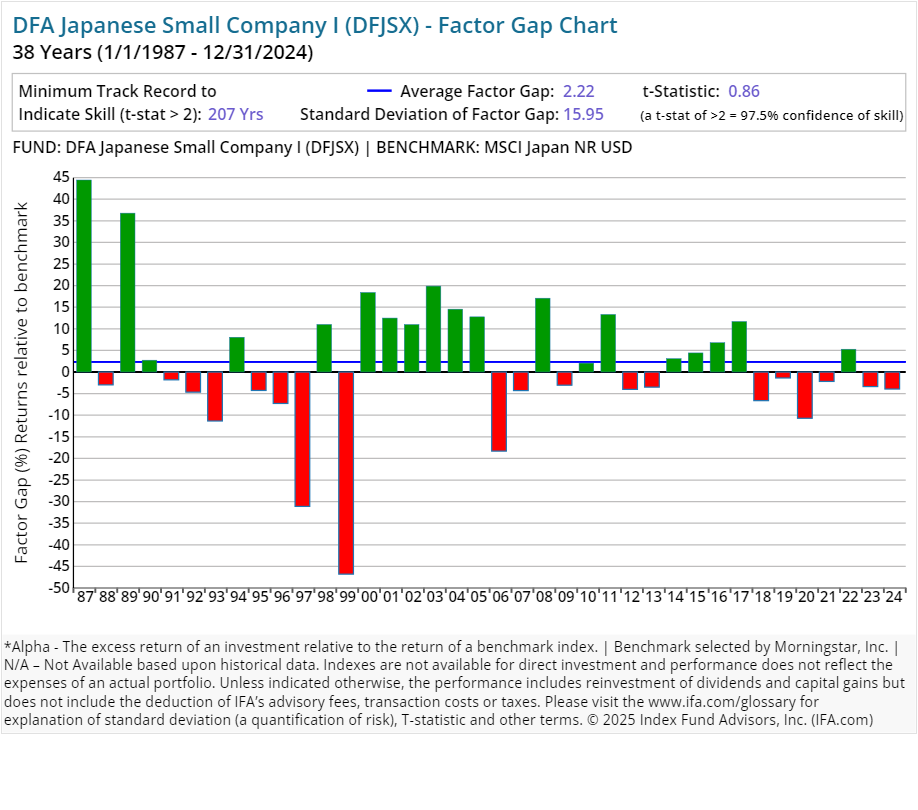
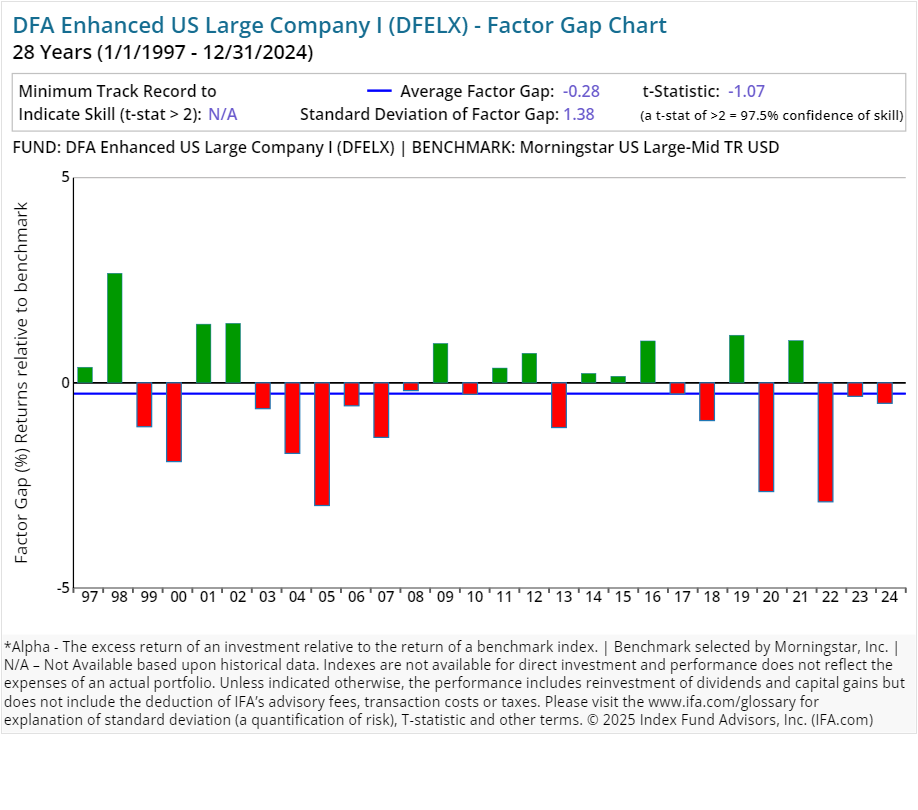
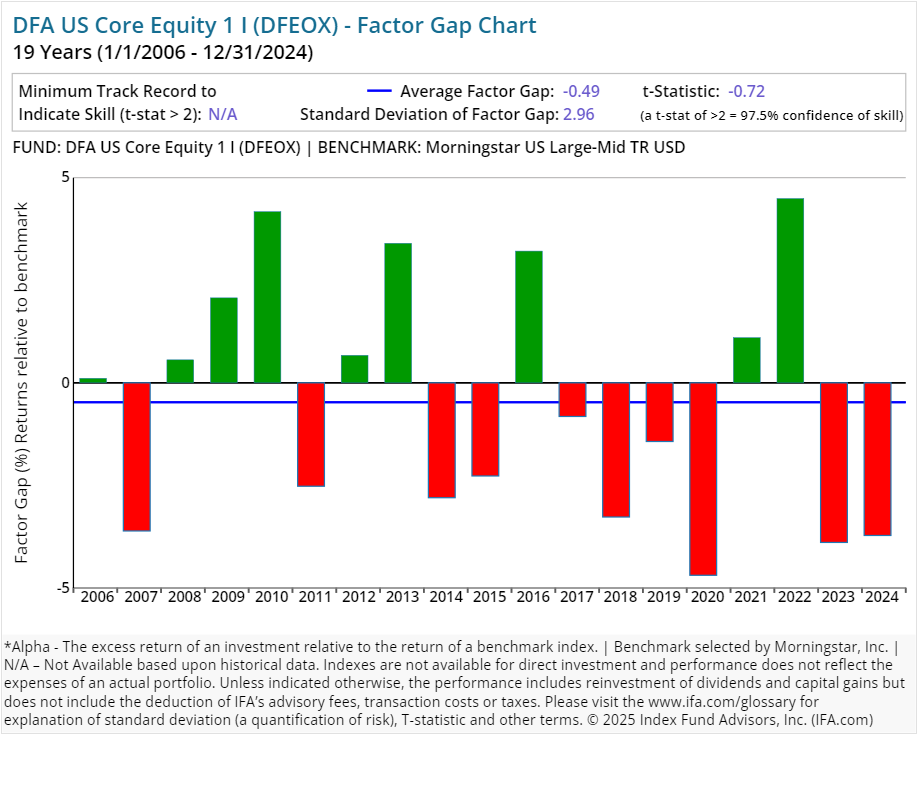
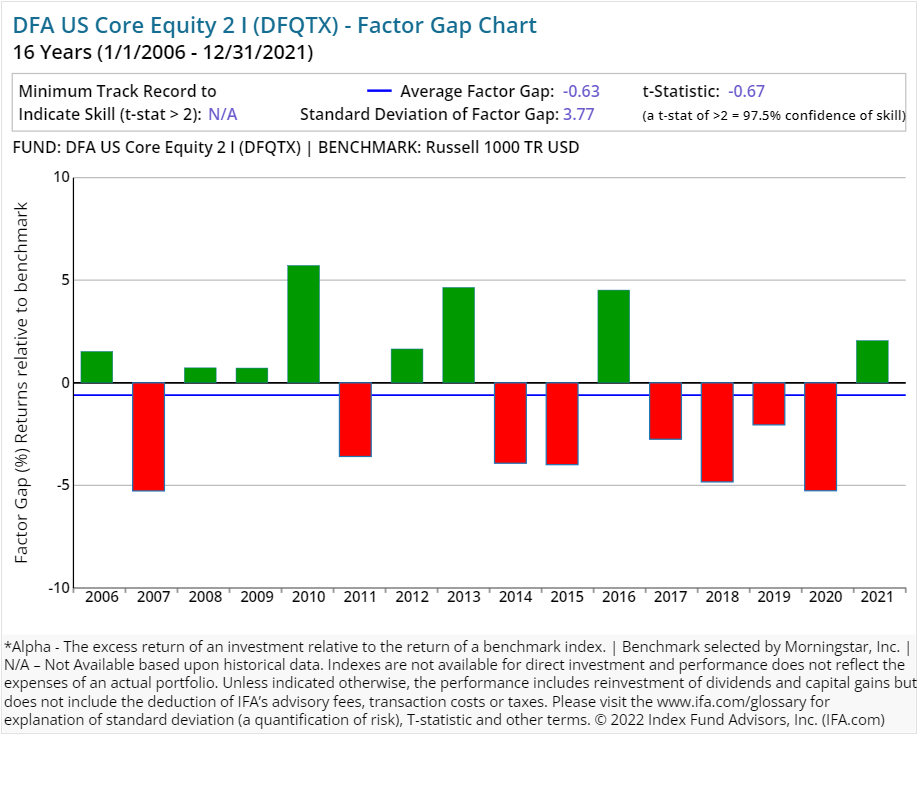
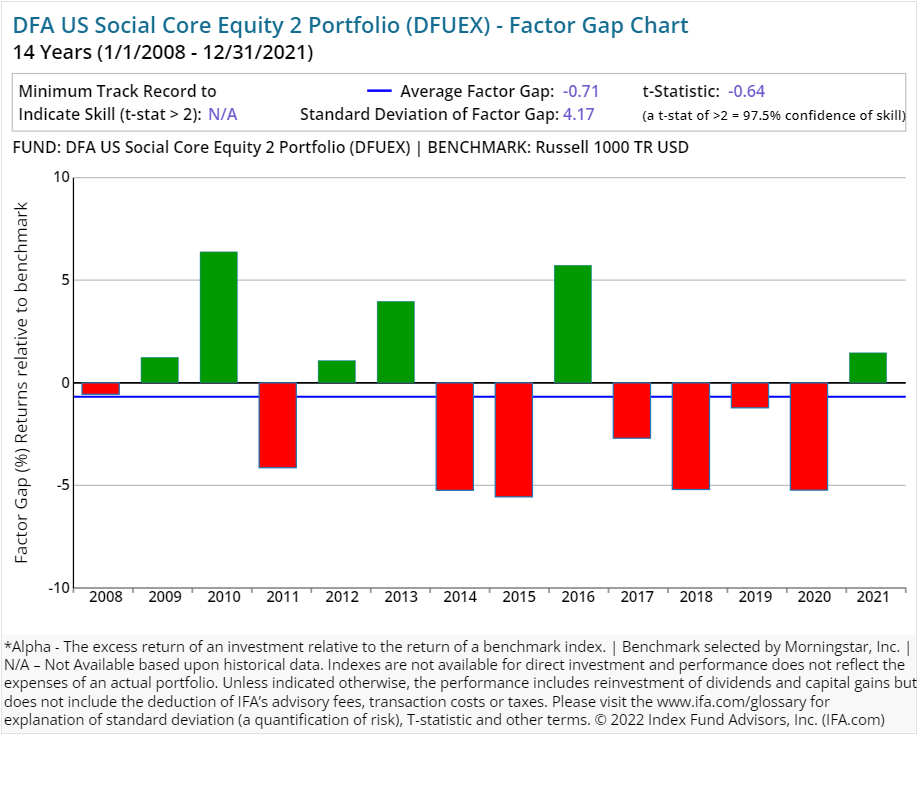
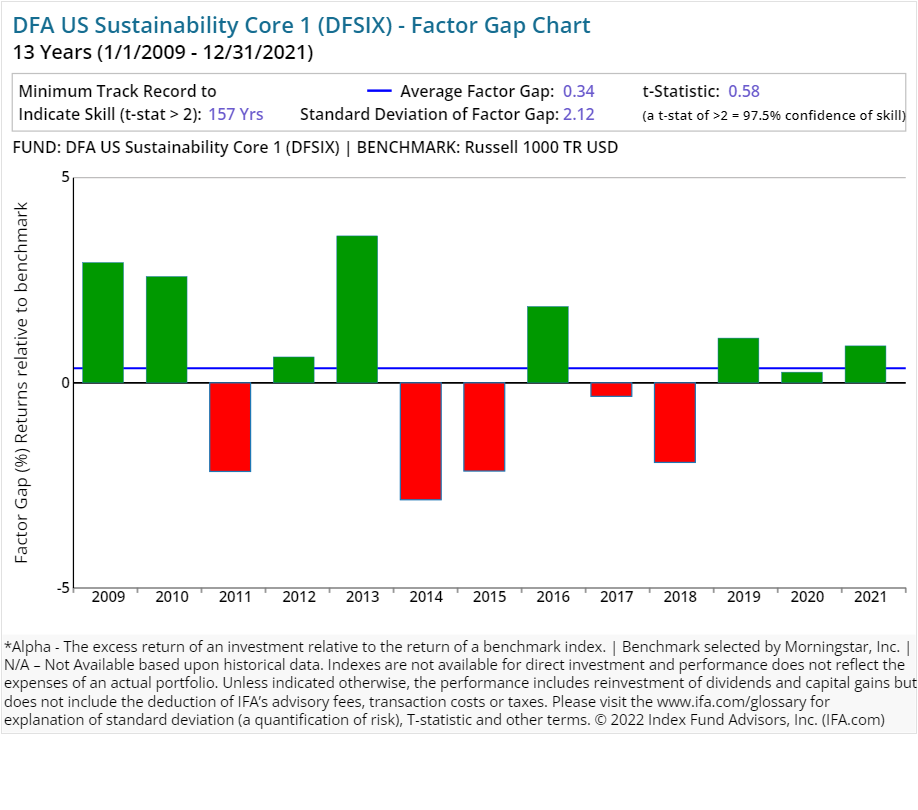
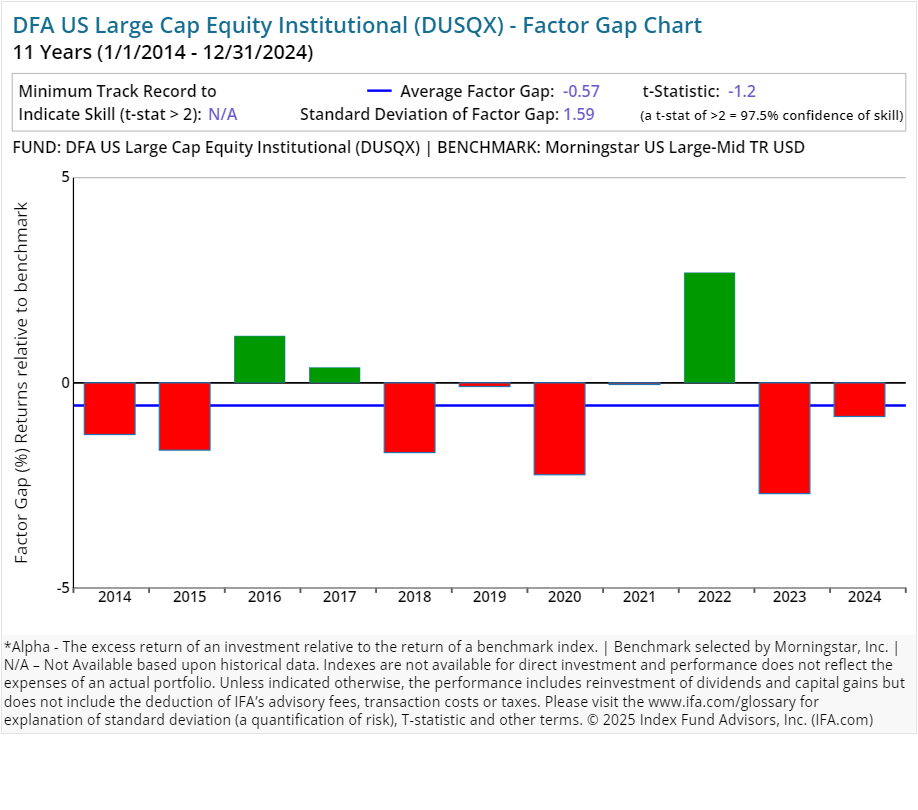
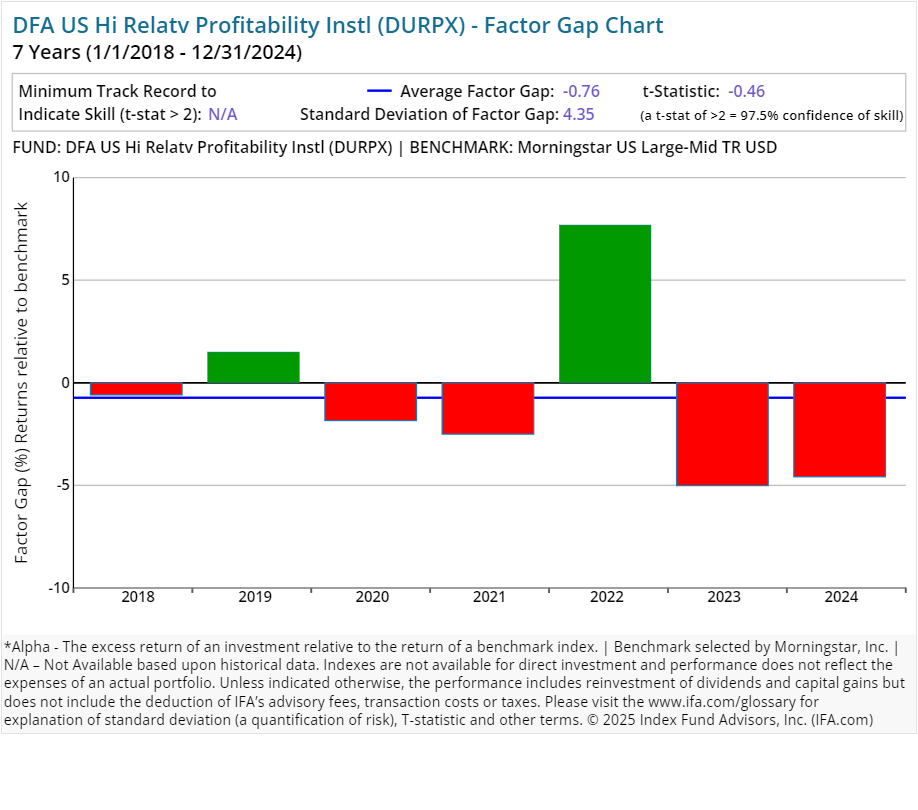
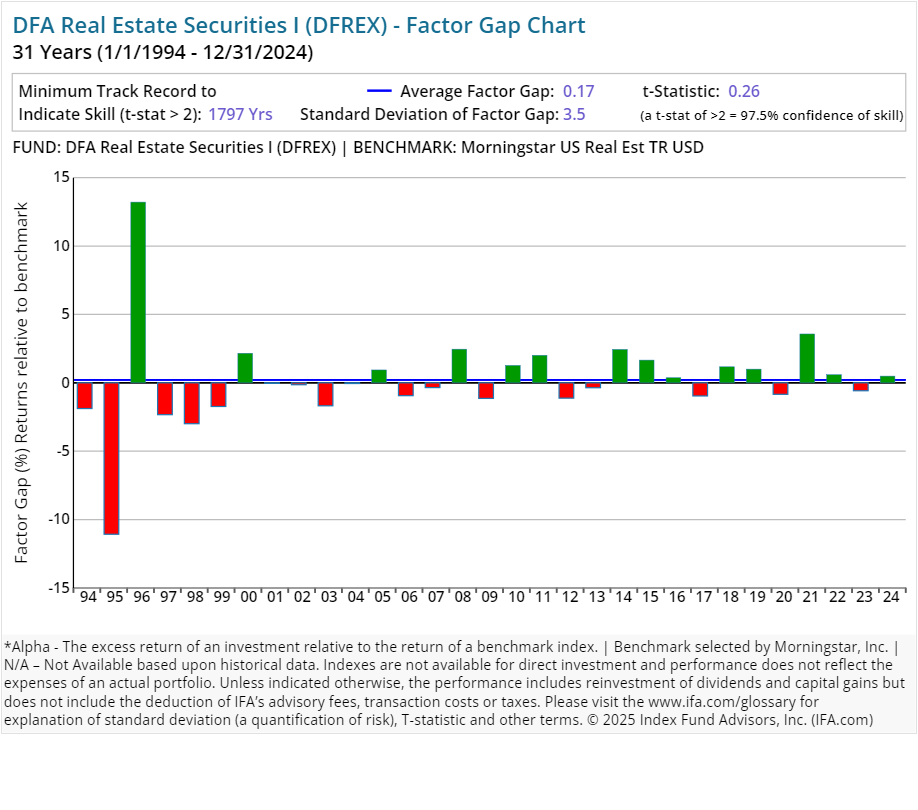
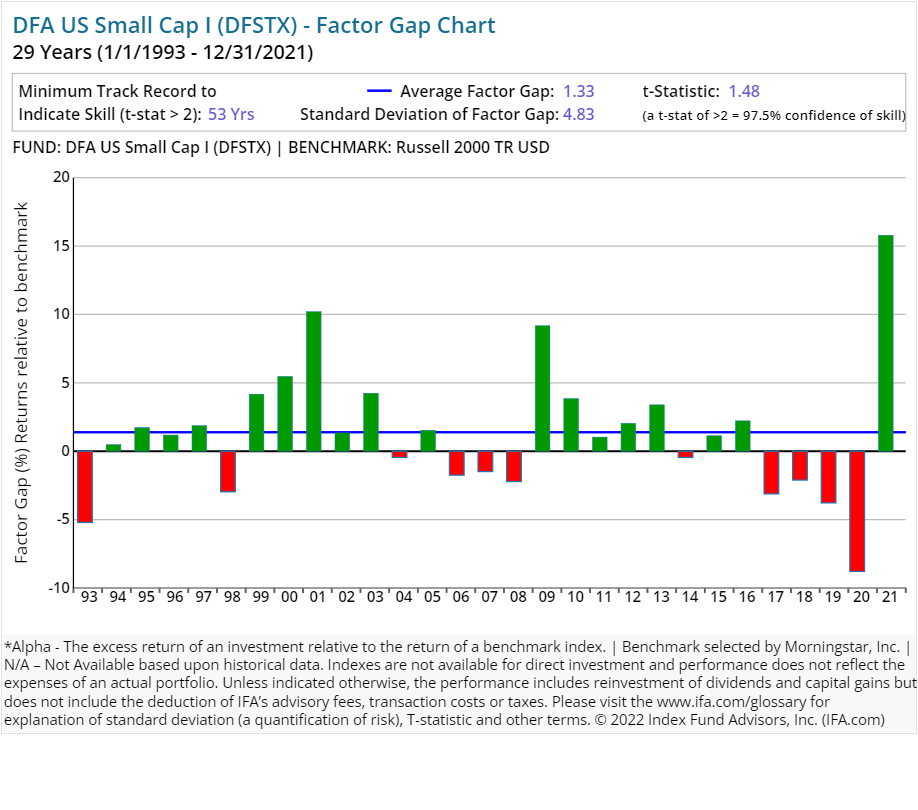
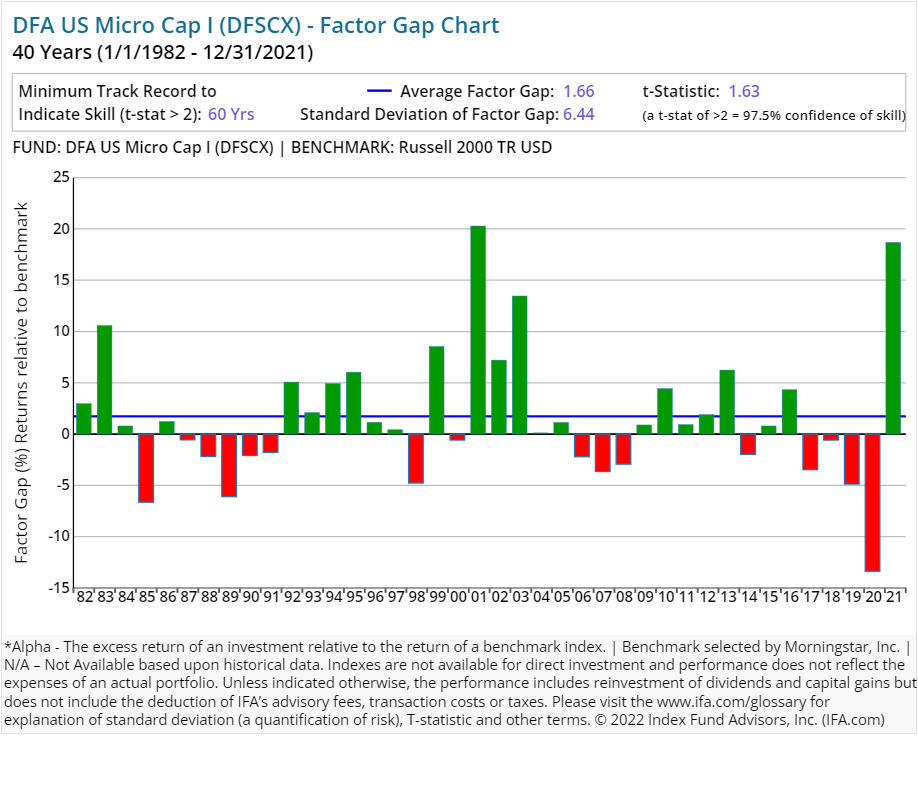
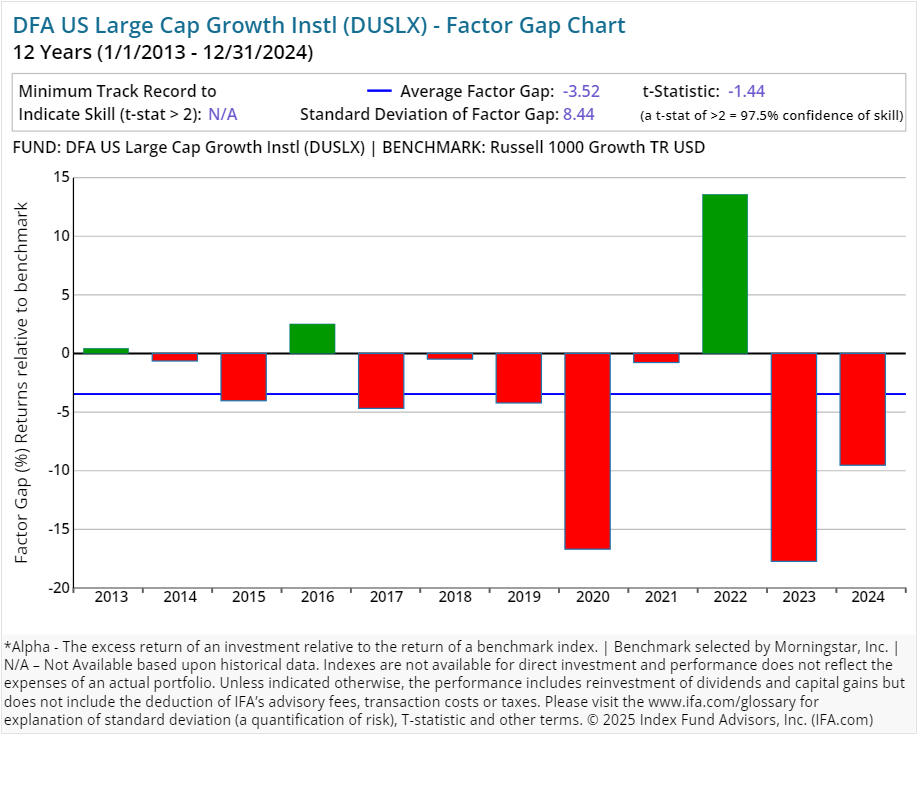
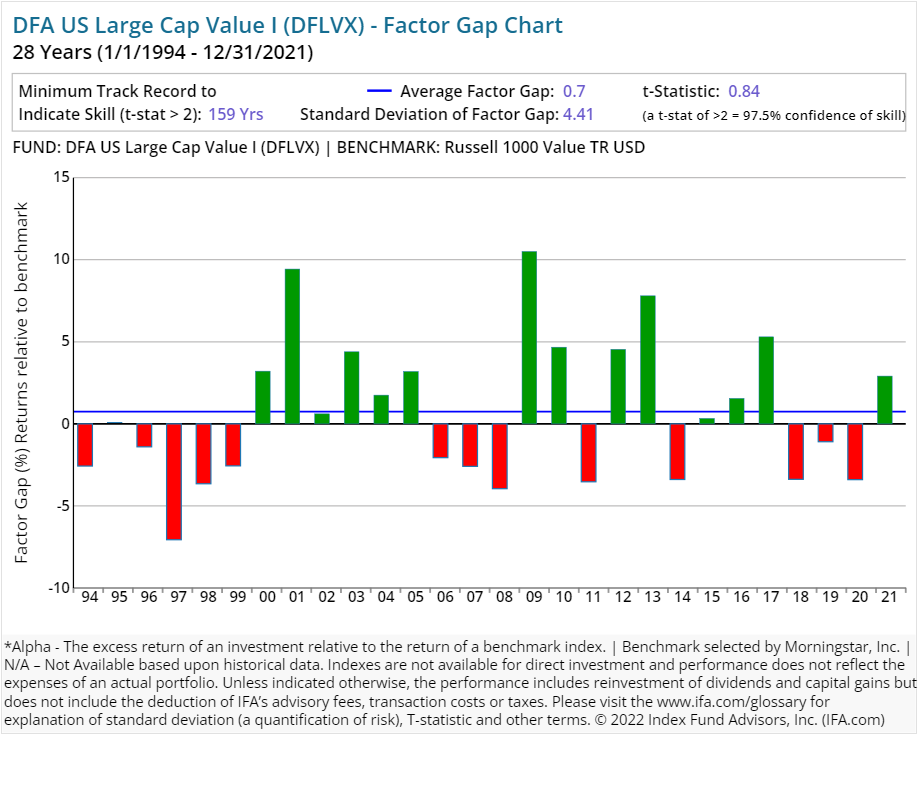
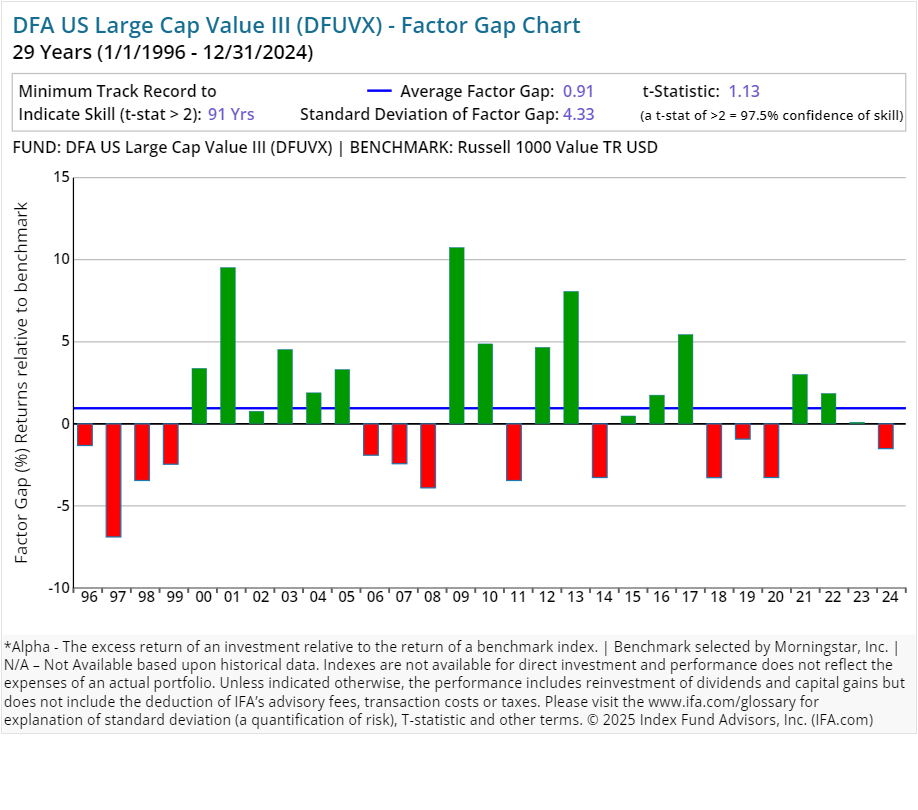
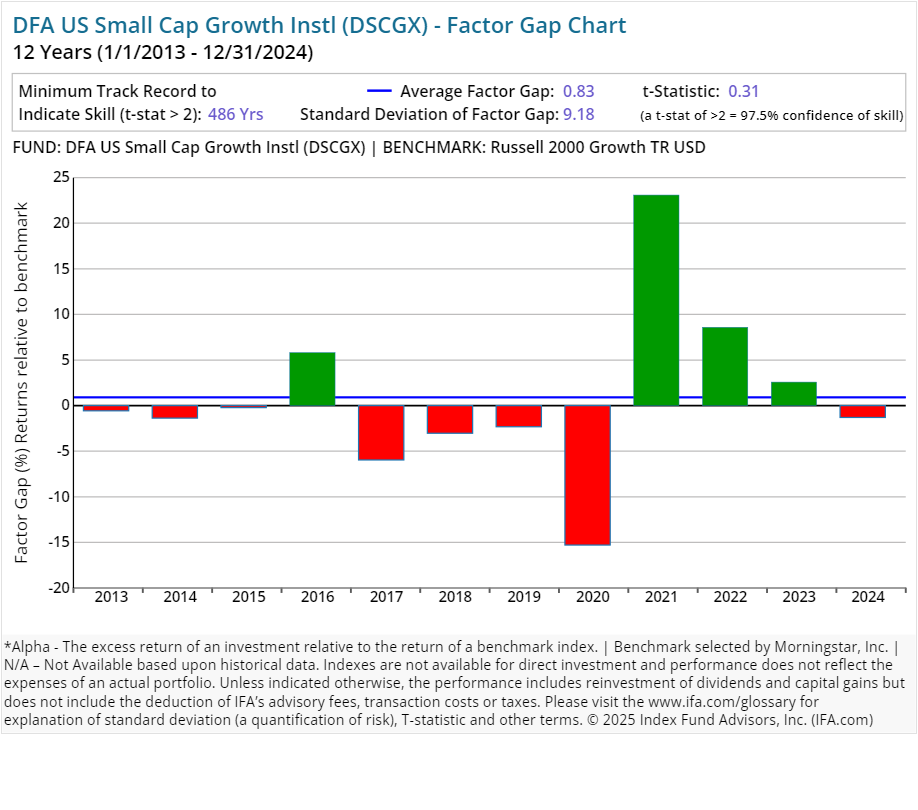
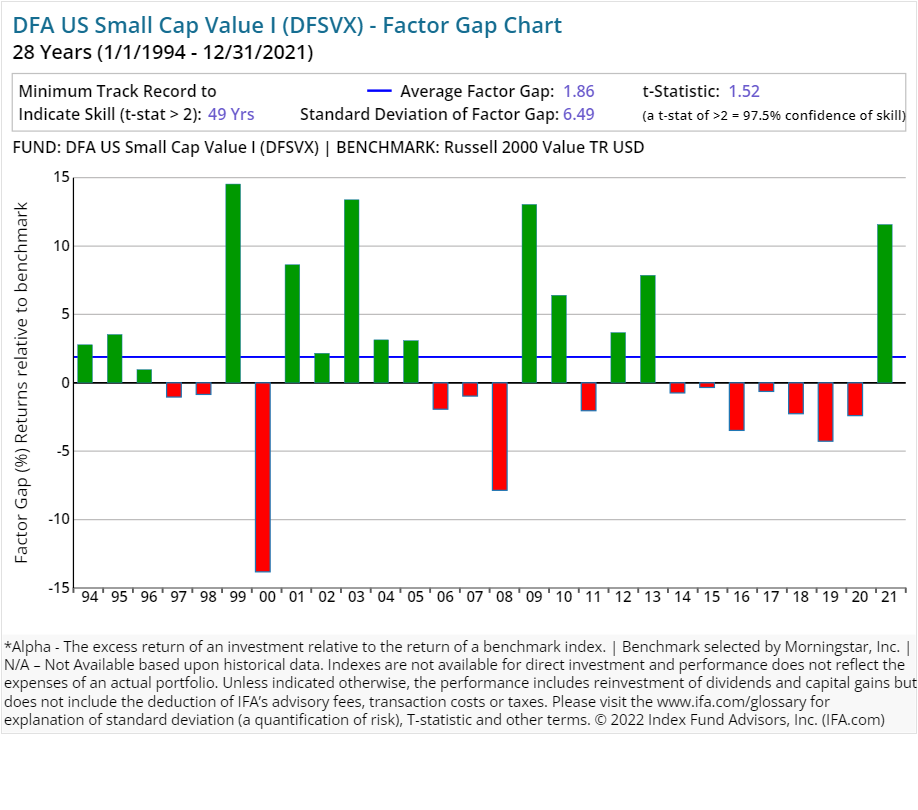
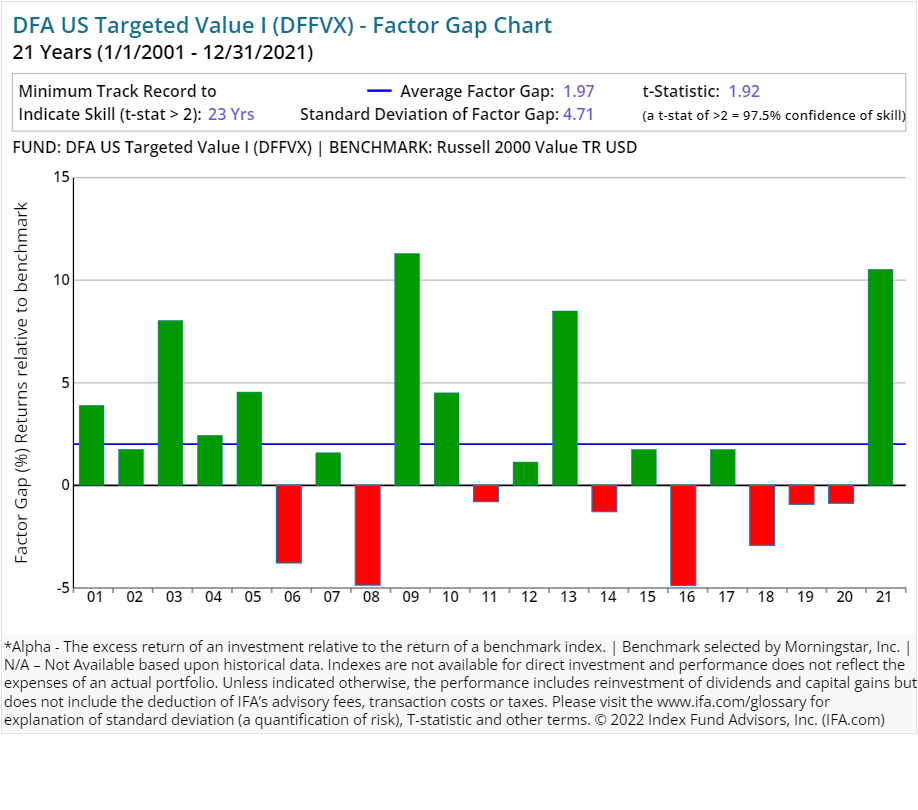
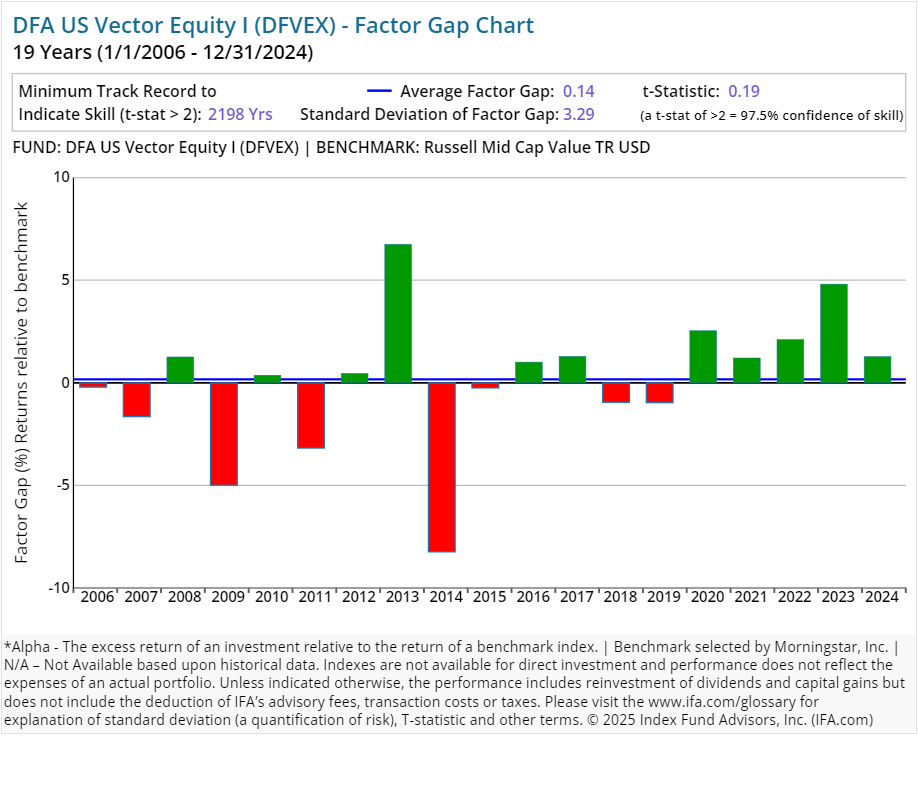
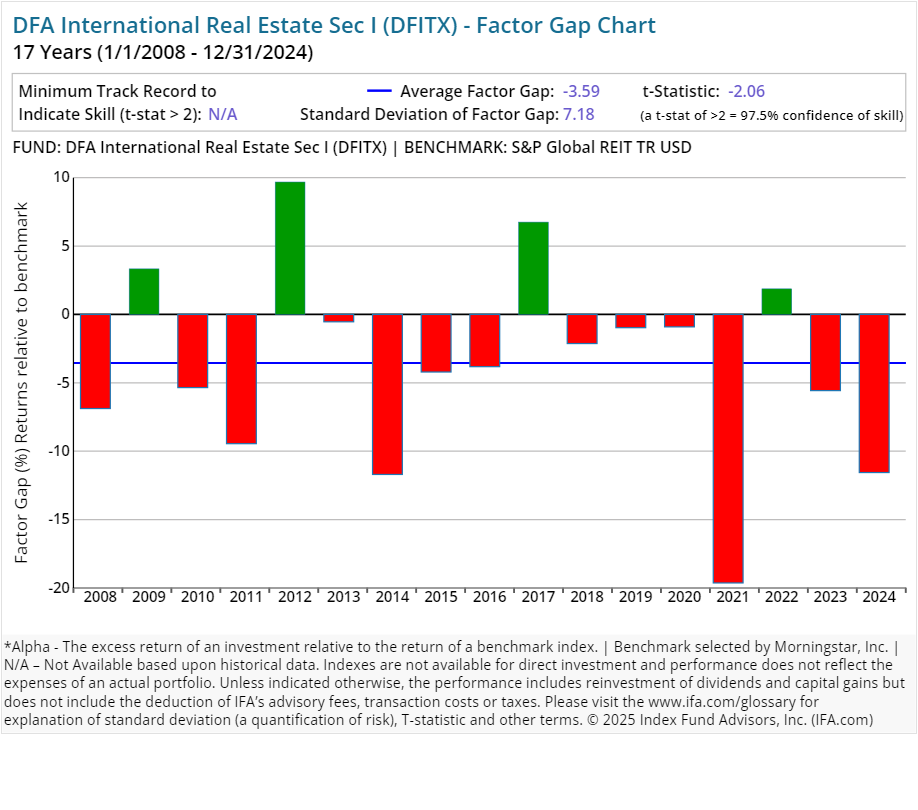
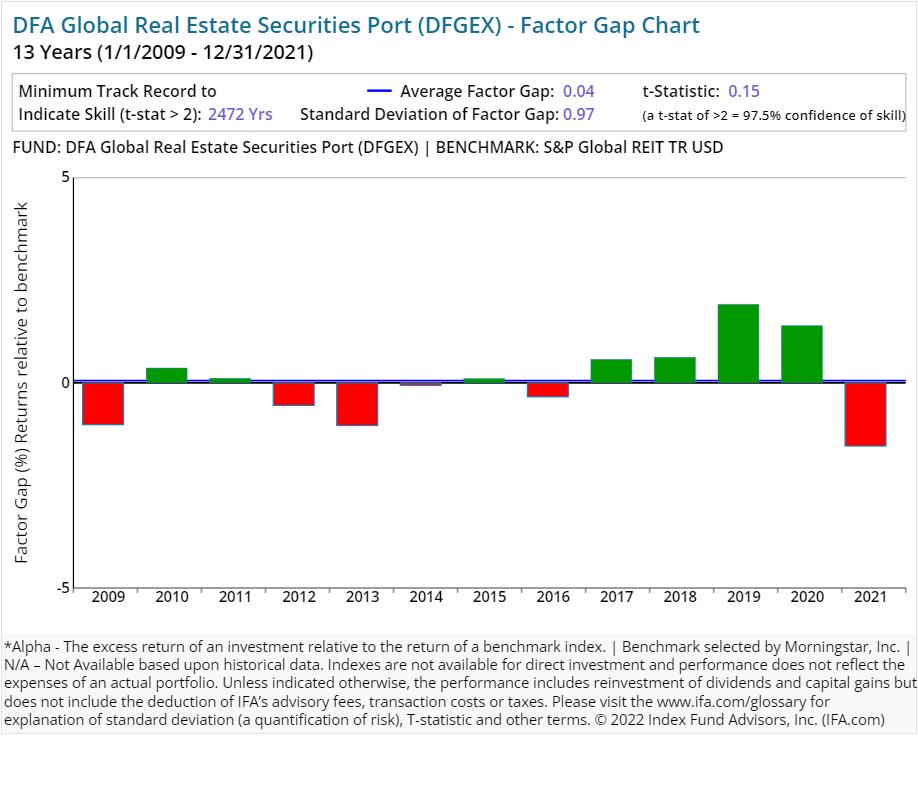
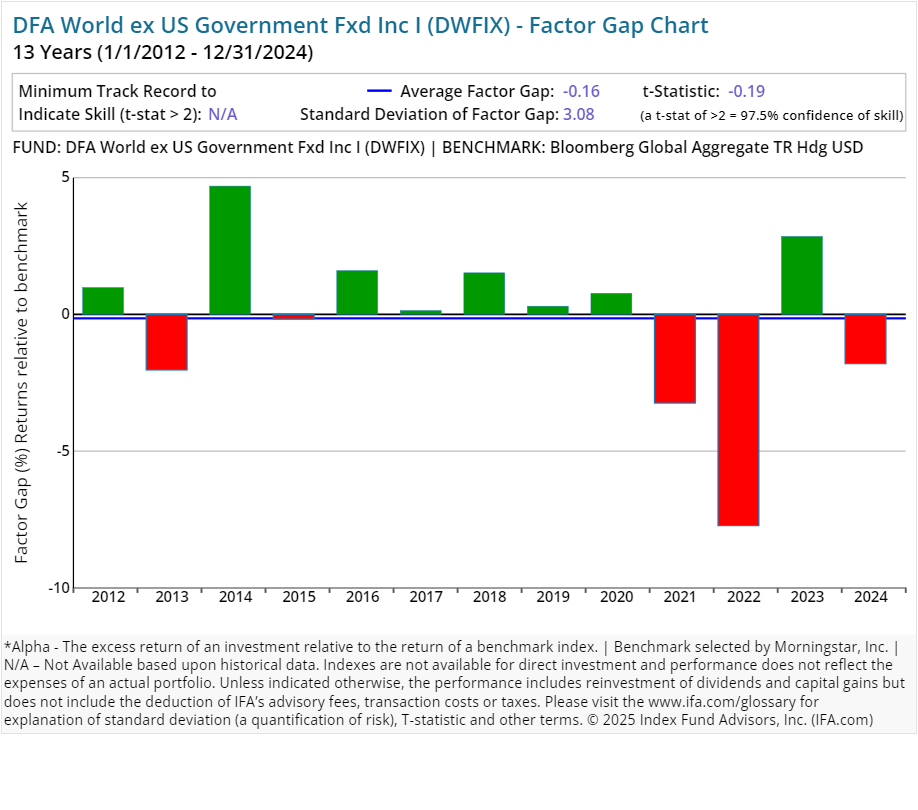
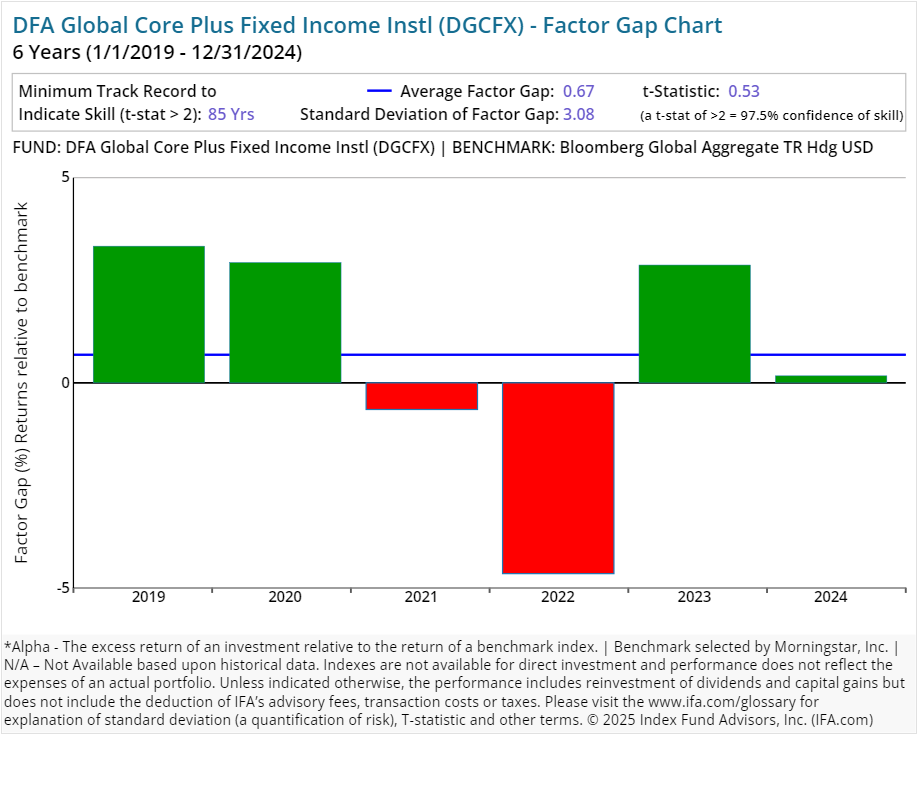
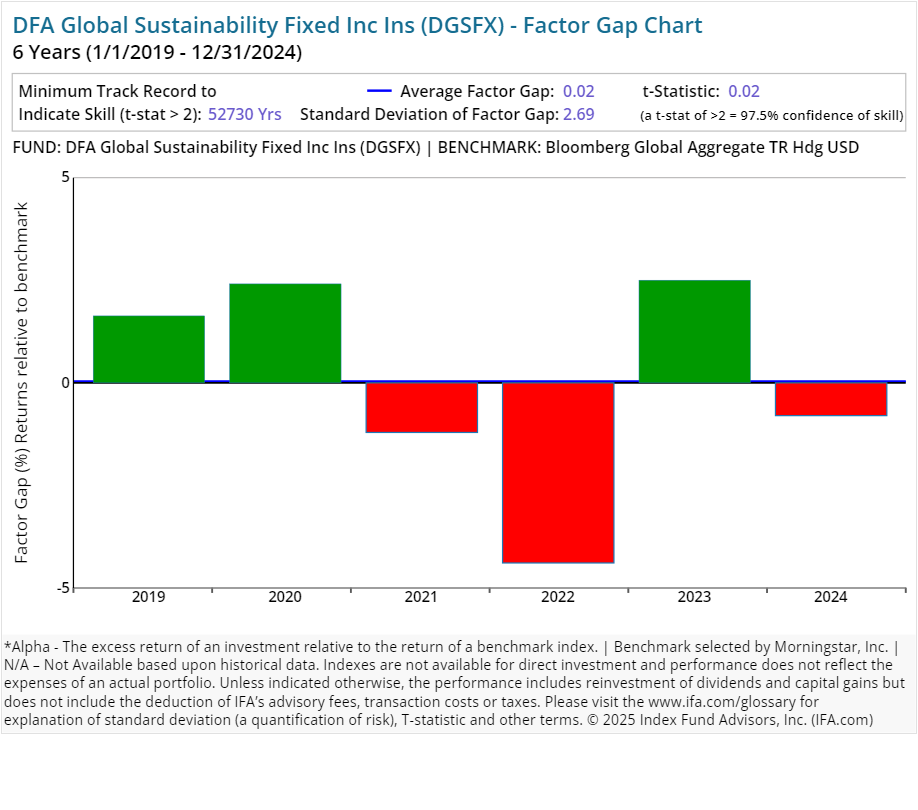
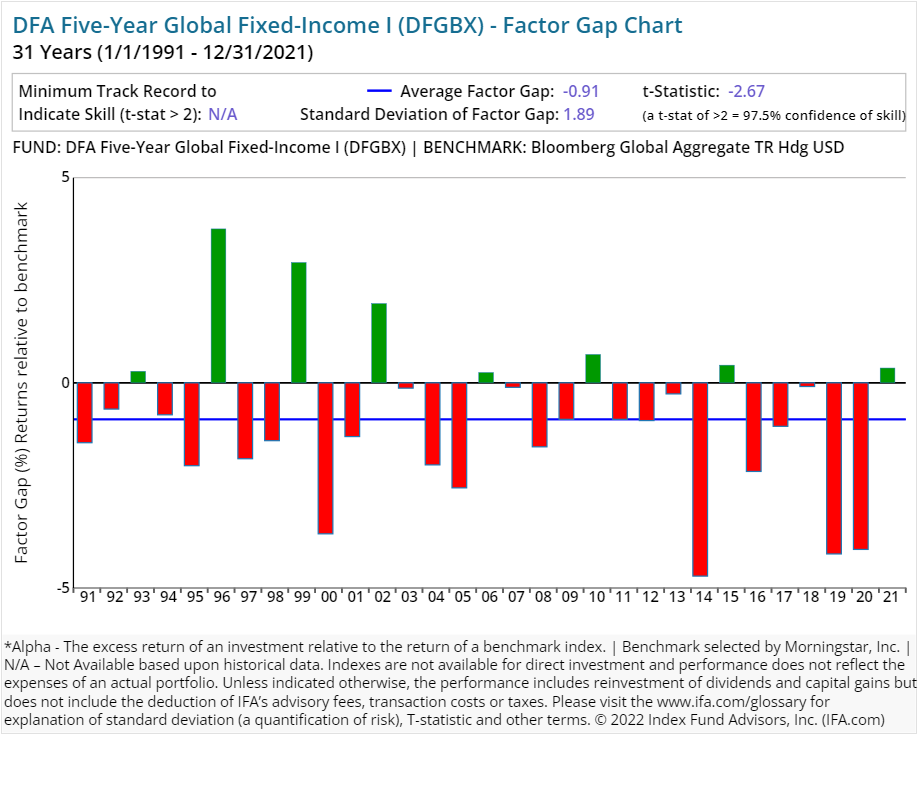
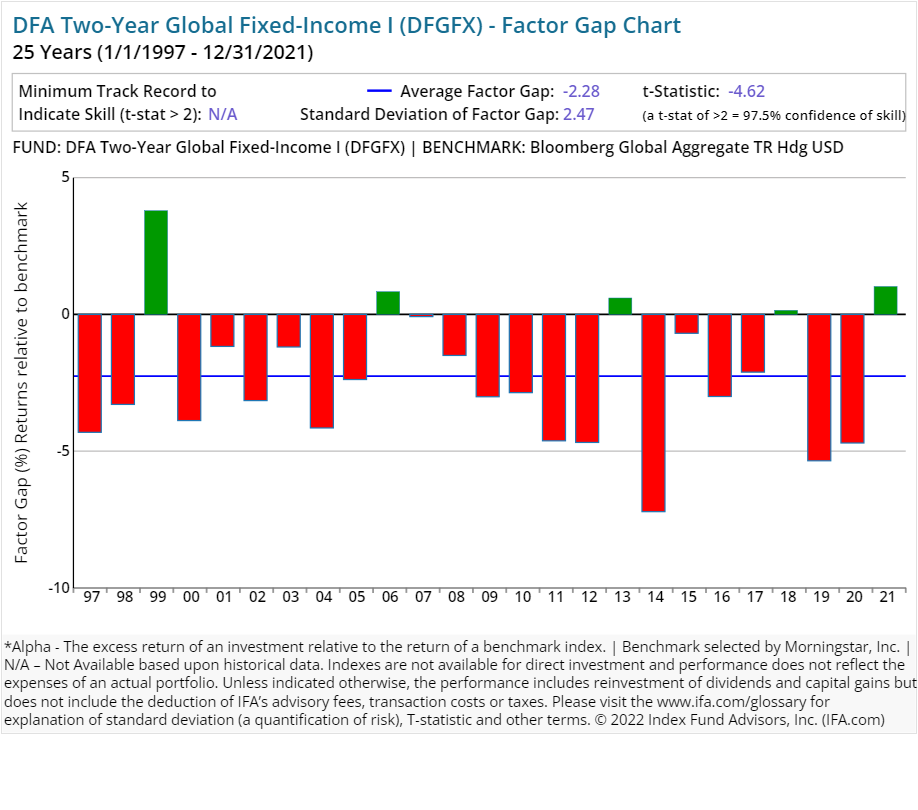
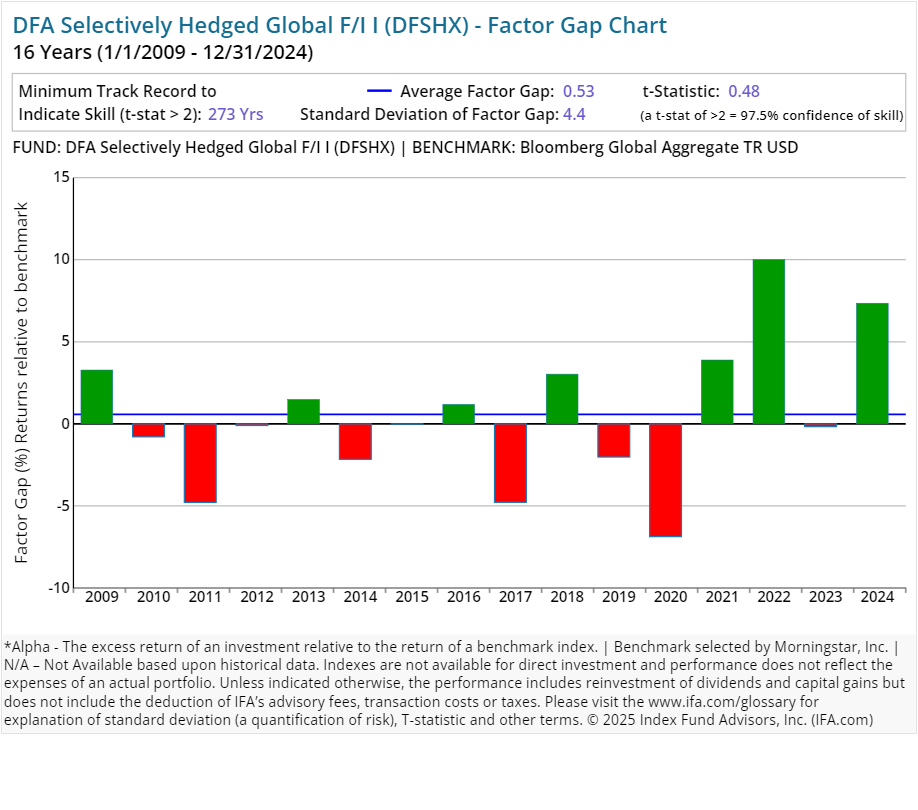
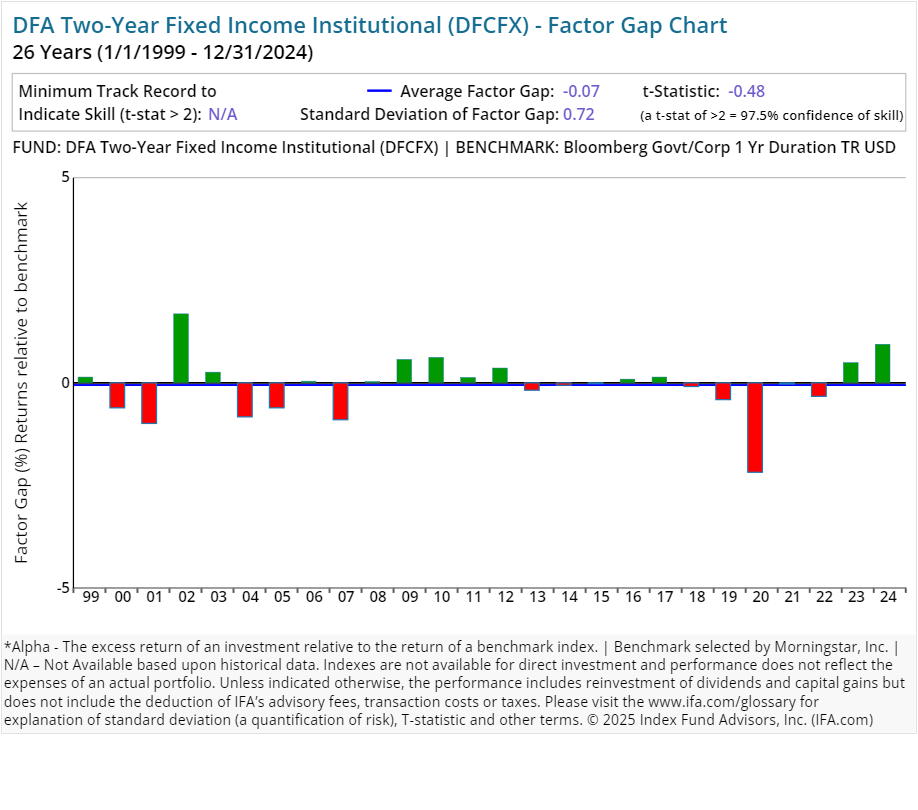
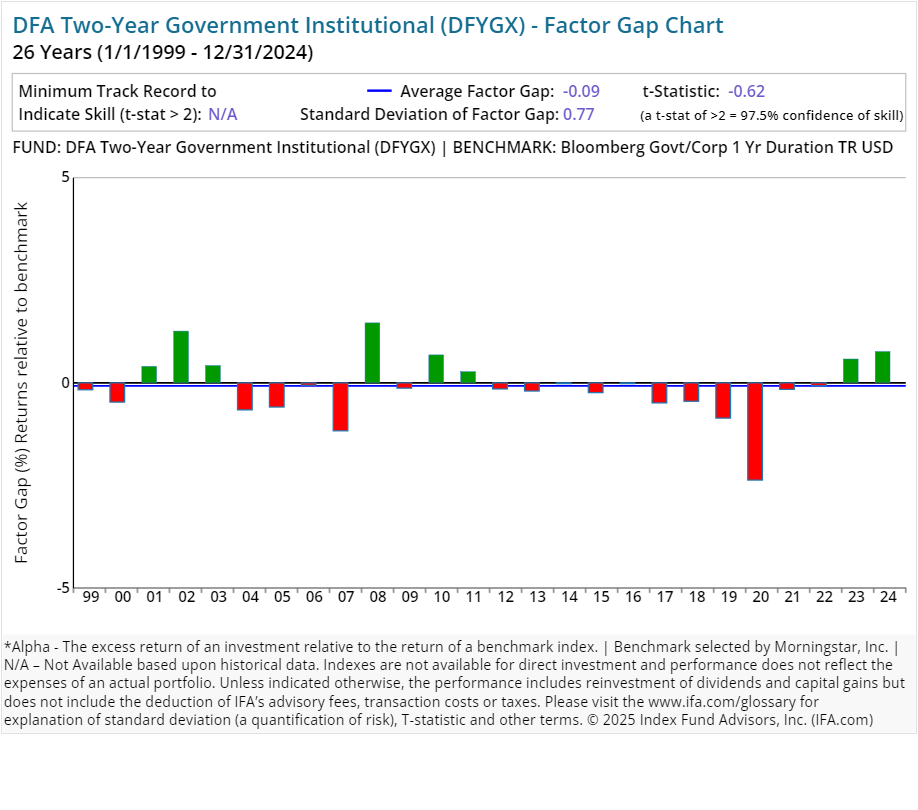
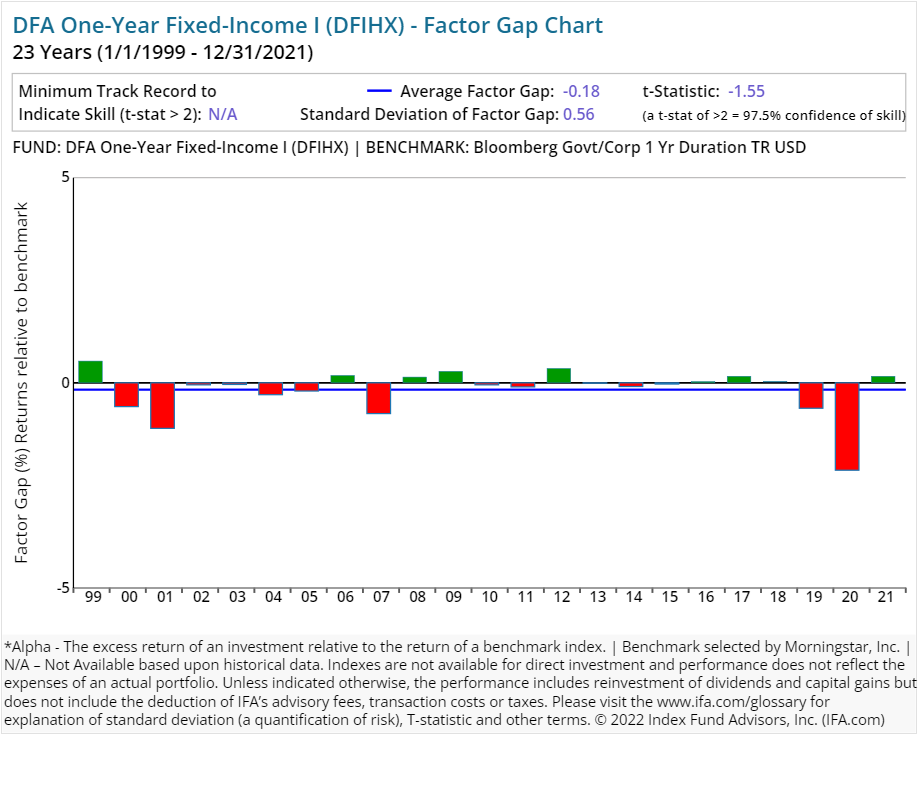
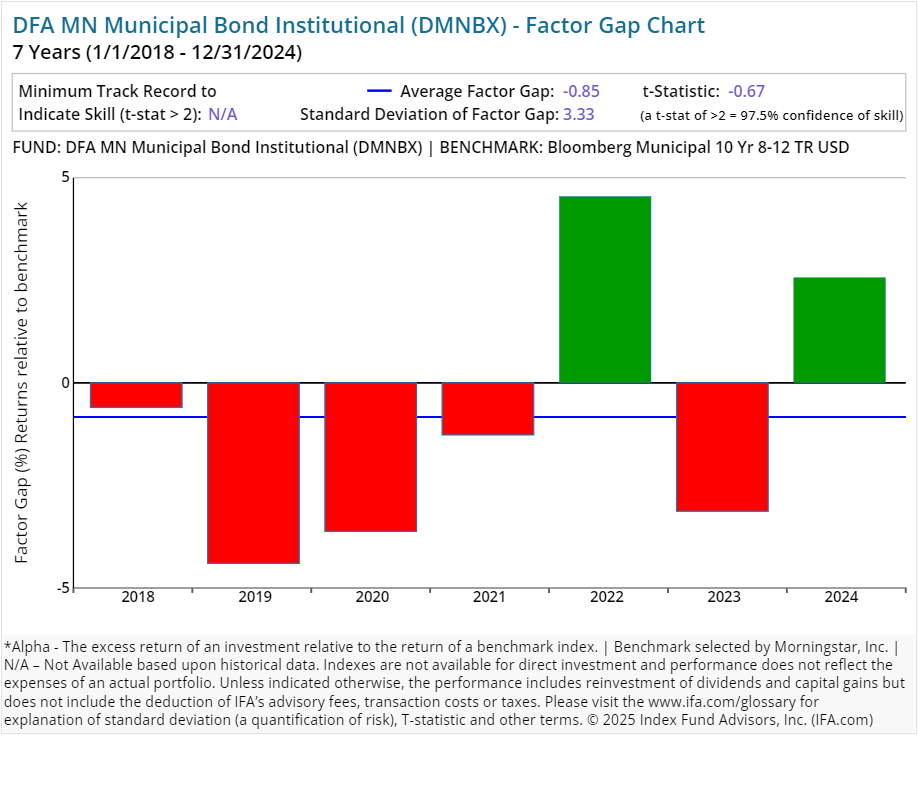
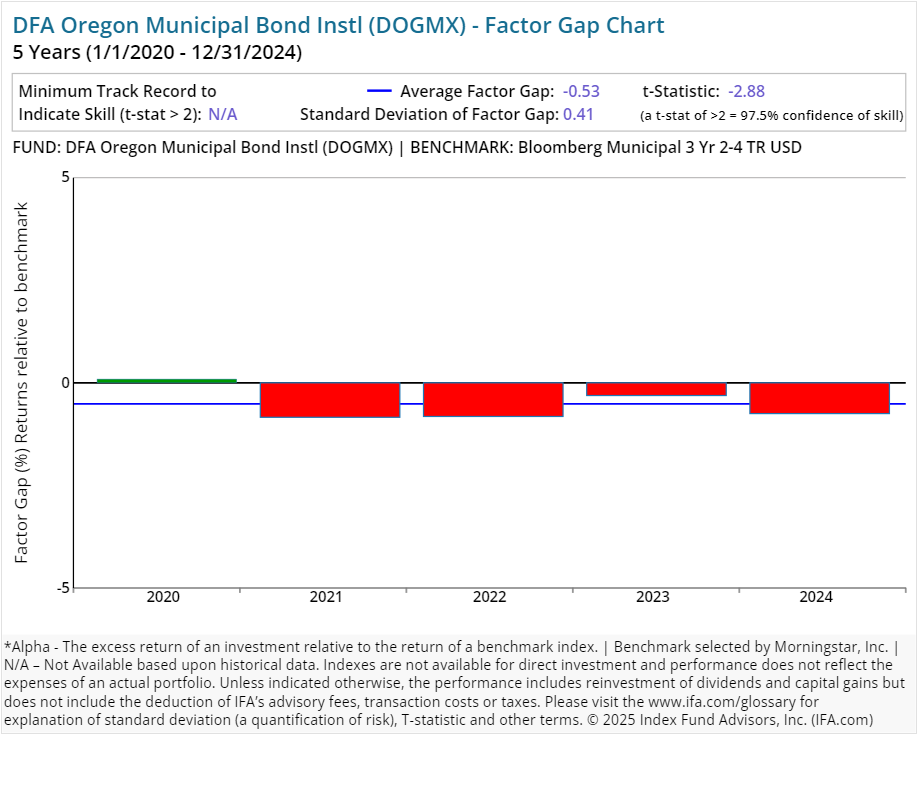
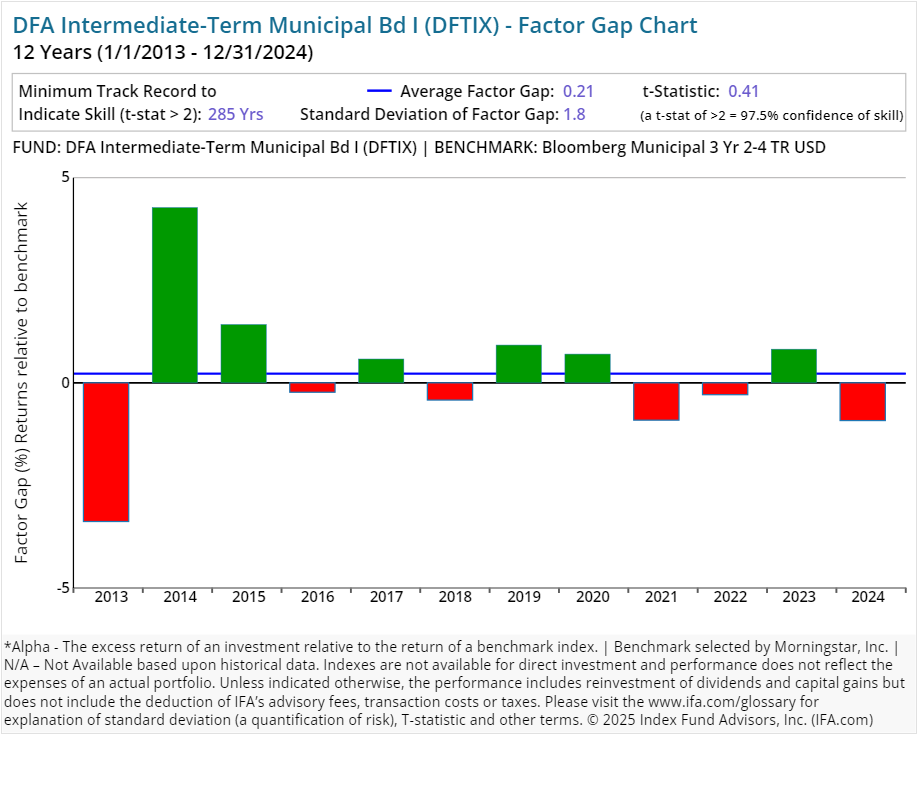
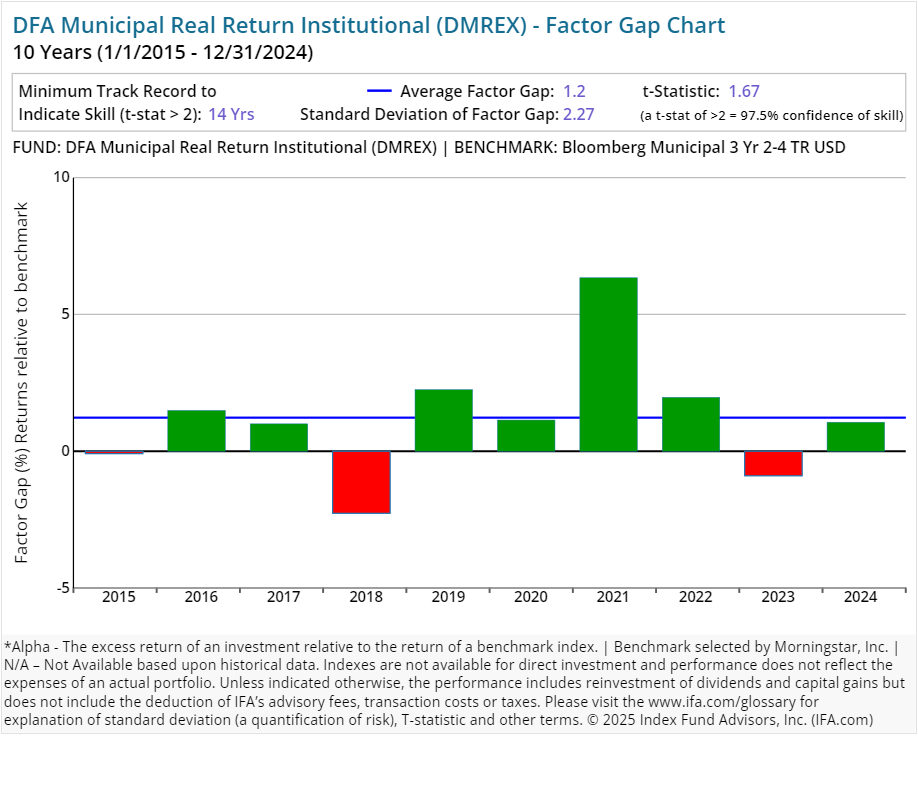
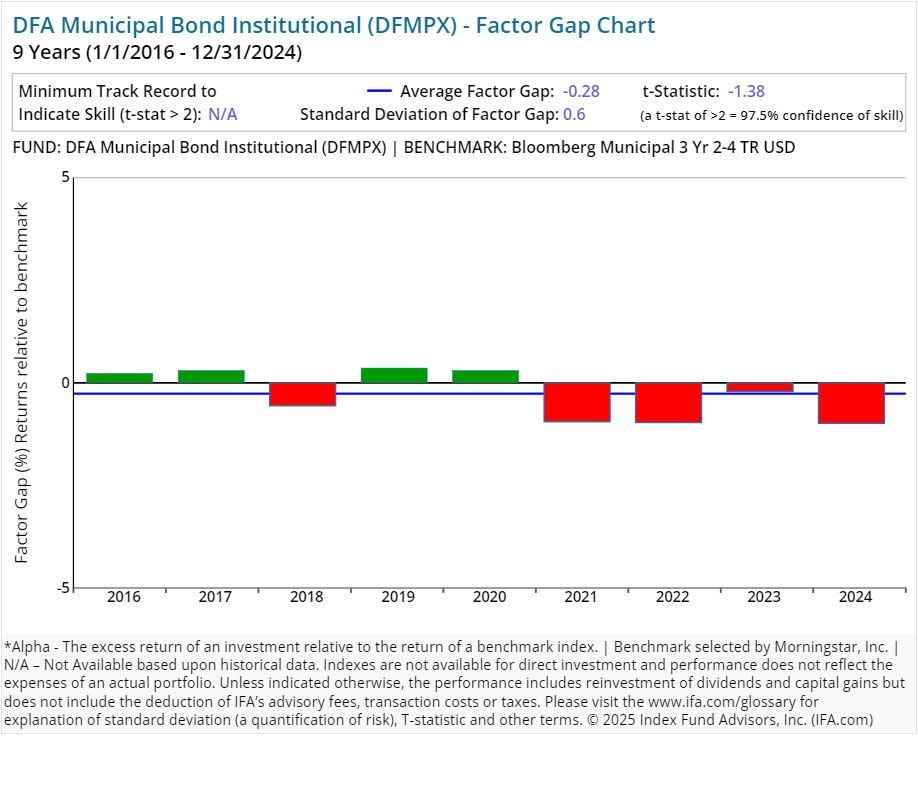
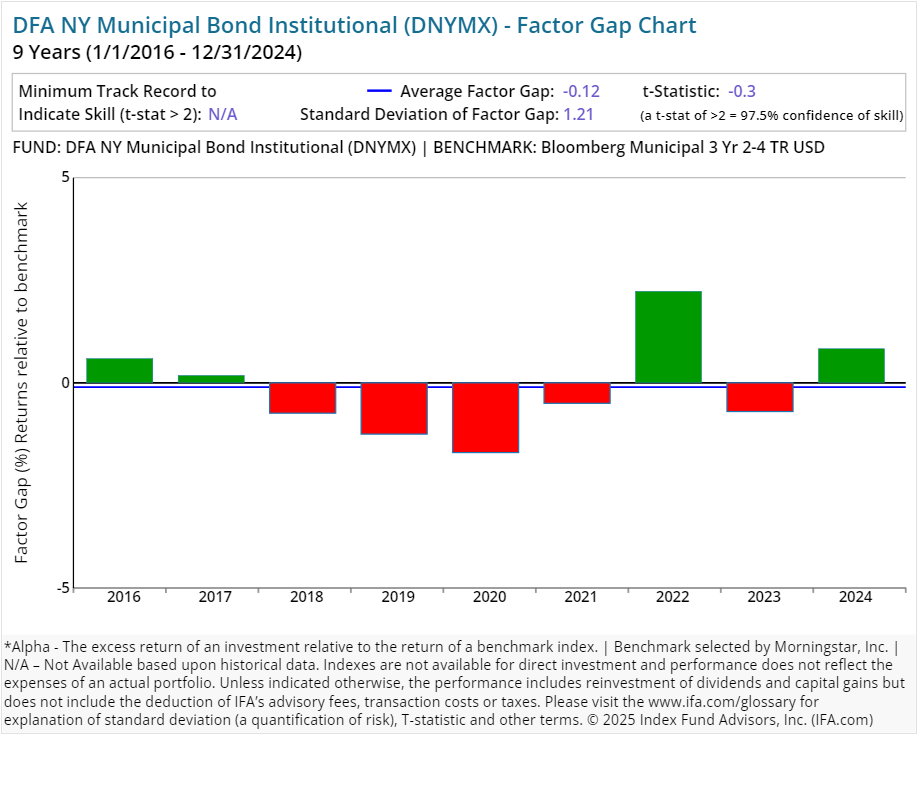
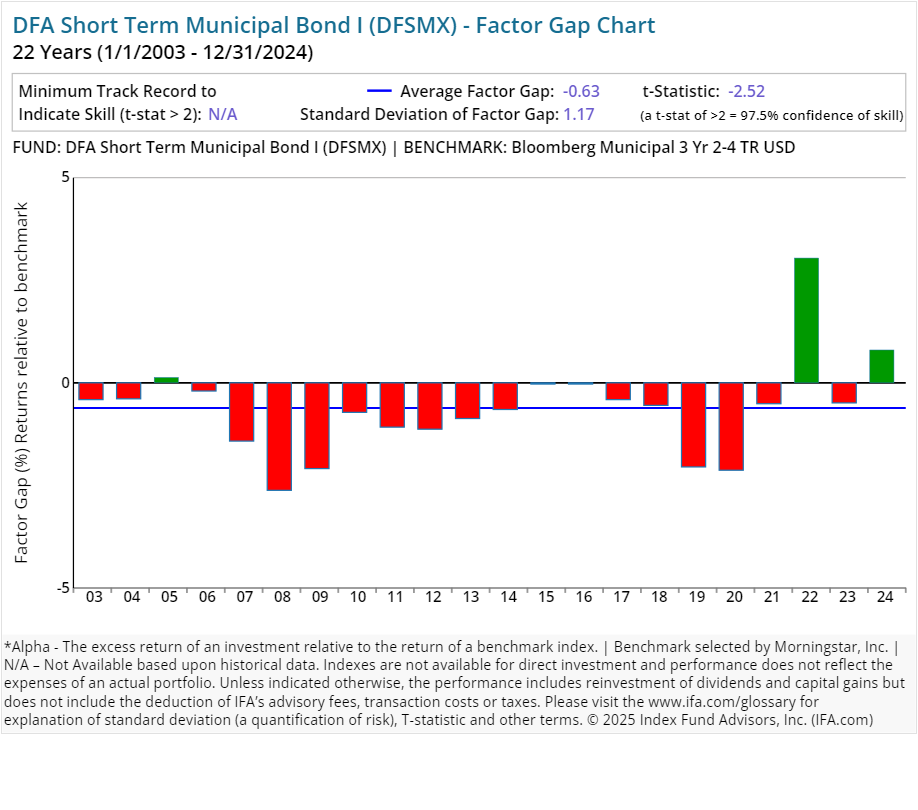
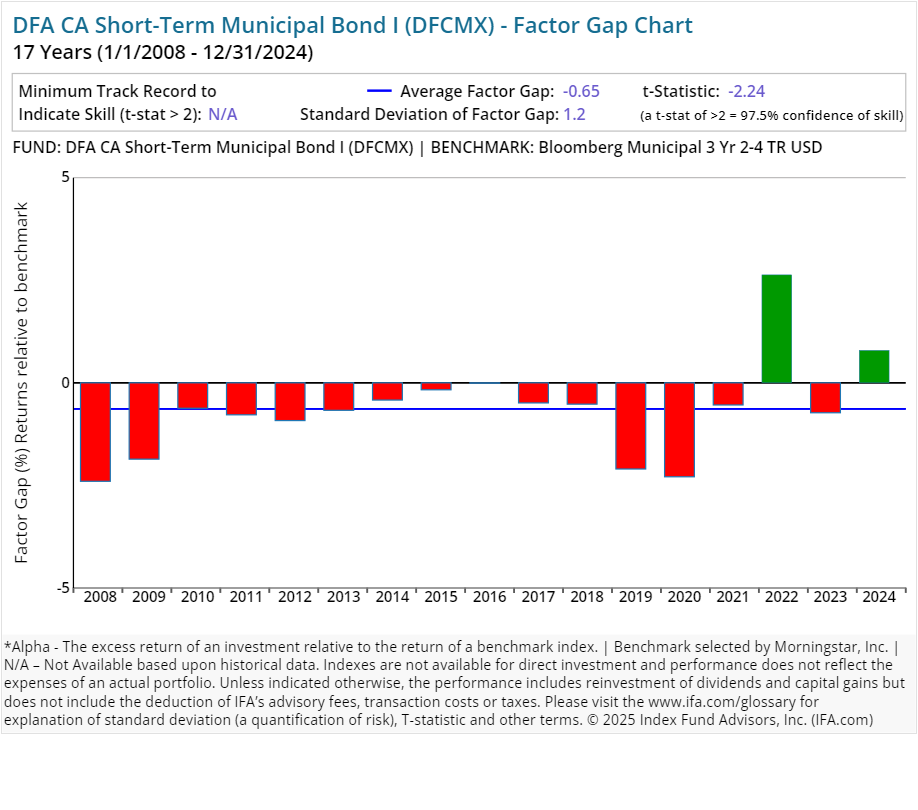
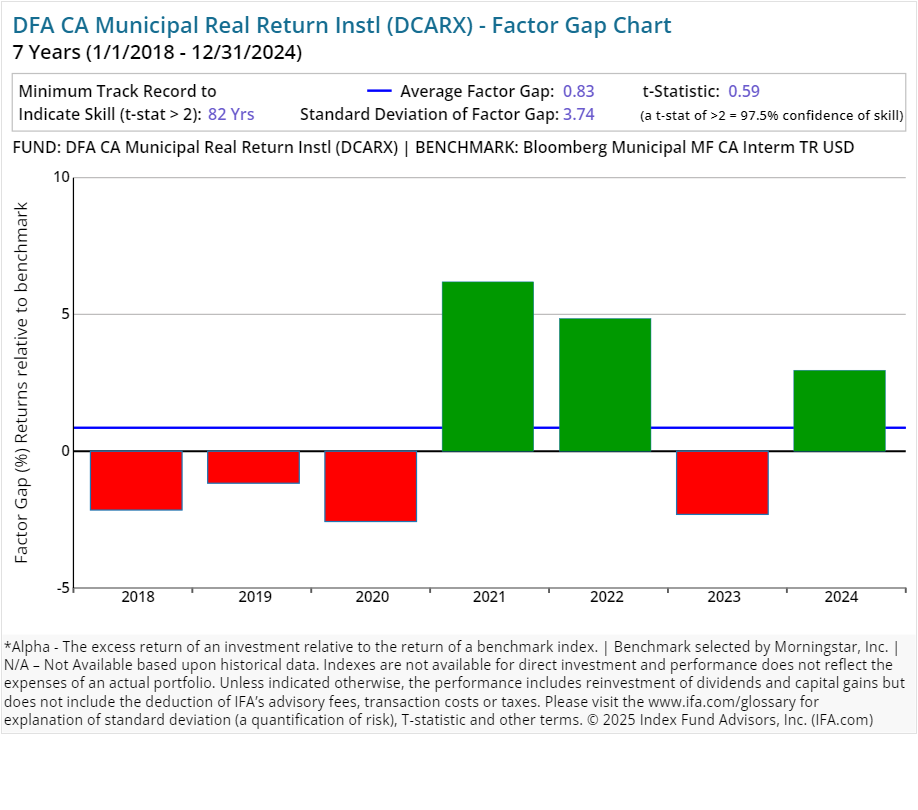
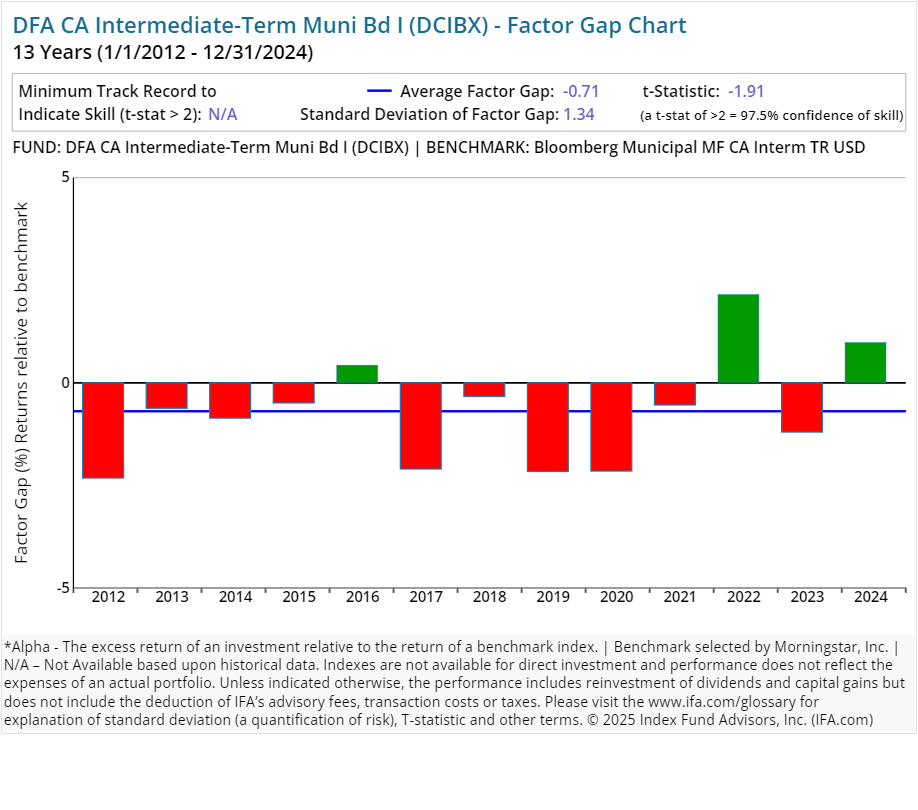
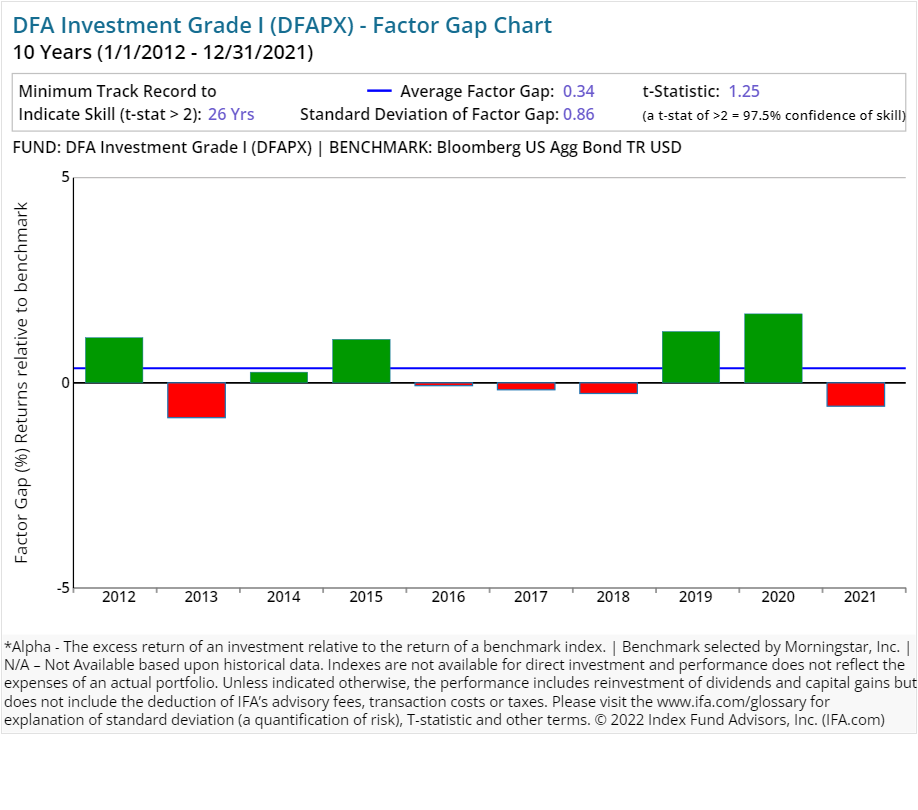
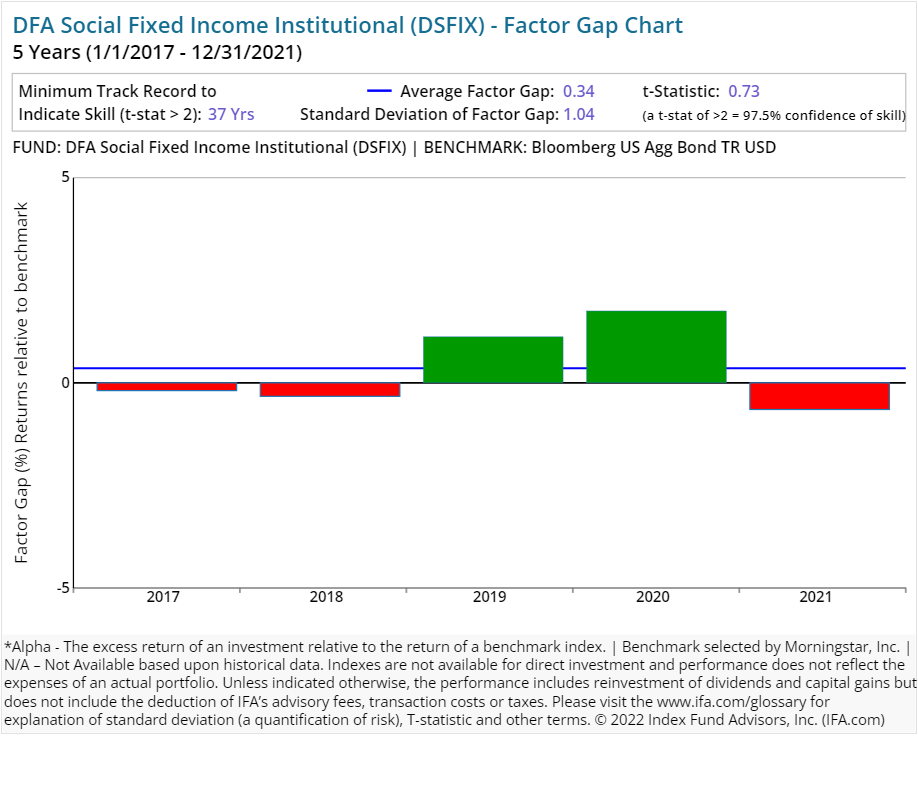
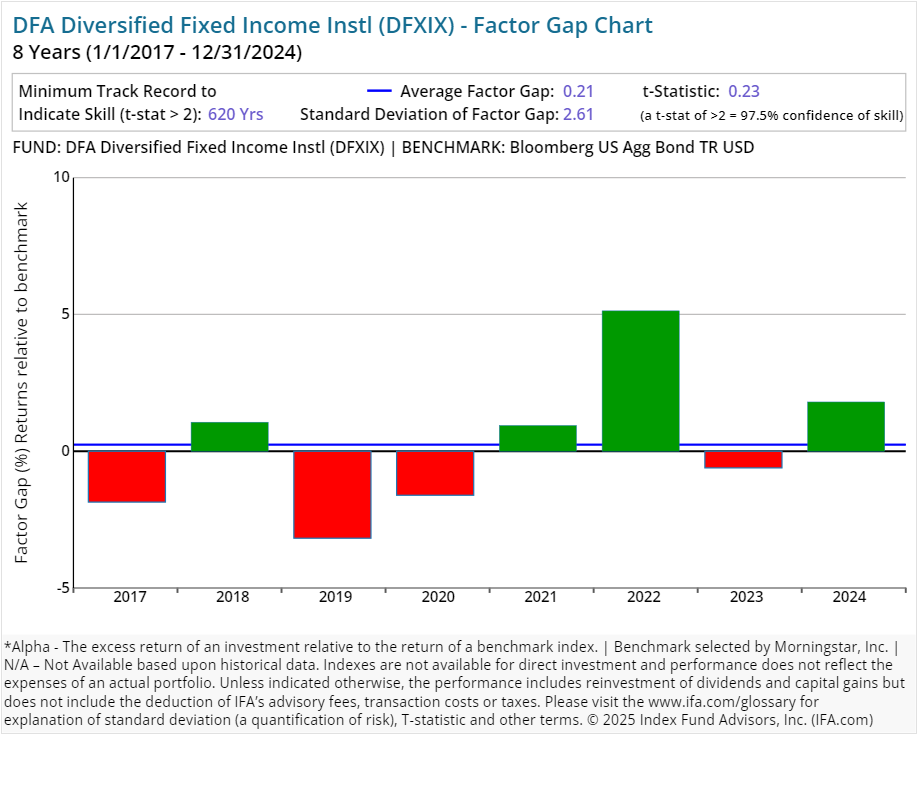
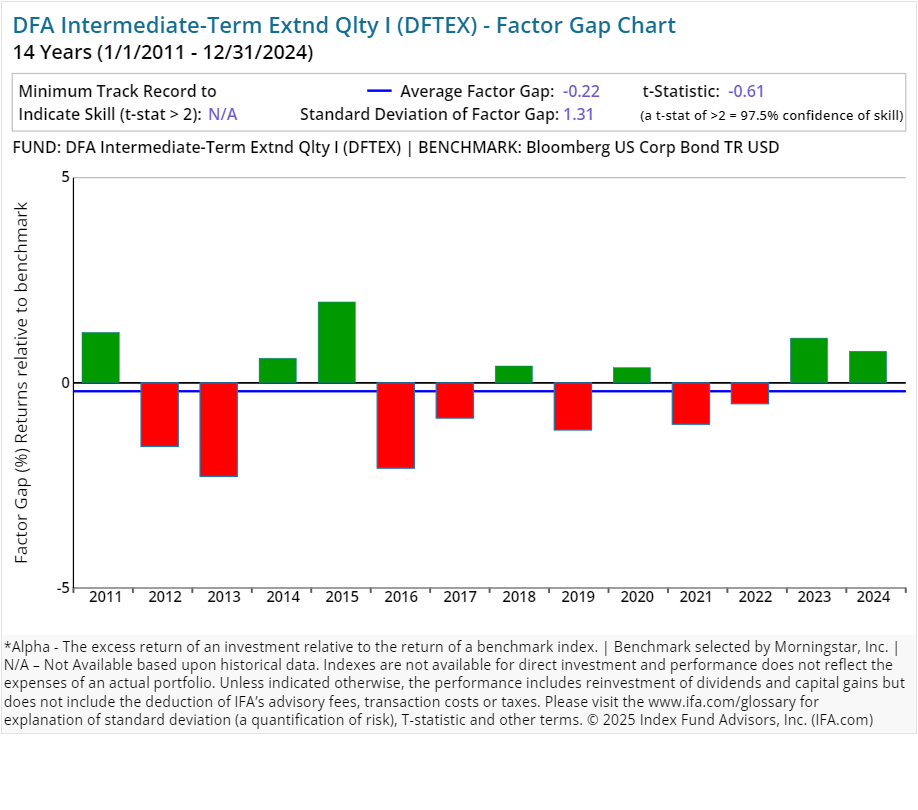
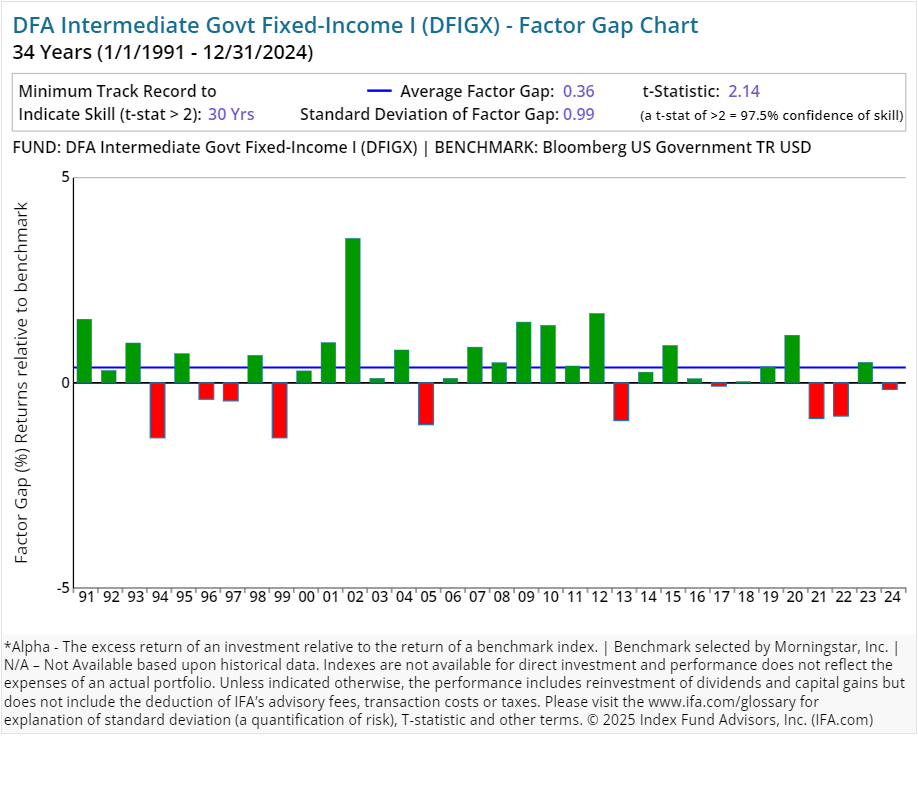
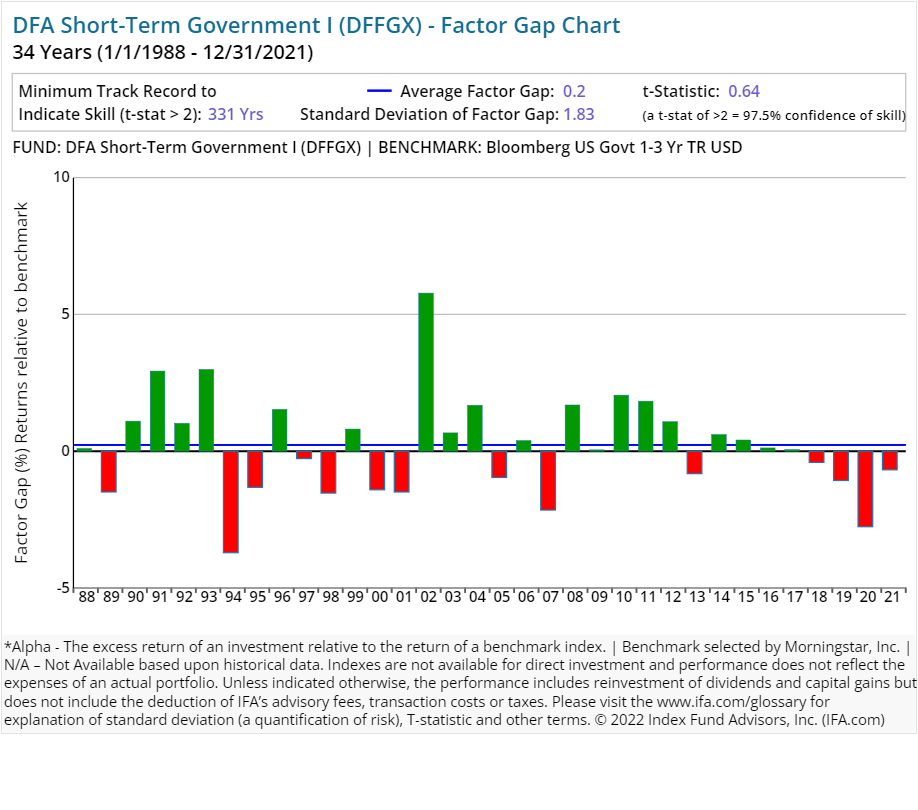
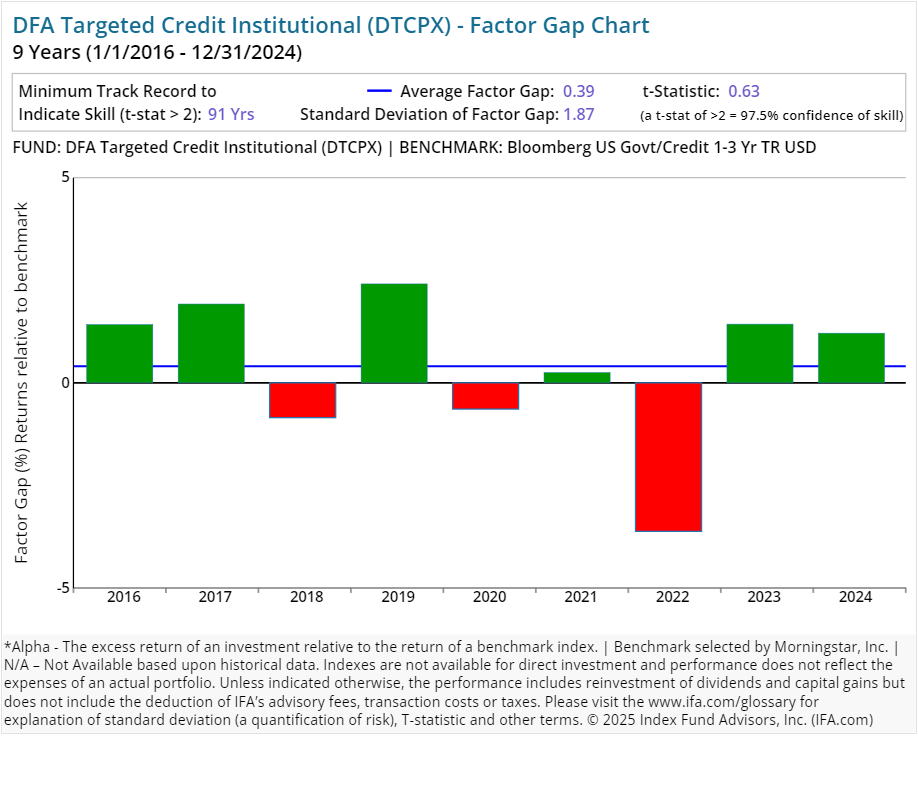
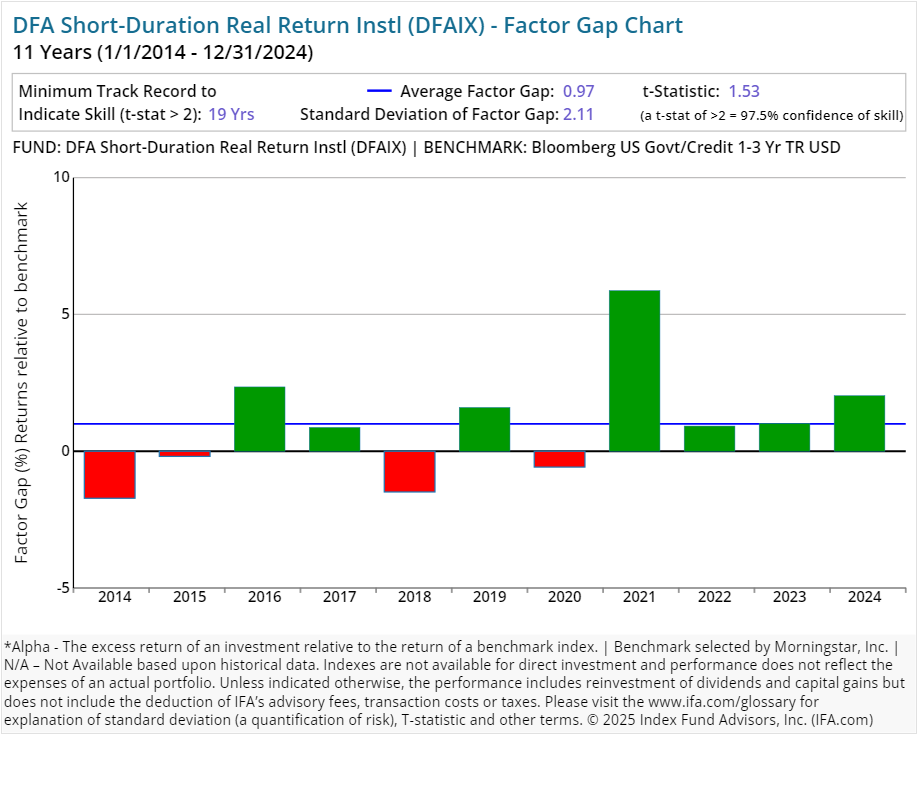
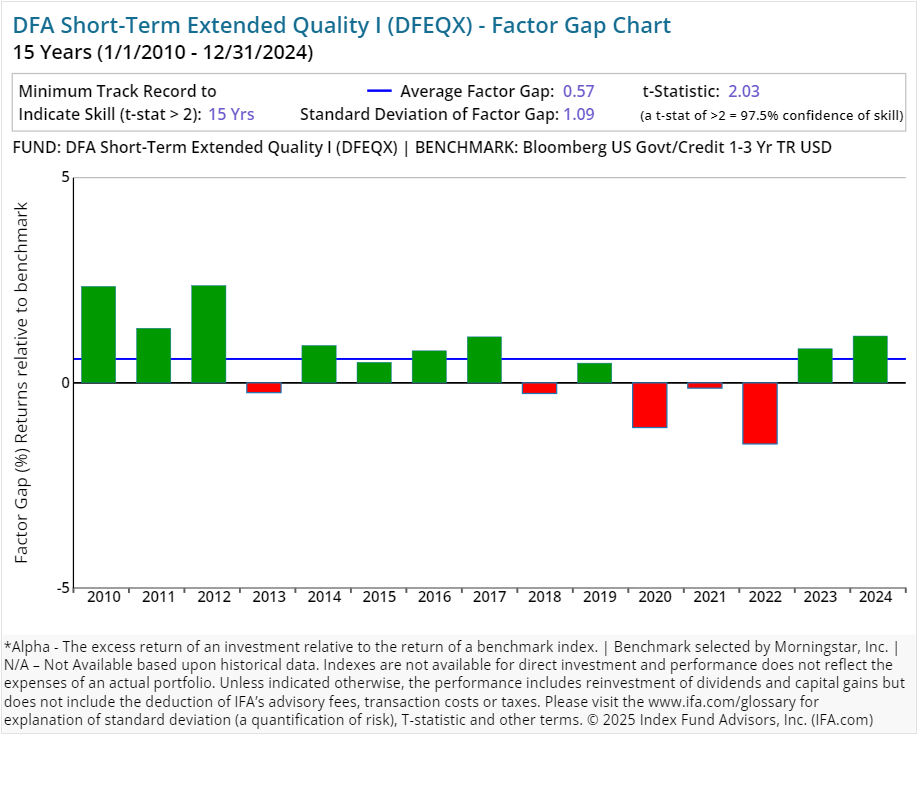
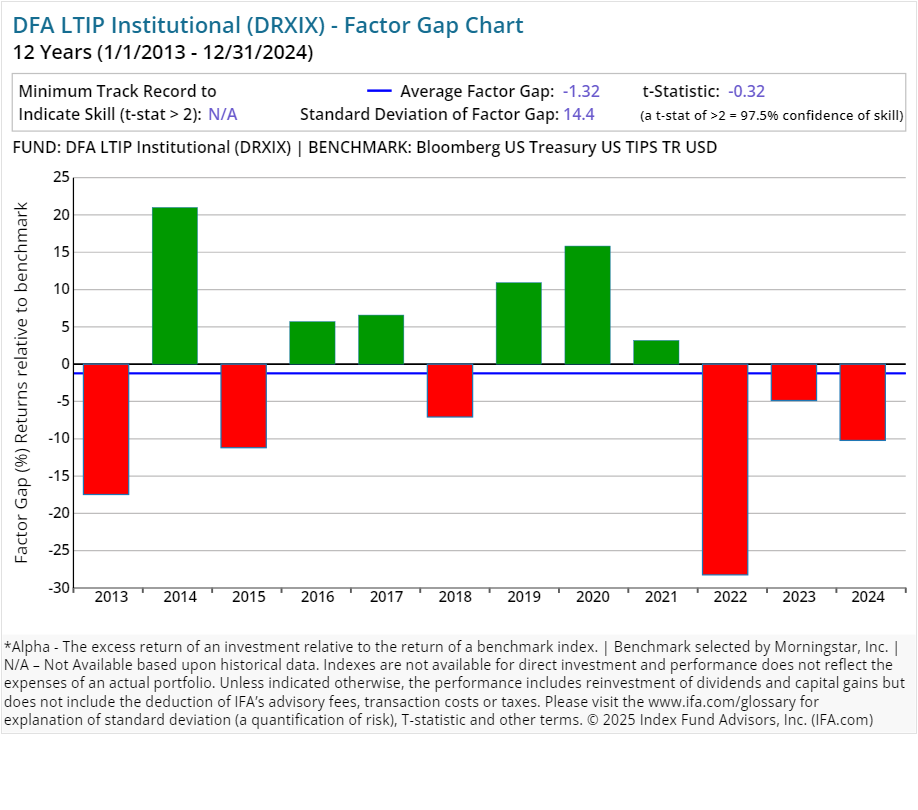
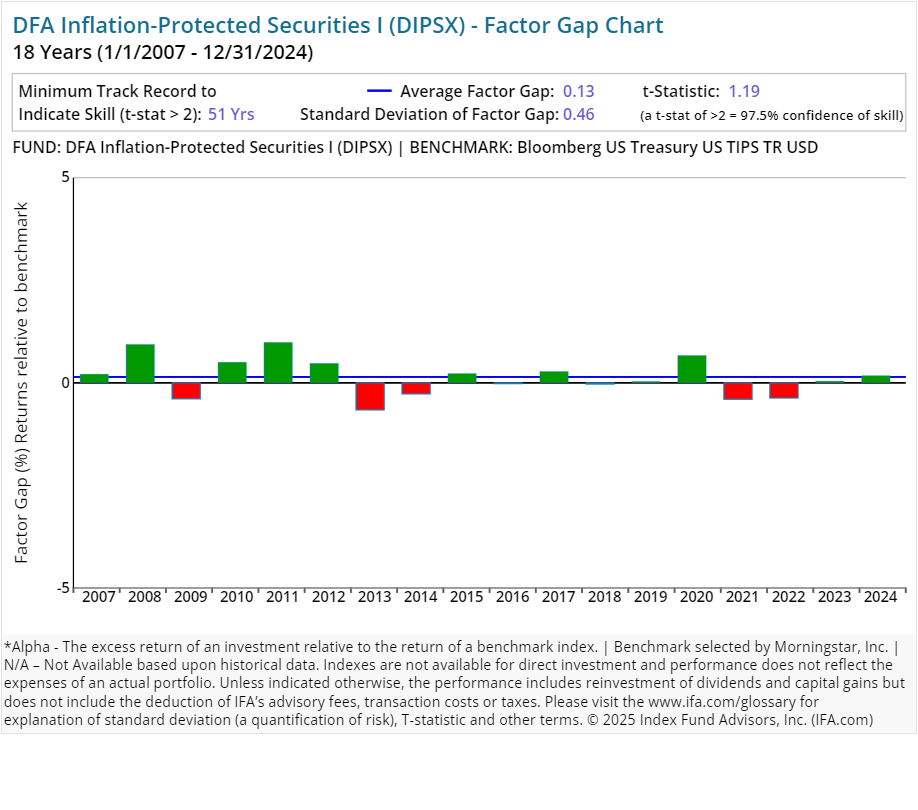
Remember those driving factors of stock and bond returns that we mentioned above? Discrepancies between passively managed fund returns and a benchmark can be attributed to differences in "factor exposures." As a result, we have identified these discrepancies in the charts below as Factor Gaps.
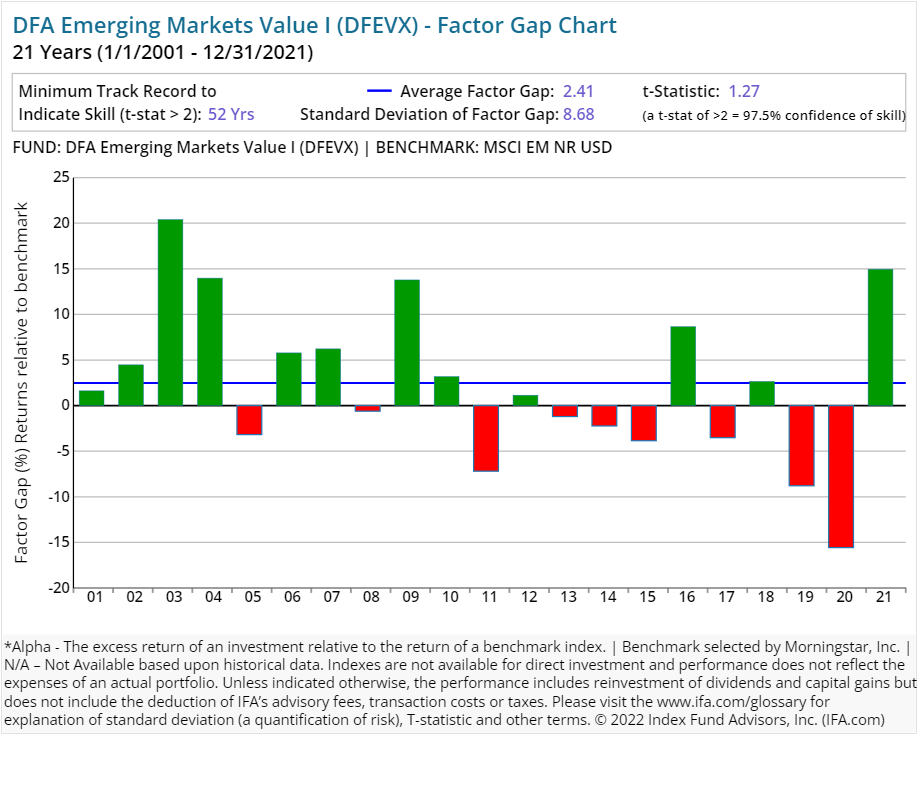
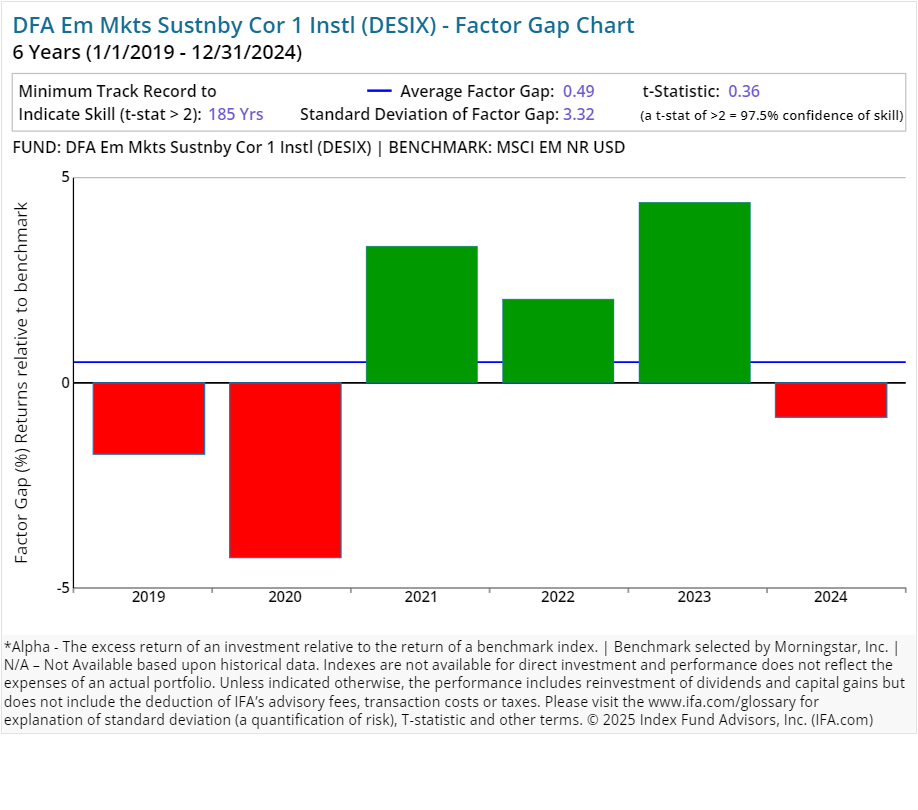
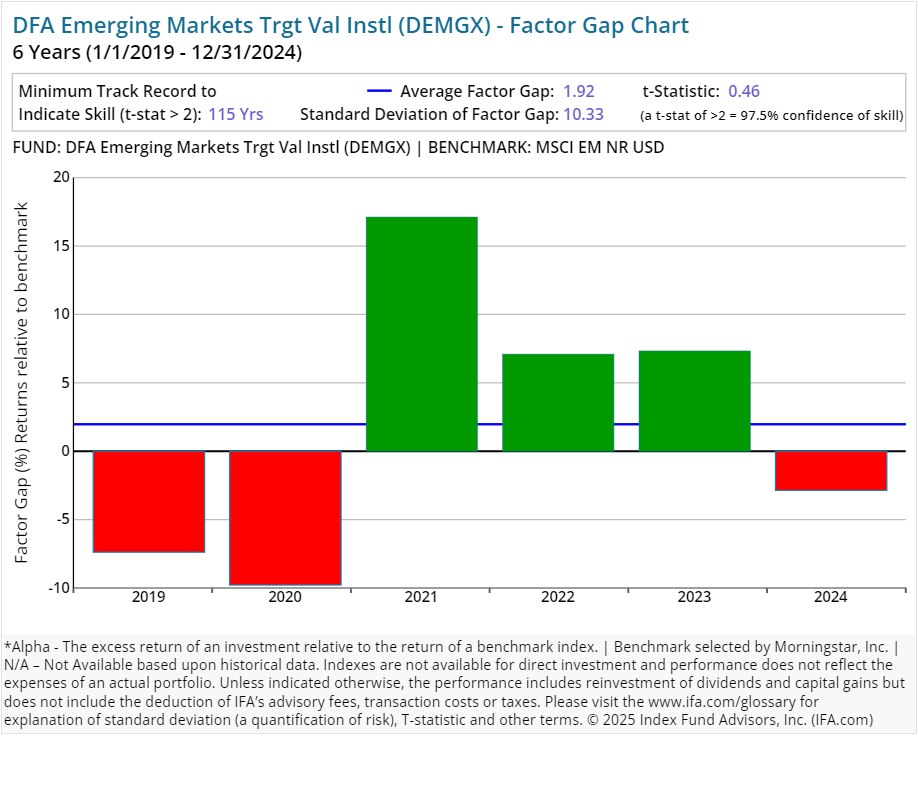
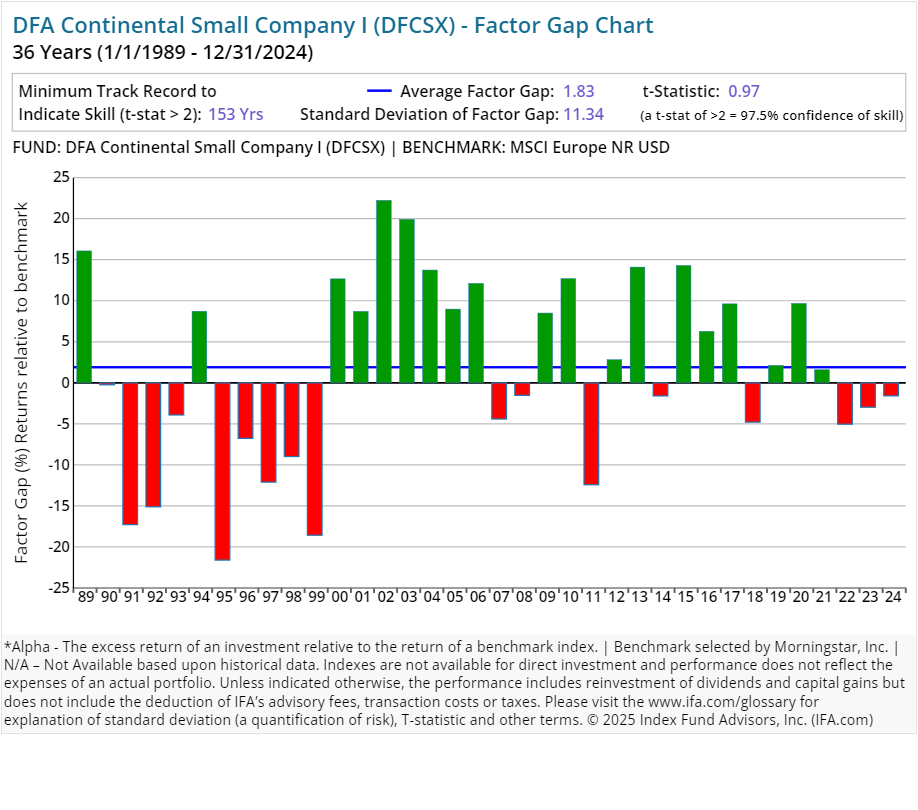
We have included below alpha charts for 82 Dimensional funds that are utilized in various implementations of IFA Index Portfolios. (See these individual fund charts after this report's conclusion.)
Dimensional's equity funds are smaller and more value-oriented, so underperformance relative to the benchmark is due to these factor premiums not being positive for the period examined. The size, value, or profitability premiums are not positive for all time periods. This is because there is risk associated with these premiums. If these factors were always producing at positive levels, prices would reflect this, and then there wouldn't be any risk — driving premiums to zero.
Dimensional's fixed-income funds were created to complement DFA's equity funds. When looking at the Factor Gap (i.e., alpha) between DFA's bond funds and the corresponding Morningstar-assigned benchmarks, underperformance can be attributed to DFA's bond portfolios tending to hold higher credit-quality and lower duration bonds than those assigned benchmarks.
Not All Index Funds Are Created Equal
When investors finally embrace a passive approach to investing they often falsely believe that all passive strategies are nearly identical and that the lowest fee will result in the highest return.
Dimensional's ability to better-target the driving forces behind stock returns has allowed its funds to outperform other index funds over time. This can also be displayed in a comparison of DFA's performance against a similar fund offered by Vanguard. The chart below shows you historical performance of Dimensional versus Vanguard. (The time period is limited by the inception dates of the funds.)
As you can see, in almost every asset class Dimensional has outperformed Vanguard, even with higher expense ratios. Why?
In the table attached to the above bar chart ("Vanguard vs Dimensional Fund Advisors - Select Mutual Fund Comparisons"), there are five different categories that include: Book-to-Market (a value metric); Weighted Average; Market Capitalization and Standard Deviation.
The higher the Book-to-Market ratio, the more the fund is exposed to the value factor. Weighted Average Market Capitalization is a measure of exposure to the size factor. The smaller this number, the greater the exposure to the size factor (small and micro cap stocks).
You can see that Dimensional consistently had a higher Book-to-Market Ratio and a smaller Weighted Average Market Capitalization. In other words, they have been better at targeting the known dimensions of expected stock returns. This has led to their outperformance against Vanguard while still maintaining robust diversification (i.e., number of holdings).
Conclusion
When our wealth advisors are asked about Dimensional's "alpha," it presents a great opportunity for us to help educate investors on the fact that DFA doesn't try to generate an "alpha" in the traditional sense of security selection. This is in contrast to the entire active investment community, which is seeking alpha by selecting the "best" stocks or bonds.
With this additional analysis tool, we've found that the majority of all active fund managers haven't been able to reliably deliver alpha. When they've been able to do better than a comparable index, it's almost always in spurts. Even so, many active managers try to present any short-term success (i.e., positive alpha) as a repeatable skill — not as chance outcomes.
In both our own internal reviews as well as third-party research we've found to be particularly comprehensive and well-structured, Dimensional has shown a keen sensitivity to this lack (or absence) of alpha — along with a heightened understanding of important strides being made in academic research on risk factors. Together, these attributes provide our clients with return patterns that are different over time than we've been able to find elsewhere.
This, among many other reasons, is why IFA's wealth advisors continue in most cases to recommend DFA's mutual funds and ETFs.
Another point worth keeping in mind is depicted in the figure below. It shows the formula to determine the t-stat for a fund. Our investment committee warns investors against trusting or relying on data relating to alpha or averge returns without t-stat calculations.
Below is a figure showing the formula used to calculate the number of years needed for a t-stat of 2. We first determine the excess return over a benchmark (the alpha), then determine the regularity of the excess returns by calculating the standard deviation of those returns. Based on these two numbers, we can then calculate how many years we need (sample size) to support the manager's claim of skill.
This is not to be construed as an offer, solicitation, recommendation, or endorsement of any particular security, product or service. There is no guarantee investment strategies will be successful. Investing involves risks, including possible loss of principal. Performance may contain both live and back-tested data. Data is provided for illustrative purposes only, it does not represent actual performance of any client portfolio or account and it should not be interpreted as an indication of such performance. IFA Index Portfolios are recommended based on time horizon and risk tolerance. Take the IFA Risk Capacity Survey (www.ifa.com/survey) to determine which portfolio captures the right mix of stock and bond funds best suited to you. For more information about Index Fund Advisors, Inc, please review our brochure at https://www.adviserinfo.sec.gov/ or visit www.ifa.com.

