Asset bloat is a situation where a mutual fund experiences a large influx of new money. This often occurs after a fund has had a period of superior performance relative to its benchmark. This is typically not an issue for index funds but can be problematic for actively managed funds.
Asset bloat can result in an active fund becoming too large to manage effectively. At some point it becomes extremely difficult for the fund manager to find stock ideas that are within the fund's mandate. Ironically, this can impact the performance that was responsible for the asset growth in the first place.
Of course, active managers can choose to close their funds to new investment dollars. But mutual fund manufacturers naturally prefer to keep those spigots open to build assets and collect more revenue. This relates to an ongoing critique of active mutual fund managers that even if they don't completely close, those with "hot hands" face ongoing pressure to stay in the game.
The challenge of actively managing a bloated portfolio has been described by some academics as similar in nature to trying to navigate an aircraft carrier as opposed to a 30-foot speedboat. And nowhere is this more problematic to many leading market researchers than with actively managed small-cap stock mutual funds.
An abundance of research suggests that wheeling-and-dealing in less liquid parts of the market — while trying to actively juggle individual positions within a fund — are much more pronounced concerns for small-cap managers as compared to those who run large-cap mutual funds. By contrast, index fund managers who trade infrequently and follow a set of rules which are held constant regardless of market conditions don't face these same thorny asset bloat issues.
Given such an industry landscape, we thought it might be interesting to put under our research microscope one of the most prominent proponents of active management's foray into small-cap investing, Royce Investment Partners.
This family of funds was started in 1972 by a former Wall Street equity analyst, Chuck Royce. In fact, he began with a focus on larger-cap stocks. After his initial fund lost more than 40% in back-to-back years, Royce switched to becoming a specialist in smaller-cap stocks. It was a part of the market he characterized as holding more opportunities for active management since it was less scrutinized and traveled by big institutions.
Along the way, Royce's managers have also sharpened their focus on small-cap value stocks. In 2001, the firm agreed to be acquired by a much larger asset manager, Legg Mason. At the time, Royce had slightly more than $5 billion in assets. By 2024, the New York-based Royce Investment Partners had grown to manage more than $12 billion in assets and employ 39 investment professionals.
Today, Royce promotes itself as small-cap specialists for Franklin Templeton, which acquired Legg Mason in 2020. As with our other Deeper Looks into different fund families, this analysis of Royce investigates claims by active managers of peer performance superiority by holding them to a higher standard — i.e., how they've done over longer periods against their respective indexes.
Controlling for Survivorship Bias
It's important for investors to understand the concept of survivorship bias, which occurs when performance analyses focus only on funds that currently exist, potentially overstating overall performance by excluding funds that were closed or merged due to poor results. While Royce currently offers 10 active equity mutual funds with five or more years of performance-related data, the company has historically managed a total of 32 funds in this category. This includes 22 funds that no longer exist, either due to underperformance, mergers, or other reasons. To provide a more comprehensive view, the performance analysis in this article includes both surviving and non-surviving funds, aggregating their results to account for survivorship bias. Details of this aggregate performance analysis can be found in the "Performance Analysis" section.
Fees & Expenses
Let's first examine the costs associated with Royce's surviving 10 strategies. It should go without saying that if investors are paying a premium for investment "expertise," then they should be receiving above average results consistently over time. The alternative would be to simply accept a market's return, less a significantly lower fee, via an index fund.
The costs we examine include expense ratios, sales loads — front-end (A), back-end (B) and level (C) — as well as 12b-1 marketing fees. These are considered the "hard" costs that investors incur. Prospectuses, however, do not reflect the trading costs associated with mutual funds.
Commissions and market impact costs are real expenses associated with implementing a particular investment strategy and can vary depending on the frequency and size of the trades executed by portfolio managers.
We can estimate the costs associated with an investment strategy by looking at its annual turnover ratio. For example, a turnover ratio of 100% means that the portfolio manager turns over the entire portfolio in one year. This is considered an active approach, and investors holding these funds in taxable accounts will likely incur a higher exposure to tax liabilities, such as short- and long-term capital gains distributions, than those incurred by passively managed funds.
The table below details the hard costs as well as the turnover ratio for all 10 surviving active funds offered by Royce that have at least five years of complete performance history. You can search this page for a symbol or name by using Control F in Windows or Command F on a Mac. Then click the link to see the Alpha Chart. Also, remember that this is what is considered an in-sample test; the next level of analysis is to do an out-of-sample test (for more information see here).
| Fund Name | Ticker | Turnover Ratio % | Prospectus Net Expense Ratio | 12b-1 Fee | Global Category |
| Royce Small-Cap Total Return Invmt | RYTRX | 65.00 | 1.26 | 0.00 | US Equity Small Cap |
| Royce Premier Invmt | RYPRX | 15.00 | 1.19 | 0.00 | US Equity Small Cap |
| Royce Micro-Cap Invmt | RYOTX | 19.00 | 1.24 | 0.00 | US Equity Small Cap |
| Royce Small-Cap Fund Invmt | PENNX | 40.00 | 0.94 | 0.00 | US Equity Small Cap |
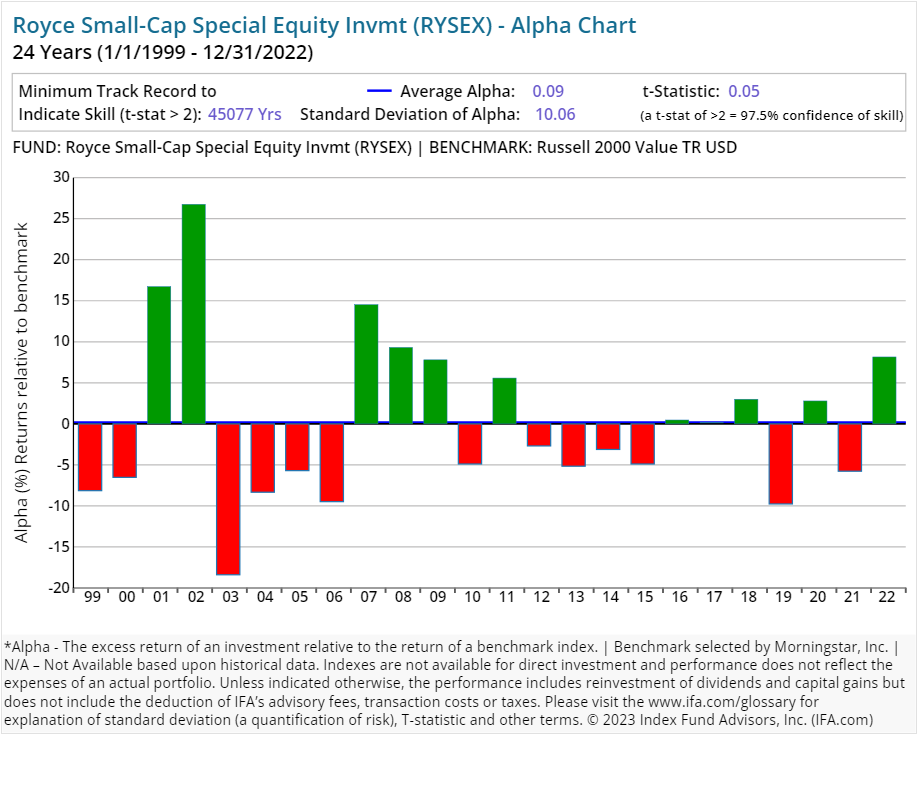
| Royce Small-Cap Special Equity Invmt | RYSEX | 14.00 | 1.22 | 0.00 | US Equity Small Cap |
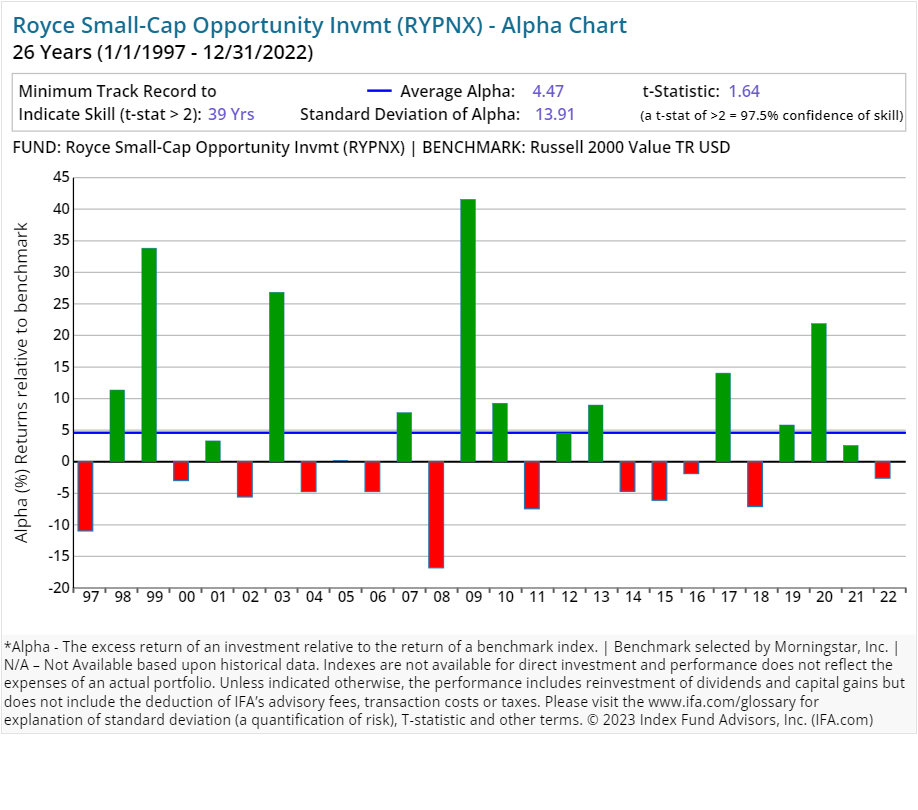
| Royce Small-Cap Opportunity Invmt | RYPNX | 35.00 | 1.23 | 0.00 | US Equity Small Cap |
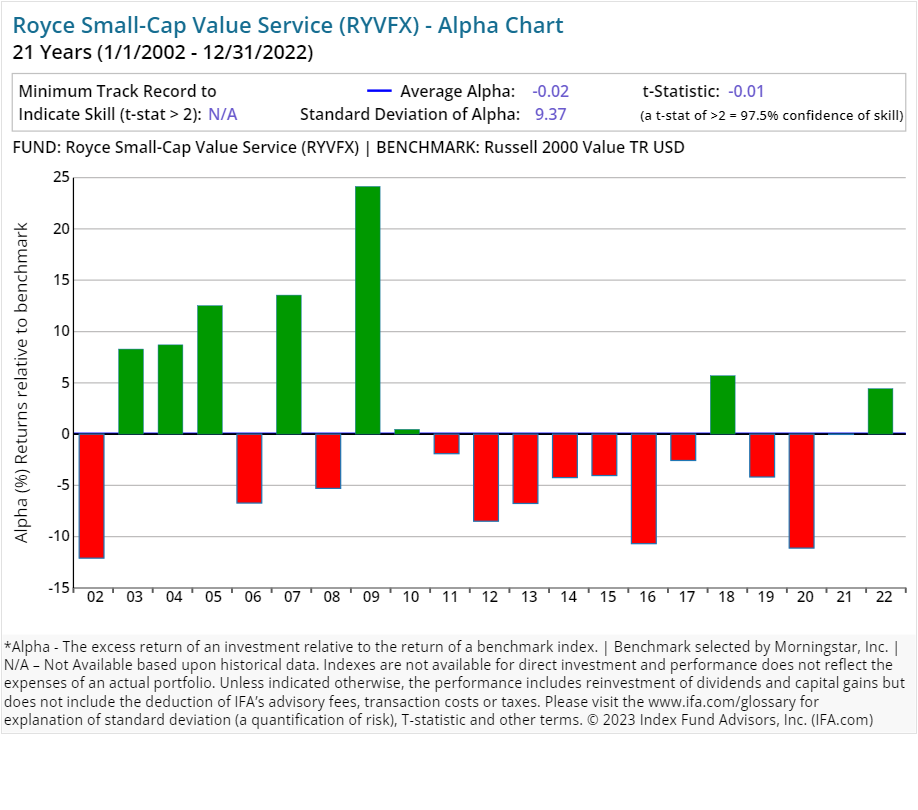
| Royce Small-Cap Value Service | RYVFX | 48.00 | 1.49 | 0.25 | US Equity Small Cap |
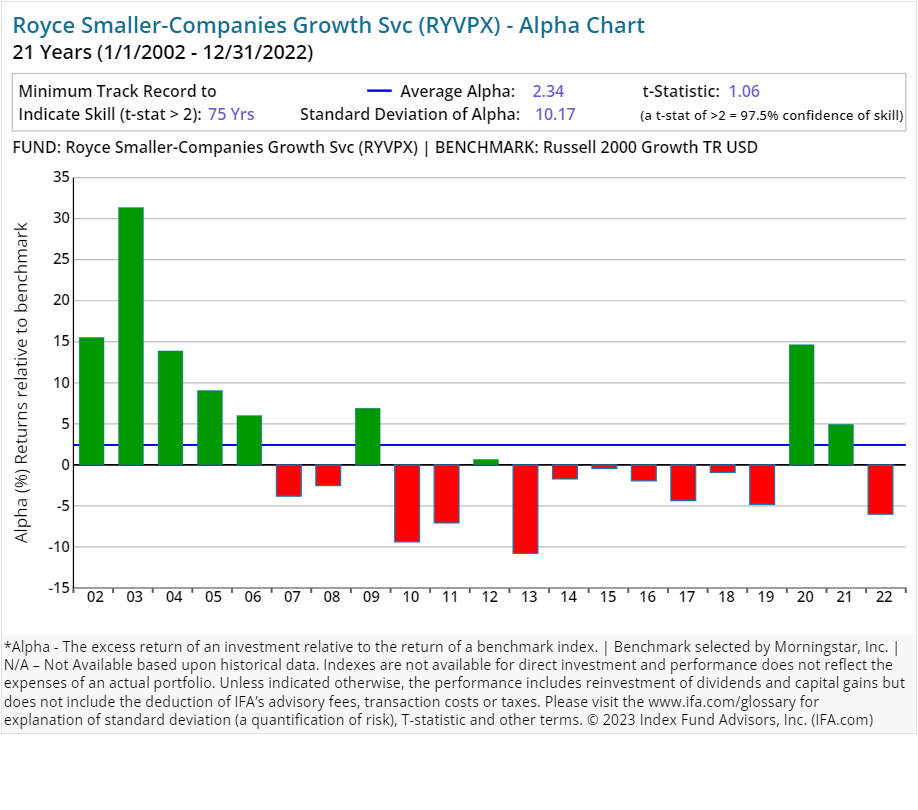
| Royce Smaller-Companies Growth Svc | RYVPX | 65.00 | 1.49 | 0.25 | US Equity Small Cap |
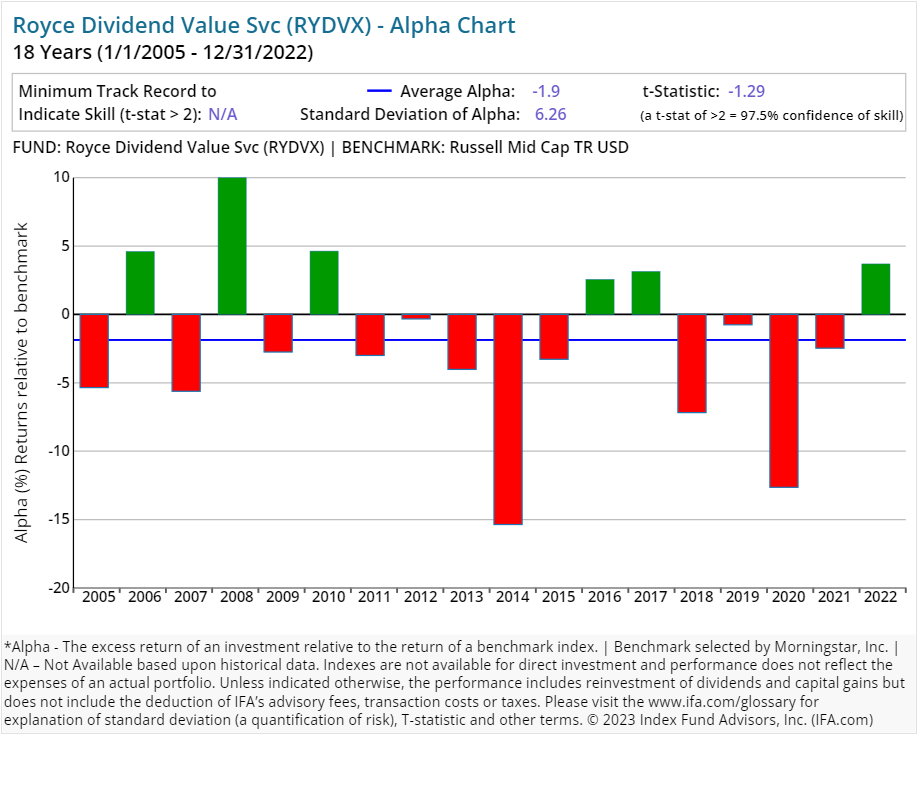
| Royce Dividend Value Svc | RYDVX | 14.00 | 1.34 | 0.25 | US Equity Mid Cap |
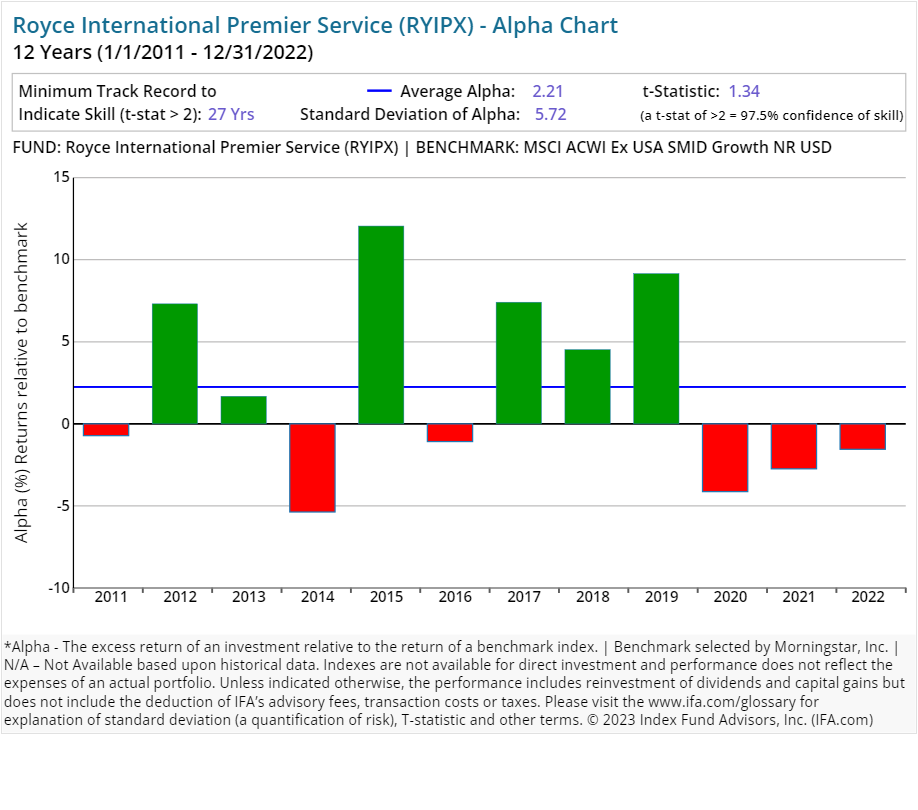
| Royce International Premier Service | RYIPX | 36.00 | 1.44 | 0.25 | Global Equity Mid/Small Cap |
Please read the prospectus carefully to review the investment objectives, risks, charges and expenses of the mutual funds before investing. Royce mutual fund prospectuses are available at https://www.royceinvest.com/funds/literature
On average, an investor who utilized a surviving active equity mutual fund strategy from Royce experienced a 1.28% expense ratio. These expenses can have a substantial impact on an investor's overall accumulated wealth if they are not backed by superior performance. The average turnover ratio for surviving active equity strategies from Royce was 35.1%. This implies an average holding period of 34.19 months.
In contrast, most index funds have very long holding periods — decades, in fact, thus deafening themselves to the random noise that accompanies short-term market movements, and focusing instead on the long-term. Again, turnover is a cost that is not itemized to the investor but is definitely embedded in the overall performance.
Performance Analysis
The next question we address is whether investors can expect superior performance in exchange for the higher costs associated with Royce's implementation of active management. We compare all of its 32 strategies, which includes both current funds and funds no longer in existence, against its Morningstar assigned benchmark to see just how well each has delivered on their perceived value proposition.
This analysis includes the performance of both surviving and non-surviving funds to account for survivorship bias. Non-surviving funds, such as those that were closed, merged, or liquidated, are included in the aggregate performance calculations based on their historical returns up to the date they ceased to exist. This approach ensures a more comprehensive and accurate representation of overall performance but may not fully reflect the experience of individual investors due to timing and other factors.
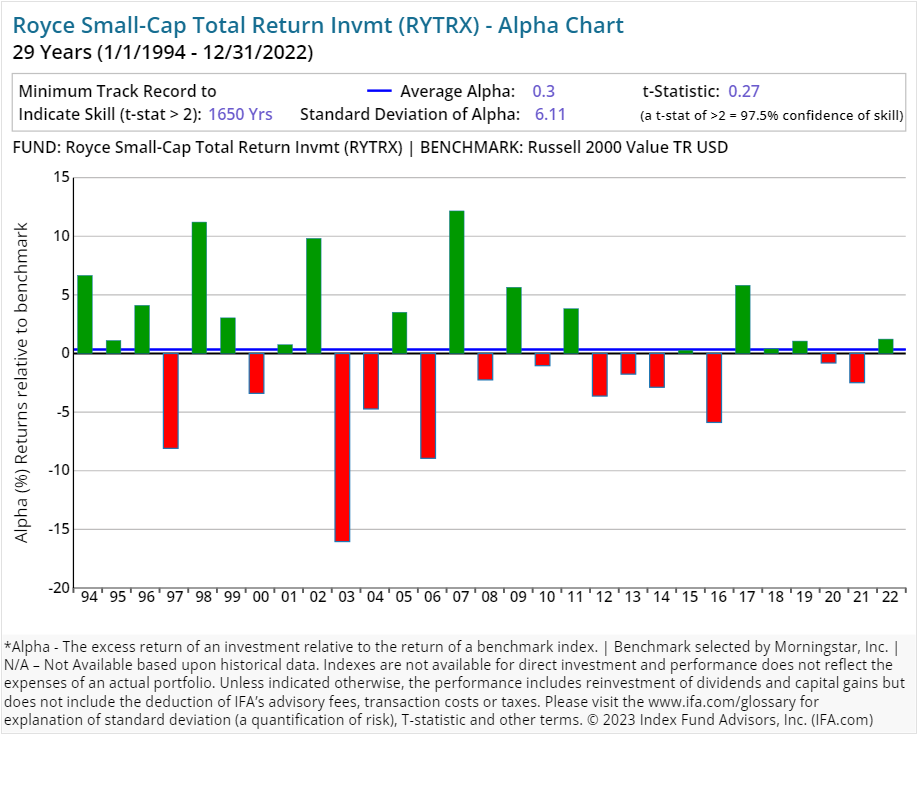
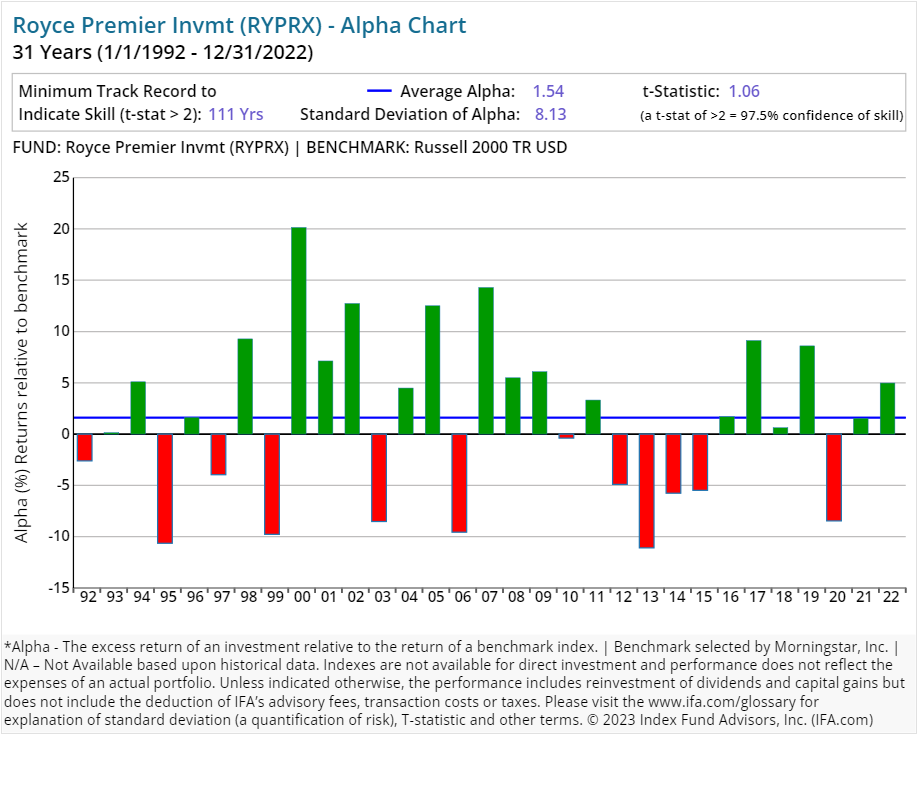
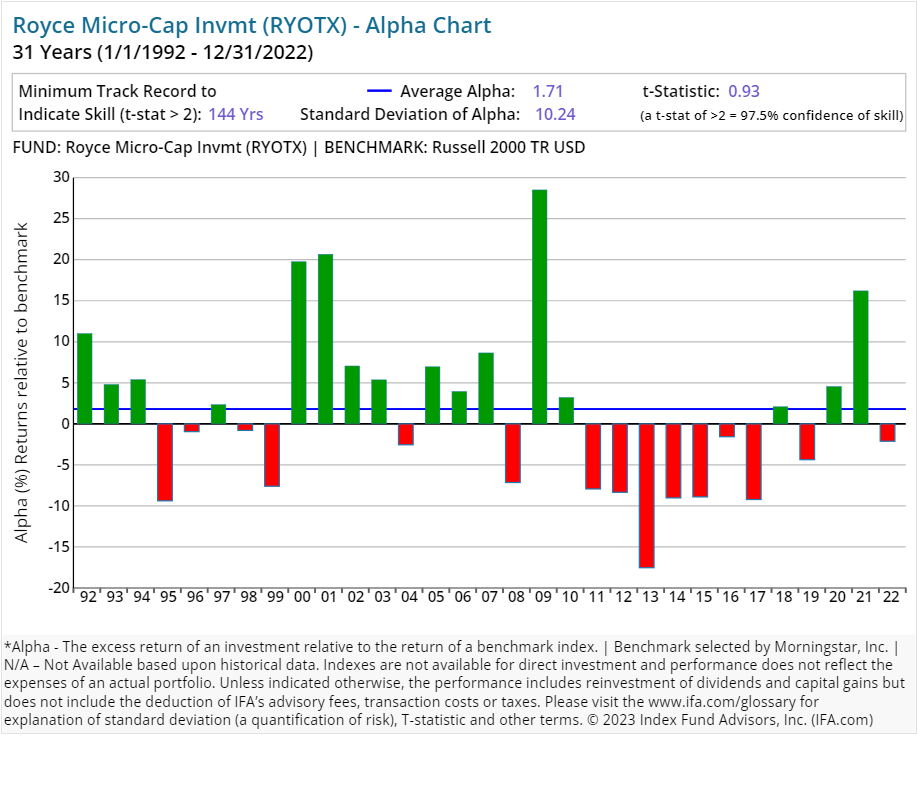
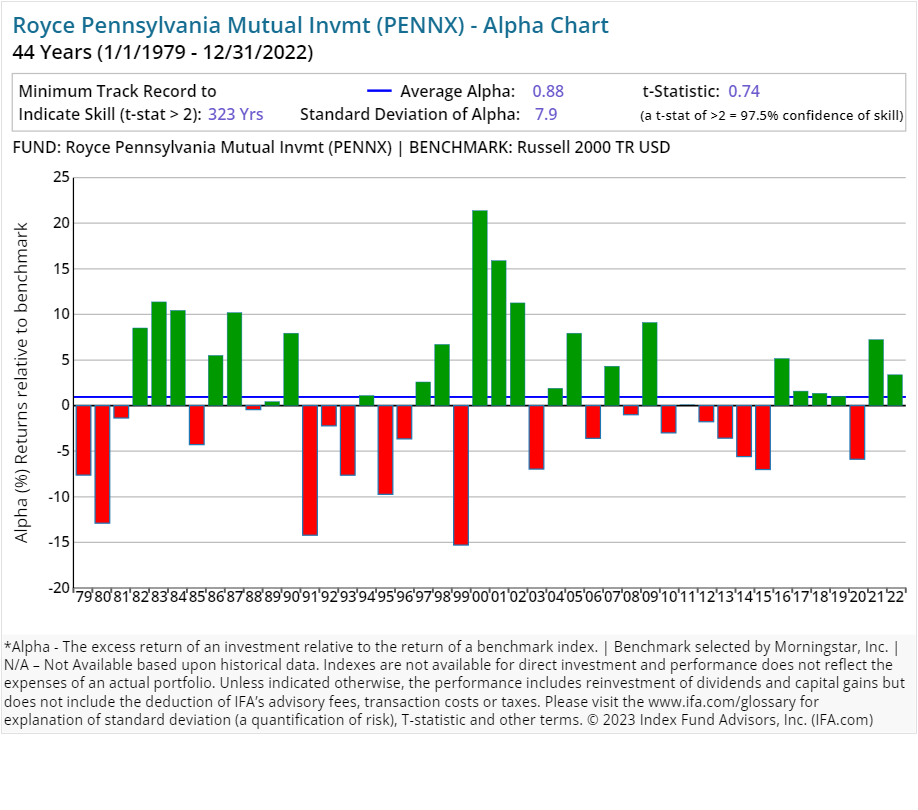
We have included alpha charts for each of their current strategies at the bottom of this article. Here is what we found:
-
75.00% (24 of 32 funds) have underperformed their respective benchmarks or did not survive the period since inception.
-
25.00% (8 of 32 funds) have outperformed their respective benchmarks since inception, having delivered a POSITIVE alpha.
Here's the real kicker, however:
- 0% (0 of 32 funds) wound up outperforming their respective benchmarks consistently enough since inception to provide 97.5% confidence that such outperformance would persist (as opposed to being based on random outcomes).
As a result, this study shows that a majority of funds offered by Royce have not outperformed their Morningstar-assigned benchmark. The inclusion of the statistical significance of alpha is key to this exercise, as it indicates which outcomes are due to a skill that is likely to repeat and those that are more likely due to a random-chance outcome.
Regression Analysis
How we define or choose a benchmark is extremely important. If we relied solely on commercial indexes assigned by Morningstar, then we may form a false conclusion that Royce has the "secret sauce" as active managers.
Since Morningstar is limited in terms of trying to fit the best commercial benchmark with each fund in existence, there is of course going to be some error in terms of matching up proper characteristics such as average market capitalization or average price-to-earnings ratio.
A better way of controlling these possible discrepancies is to run multiple regressions where we account for the known dimensions of expected return in the U.S. — i.e., market risk, size and relative price — as identified by the Fama/French Three-Factor Model.
For example, if we were to look at all of the U.S.-based strategies from Royce that've been around for the past 10 years, we could run multiple regressions to see what each fund's alpha looks like once we control for the multiple betas that are being systematically priced into the overall market.
The chart below displays the average alpha and standard deviation of that alpha for the past 10 years through 2024. Screening criteria include funds with holdings of 90% or greater in U.S. equities and uses the oldest available share classes.
As shown above, none of the mutual funds studied had a positive excess return over the stated benchmarks. Likewise, none of the equity funds reviewed produced a statistically significant level of alpha, based on a t-stat of 2.0 or greater. (For a review of how to calculate a fund's t-stat, see the section of this study that follows the individual Royce alpha charts.)
Why is this important? It means that if we wanted to simply replicate the factor risk exposures of these Royce funds with indexes of the factors, we could blend the indexes and capture similar returns.
Conclusion
Like many of the other large active managers, a deep analysis into the performance of Royce has yielded a not so surprising result: Active management is likely to fail many investors. This is due to market efficiency, costs and increased competition in the financial services sector.
As we always like to remind investors, a more reliable investment strategy for capturing the returns of global markets is to buy, hold and rebalance a globally diversified portfolio of index funds.
Below are the individual alpha charts for the existing Royce actively managed mutual funds that have five years or more of a track record.
Here is a calculator to determine the t-stat. Don't trust an alpha or average return without one.
The Figure below shows the formula to calculate the number of years needed for a t-stat of 2. We first determine the excess return over a benchmark (the alpha) then determine the regularity of the excess returns by calculating the standard deviation of those returns. Based on these two numbers, we can then calculate how many years we need (sample size) to support the manager's claim of skill.
This is not to be construed as an offer, solicitation, recommendation, or endorsement of any particular security, product or service. There is no guarantee investment strategies will be successful. Investing involves risks, including possible loss of principal. Performance may contain both live and back-tested data. Data is provided for illustrative purposes only, it does not represent actual performance of any client portfolio or account and it should not be interpreted as an indication of such performance. IFA Index Portfolios are recommended based on time horizon and risk tolerance. For more information about Index Fund Advisors, Inc, please review our brochure at https://www.adviserinfo.sec.gov/ or visit www.ifa.com.

