Fads come and go. In the increasingly complex and convoluted world of passive investing, a debate some fund providers like to throw out is a concept known as "fundamental indexing."
Under this guise, the industry's standard-bearer of weighting a benchmark's stocks based on market capitalization might be seen as an old fogey.
Proponents of fundamental indexing use what they call the "noisy market hypothesis" as their justification. Specifically, since the market is not populated by ultra-rational wealth-maximizing automatons — but rather by human beings who are subject to behavioral pitfalls — the market will overprice some securities while underpricing others.
Of course, such a hypothesis is speculative in nature. In fact, we have no sure way of knowing if a security is "overpriced" or "underpriced" since this type of soothsaying is based on subjective rather than objective readings of market structures.
Still, trend-following enthusiasts of fundamental indexing argue that breaking any link between price capitalization and weighting minimizes any potential issue (whether real or imagined) of being overweight in overvalued stocks while being underweight in undervalued stocks. The term "smart beta" has been used in conjunction with this approach.
'Flawed Indexing'
The fallacy of this argument has been attacked by many learned academics, including Andre Perold. In particular, his analysis (first published in 2007) still captures the essence of this issue so many years later. Working as a professor at Harvard Business School at the time, his research piece was titled, "Fundamentally Flawed Indexing."
The argument can be analogized as follows. Suppose that you are shopping in a jewelry store and see two different one-carat diamonds. One sells for $1,000 and the other for $1,500. As far as you're concerned, both look the same. Let's say the jeweler then informs you that he underpriced one and overpriced the other.
Based on intuition, you immediately decide that the $1,500 diamond is the overpriced one and the $1,000 piece is the underpriced product. However, a few moments of reflection would lead you to the conclusion that there is an equal probability (50%) that the $1,500 diamond is the underpriced one.
Since you're not a gemologist, you have no good way of knowing. Investors (and fund managers) who believe that higher-priced companies have a higher probability of being "overpriced" are making the same mistake.
While IFA's Investment Committee disagrees with the underlying argument of fundamental indexing, we can't ignore the fact that it leads to portfolios that are similar to our own in that these are tilted to small-cap and value stocks.
As a result, one other aspect of fundamental indexing that deserves a second look is the possible tilting towards more profitable companies, which is now a recognized dimension of expected returns.
The Underlying Strategy
A top provider of fundamental index data is Rob Arnott's Research Affiliates (RAFI). One of the earliest fund families to implement such a benchmarking methodology was PowerShares, which wound up being swallowed by asset manager Invesco. In any case, these now-labeled Invesco exchange-traded funds have been using RAFI indexes going back to 2006.
The four factors used by RAFI for weighing the stocks used in its indexes are: sales, cash flow, dividends and book value. The first two factors may result in a tilt towards more profitable companies. But our own research leads us to conclude that it's important to look at live fund data. This is due to the fact that there are higher trading costs for funds that aren't market-cap weighted.
So, we've decided to put under our research microscope RAFI-weighted equity ETFs that are distributed by fund company Invesco. The key question we're trying to address is whether investors can expect superior performance associated with Invesco's implementation of this type of alternative methodology, which it describes as "dynamic." This is defined as a process designed to take advantage of the benefits of traditional indexing (diversification, high liquidity, lower costs relative to the typical active manager).
Meanwhile, fundamental indexing attempts to avoid any "performance drag," a symptom characterized by Invesco in its fund literature as "inherent" in traditional market capitalization weighted indexes due to an overemphasis on "overvalued" securities and underweighting of "undervalued."
Blurring of the Lines
Given such a context, it should be noted that Arnott and Invesco are also active fund managers. As a result, traditional index investors might take such verbage with a grain of salt. (To find out how the SEC categorizes traditional as opposed to non-traditional indexes, as well as the way in which IFA defines an index fund, please see: "A Blurring of the Lines: What Really is an Index Fund?")
As academic luminaries such as Eugene Fama and Kenneth French have found in the past, stock markets are efficient mechanisms in distributing wealth around the world. Fundamental to any free-market financial system is the creation of a structure in which buyers and sellers can come together to agree on a fair and equitable price for each security. This makes any notion that fund managers can pick and choose what's overvalued or undervalued at any given time a rather speculative trading exercise. Professor Fama, the 2013 Nobel laureate, has observed that "prices reflect all available information so that ... it is basically impossible to beat the market ... because investors are always paying fair prices."
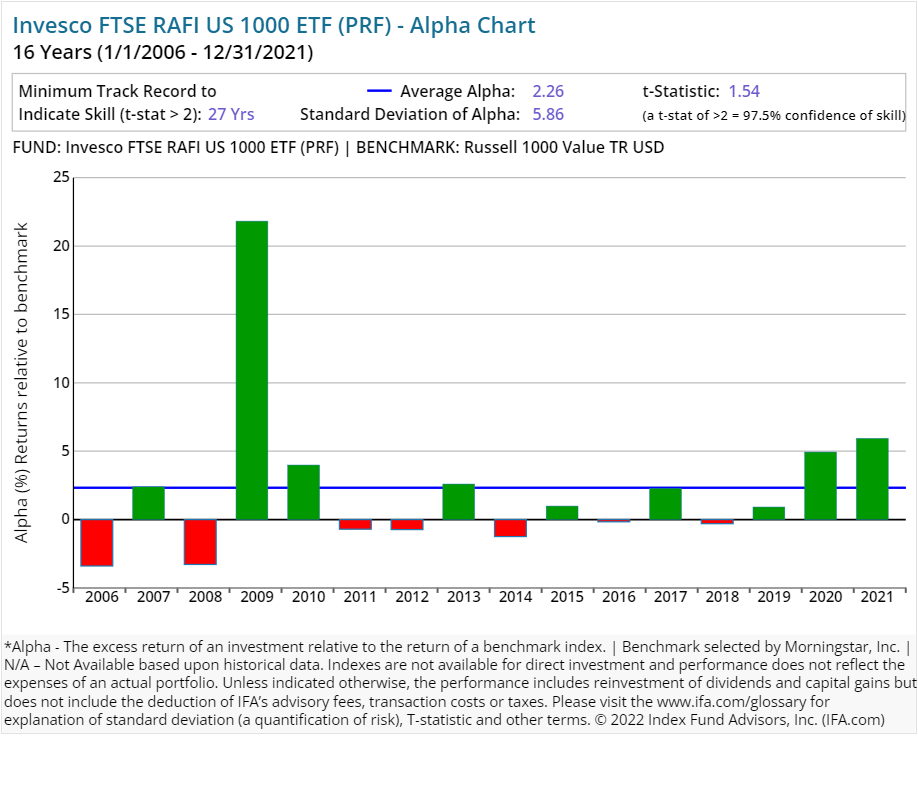
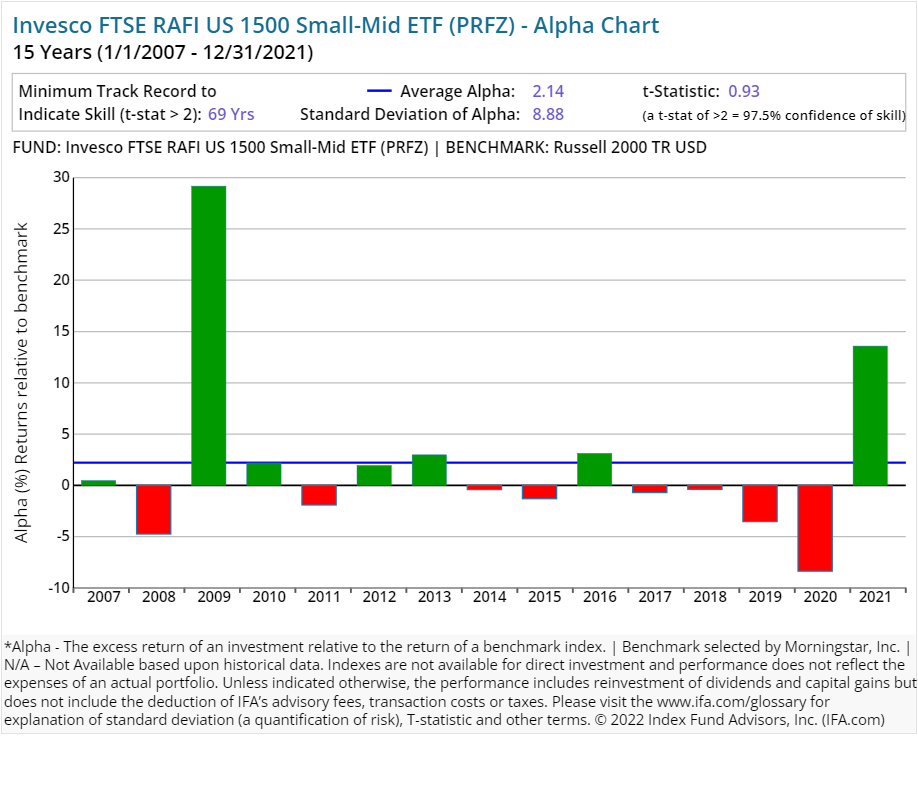
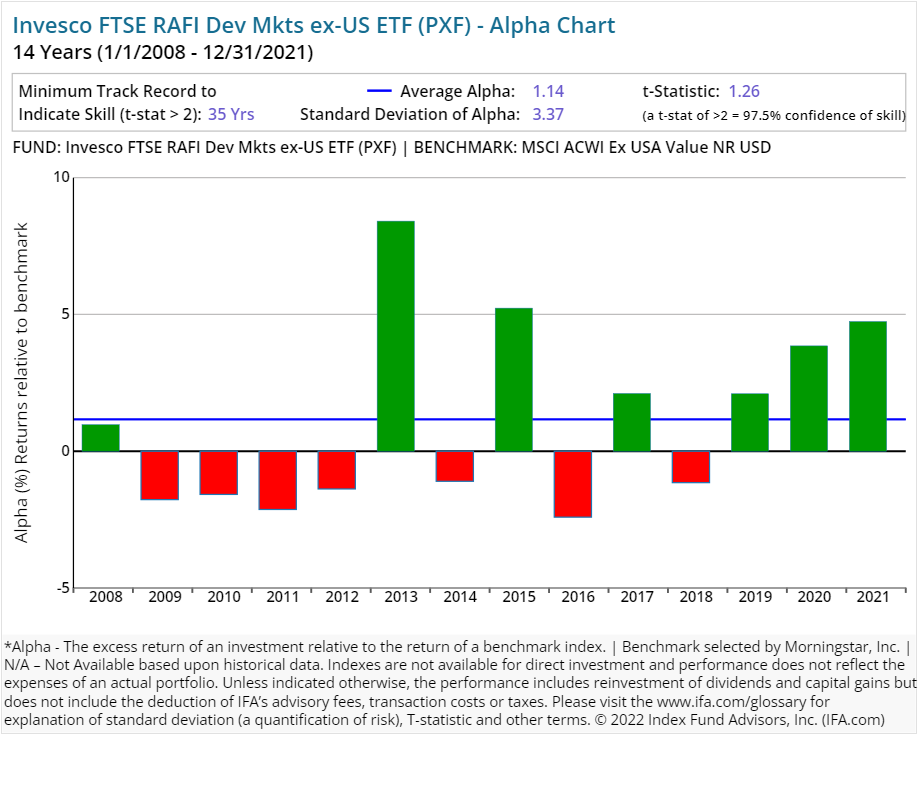
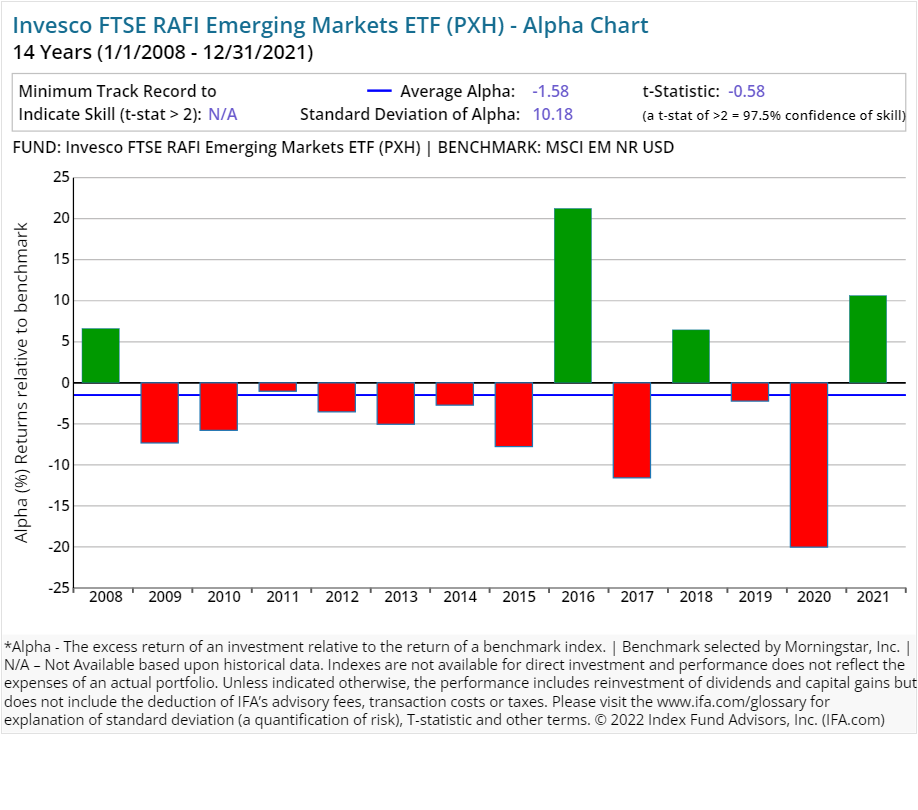
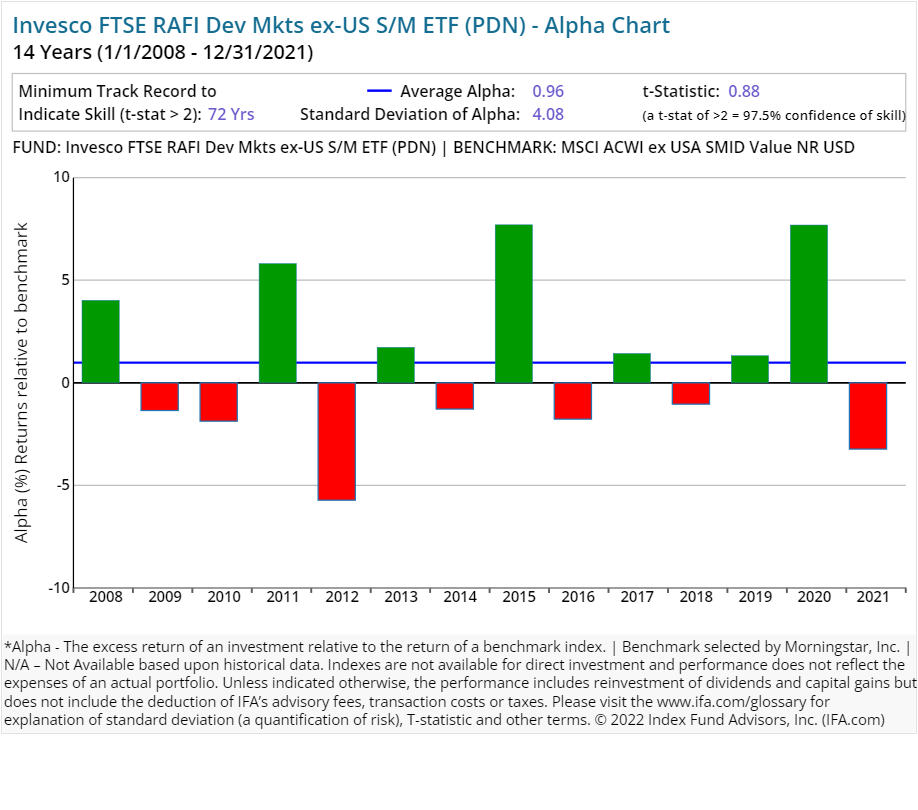
In this review of open-end stock funds using fundamental indexes, we've compared each Invesco RAFI-styled ETF (with a track record of 10 years or more). The following charts illustrate the differences between RAFI funds and corresponding benchmarks focused on similar asset classes.
From afar, the results for these Invesco-based ETFs appear mixed. The international stock funds generated negative-to-middling average alpha in this period studied. At the same time, the firm's RAFI domestic stock ETFs produced positive average alpha. As you can see, however, those results appeared to come in relatively short bursts.
For example, take 2009 out of the RAFI US 1000 ETF's chart and its alpha appears less appealing. Subtract (or reduce) 2021's uptick and those results look even more pedestrian. The case of such a lack of persistence in positive alpha is even starker when oversized bursts of alpha in 2009 and 2021 for the RAFI US 1500 Small-Mid ETF are removed from the longer-term view.
In such an analysis, a lack of consistency by Invesco's RAFI stock ETFs in sustaining outperformance against each fund's respective asset class posed a clear and present danger for investors trying to build wealth over a lifetime. In our experience over the years, investors who rely on trying to pick a "winning" fund at the right time are engaging in a losing proposition.
Although we can't make a definitive statement, our researchers hypothesize that another explanation for any short-term streaks of outstretched alpha by the Invesco RAFI ETFs when compared to respective indexes — particularly in earlier years reviewed — is an increased exposure to high-profitability companies. Of note, IFA's preferred funds provider (Dimensional Fund Advisors) didn't start screening for profitability in its funds until 2012.
Since we're able to now utilize mutual funds and ETFs from Dimensional, Avantis, Vanguard, iShares and others that screen stocks by profitability, our wealth advisors don't have a compelling reason to recommend the use of RAFI funds to their clients.
Here's the real kicker, though: Stepping back and looking over an extended period, none of these alternative indexing ETFs were able to produce performance that could be deemed as statistically significant.
This can be viewed in the alpha charts shown below. The representative calculations were compiled for the RAFI-based equity ETFs with five or more years of a track record and compared to each fund's Morningstar assigned benchmark. At IFA, we focus on the t-stat and look for a t-stat greater than 2. We have not seen any yet. (A review of how to calculate a fund's t-stat can be found at the end of this report — right after the presentations of all Invesco RAFI funds' individual alpha charts included in this study.)
Here is a calculator to determine the t-stat. Don't trust an alpha or average return without one.
The Figure below shows the formula to calculate the number of years needed for a t-stat of 2. We first determine the excess return over a benchmark (the alpha) then determine the regularity of the excess returns by calculating the standard deviation of those returns. Based on these two numbers, we can then calculate how many years we need (sample size) to support the manager's claim of skill.
This is not to be construed as an offer, solicitation, recommendation, or endorsement of any particular security, product or service. There is no guarantee investment strategies will be successful. Investing involves risks, including possible loss of principal. Performance may contain both live and back-tested data. Data is provided for illustrative purposes only, it does not represent actual performance of any client portfolio or account and it should not be interpreted as an indication of such performance. IFA Index Portfolios are recommended based on time horizon and risk tolerance. Take the IFA Risk Capacity Survey (www.ifa.com/survey) to determine which portfolio captures the right mix of stock and bond funds best suited to you. For more information about Index Fund Advisors, Inc, please review our brochure at https://www.adviserinfo.sec.gov/ or visit www.ifa.com.

