It's only natural to feel a bit anxious when stock markets start to fall.
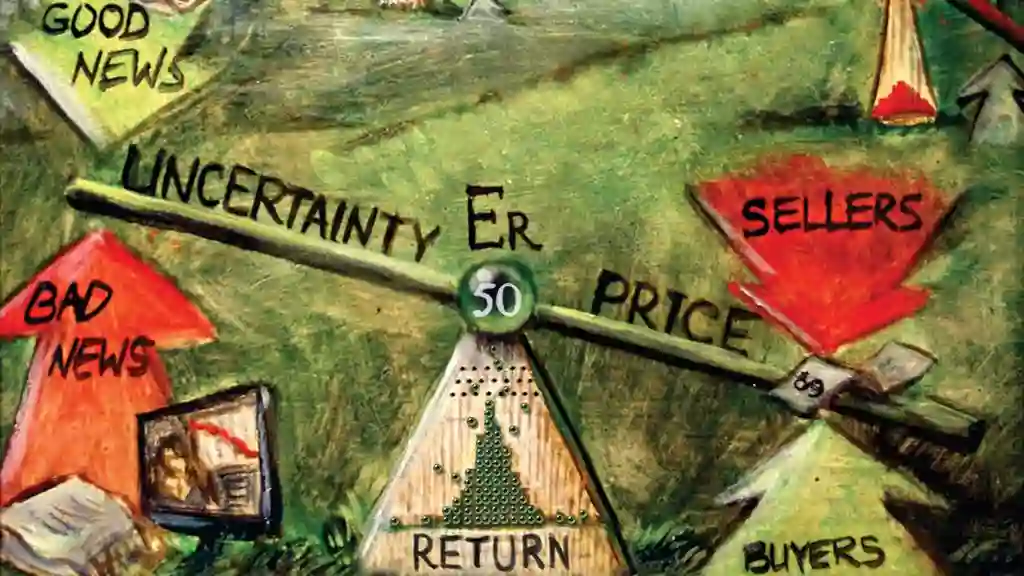
Behavioral finance research indicates that some investors may react to short-term losses by projecting these patterns forward, potentially leading to decisions influenced more by emotion than strategy. And if market turbulence intensifies, so can such emotional responses, especially when price fluctuations extend past one or two sessions.
How often does that really happen, though? Taking a step back and looking over a longer timeframe, it becomes evident that investors shouldn't be surprised by multitudes of short-term periods in which prices temporarily drop.
Let's consider an extended period of the Russell 3000 index's daily returns. It's an all-cap benchmark that tracks 98% of the U.S. stock market. Notice in the chart below, this 'total stock market index' generated positive returns in 38 out of 46 years (through 2024).
Such positive results took place despite a daily roller coaster effect in stock prices. So how much fluctuation actually happened during these years? The chart's major highlights include:
-
Intra-year declines for the index ranged from 3% to 48%.
-
Calendar-year returns improved on those spurts in volatility. While the steepest declines have historically been followed by recoveries, these patterns are subject to market conditions and may not be consistent across all periods.
-
During the financial crisis in 2009, an intra-year drop of 27% was a head fake to traders as stocks wound up gaining 28% at year's end. We saw a similar intra-year drop in 2020 of 35% during covid-19 which in turn ended the year up 21%.
-
A $10,000 investment grew to $1,939,168 over the 46 year time period, if dividends were reinvested and no fees or taxes were considered, would have grown significantly. However, this data is reflective of past market trends and does not guarantee future results.
The takeaway here is clear: Volatility shouldn't be considered as an anomaly. Still, it's only natural to become uneasy — even worried — about your long-term financial security during bouts of extreme market volatility. While such emotions can't be totally ignored, focusing on facts and self-education can go a long way towards developing a lasting and rational investment strategy.
Sorting through all of the historical data is one challenge. Putting such information into a practical perspective to help construct a well-thought out portfolio strategy is another.
IFA's Risk Capacity Survey is available online to help investors evaluate the level of portfolio risk appropriate for their unique financial circumstances. It's designed to measure how much portfolio risk is appropriate in an investor's portfolio at any given time. The RCS is available onliine to everyone, whether you're a novice at investing or more experienced at dealing with portfolio asset-allocation issues.
"This article is intended for informational purposes only and should not be construed as an offer, solicitation, recommendation, or endorsement of any particular security, product, or service, nor as tax advice. Investing involves risks, including the potential loss of principal, and past performance is not indicative of future results. Historical data presented, such as growth projections or market recoveries, should be considered hypothetical and may include assumptions, such as reinvestment of dividends, that do not account for fees, taxes, or individual circumstances.
IFA's proprietary Risk Capacity Survey is designed to help assess an investor's risk tolerance and guide portfolio asset allocation decisions. While it provides valuable insights, portfolio alignment based on the survey does not guarantee specific investment outcomes, mitigation of market risk, or financial security. Investors should consider using the survey as one of several tools in their decision-making process and consult with their financial adviser for personalized guidance.
For more information about Index Fund Advisors, Inc., please review our brochure at https://www.adviserinfo.sec.gov/ or visit www.ifa.com.


