As Warren Buffett has often observed about investing, blue chip companies with established brand recognition hold a special competitive advantage in attracting U.S. investment dollars.
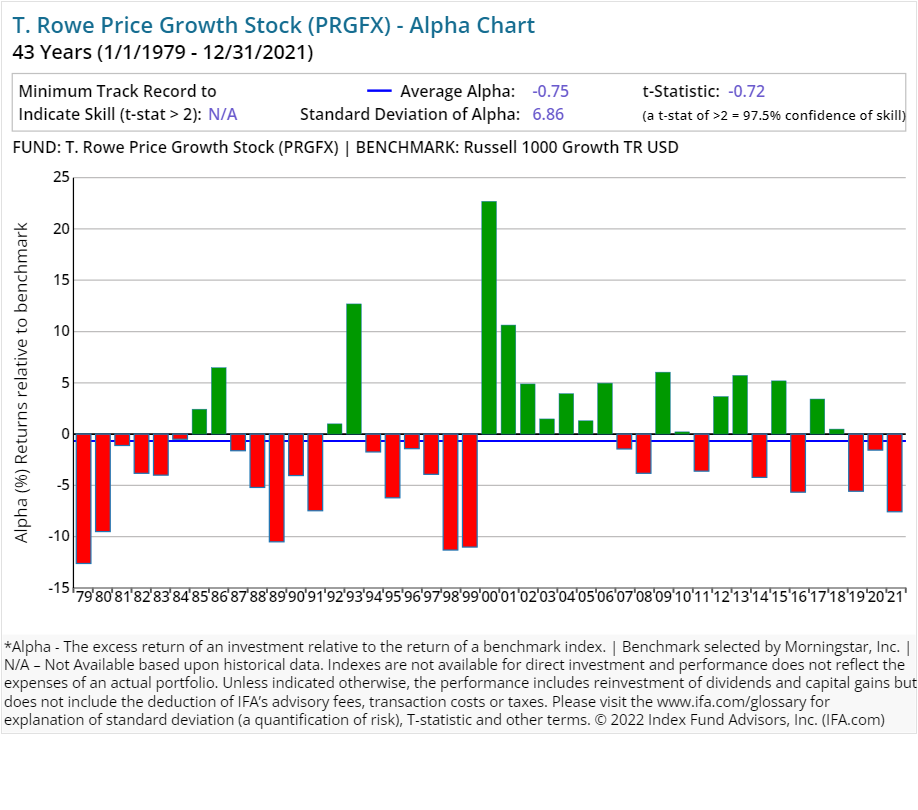
Along those lines, venerable fund company T. Rowe Price has built a notable name for itself as an active fund manager. The Baltimore-based investment manager gained early recognition based on its namesake founder's penchant for actively investing in growth-styled stocks. A former broker and stock analyst, T. Rowe Price Jr., started his own firm in 1937 by focusing on serving wealthy families and their business associates. In 1950, the investment manager expanded by launching its first mutual fund for mass consumption, the T. Rowe Price Growth Stock Fund (PRGFX).
It now operates in over 50 different countries spanning four continents. As of December 31, 2024, the funds provider's assets under management (AUM) surpassed $1.61 trillion. Meanwhile, independent funds researcher Morningstar estimated the firm's managed assets remained heavily skewed to equities (51%) and multi-asset/balanced funds (34%), money market funds (12%), and alternative offerings (3%) which included target-date retirement funds and other specific risk-based strategies.1
A lot of investors probably recognize the publicly traded asset manager (TROW) as a leading player in the U.S. retirement plans marketplace. The company generates "a significant portion (slightly more than two thirds) of its AUM from defined contribution retirement assets" — such as 401(k) and 403(b) workplace savings plans, according to Morninstar. It also derives much of its asset growth through sales of deferred annuities and other direct-to-consumer retail oriented financial services products.
Whether catering to individuals, retirement plan sponsors or institutional investors, T. Rowe Price is considered by many industry analysts as building a relatively "sticky" asset base among active fund investors. Some of this is credited to its strength in penetrating America's retirement market. Morningstar's researchers, though, show the company's track record of generating peer-beating returns has waned over the last 5 years due in part to net outflows as investment performance continues to underwhelm, notes veteran Morningstar strategist Greggory Warren.2
Still, even Morningstar — which generally rates T. Rowe Price's funds family fairly highly — admits that such a long-term history of outperformance wanes when its actively managed funds are compared to passively managed rivals. That measurement of active versus passive, as opposed to focusing just on how managers are doing against their peers, is "a higher hurdle" for T. Rowe Price to climb, notes Warren.
Indeed, academic luminaries such as Eugene Fama and Kenneth French have documented how active management on the whole has failed to serve as a panacea for investors paying up to generate index-beating results. (A favorite of IFA's on this topic is a piece by analyst Brad Steiman of Dimensional Fund Advisors titled "Paradox of Skill.")
While we recognize T. Rowe Price's historic marketing prowess, IFA's investment committee views the company's claims of past outperformance by its fund managers against their active competitors as a relatively low bar to set. More to the point: How do T. Rowe Price's active strategies fare when compared to each fund's respective index?
Another prime example of active management's history of empty promises is our "Deeper Look" research series. In this installment, we've put under our microscope the active mutual fund strategies run by T. Rowe Price.
Controlling for Survivorship Bias
It's important for investors to understand the idea of survivorship bias. While there are 96 active mutual funds that are currently offered by this asset management firm, it doesn't necessarily mean these are the only strategies this company has ever managed. In fact, there are 24 mutual funds that no longer exist. This can be for a variety of reasons including poor performance or the fact that they were merged with another fund. We will show what their aggregate performance looks like shortly.
Fees & Expenses
Let's first examine the costs associated with T. Rowe Price's surviving 96 strategies. It should go without saying that if investors are paying a premium for investment "expertise," then they should be receiving above average results consistently over time. The alternative would be to simply accept a market's return, less a significantly lower fee, via an index fund.
The costs we examine include expense ratios, front end (A), deferred (B) and level (C) loads, as well as 12b-1 fees. These are considered the "hard" costs that investors incur. Prospectuses, however, do not reflect the trading costs associated with mutual funds.
Commissions and market impact costs are real expenses associated with implementing a particular investment strategy and can vary depending on the frequency and size of the trades executed by portfolio managers.
We can estimate the costs associated with an investment strategy by looking at its annual turnover ratio. For example, a turnover ratio of 100% means that the portfolio manager turns over the entire portfolio in one year. This is considered an active approach and investors holding these funds in taxable accounts will likely incur a higher exposure to tax liabilities, such as short- and long-term capital gains distributions, than those incurred by passively managed funds.
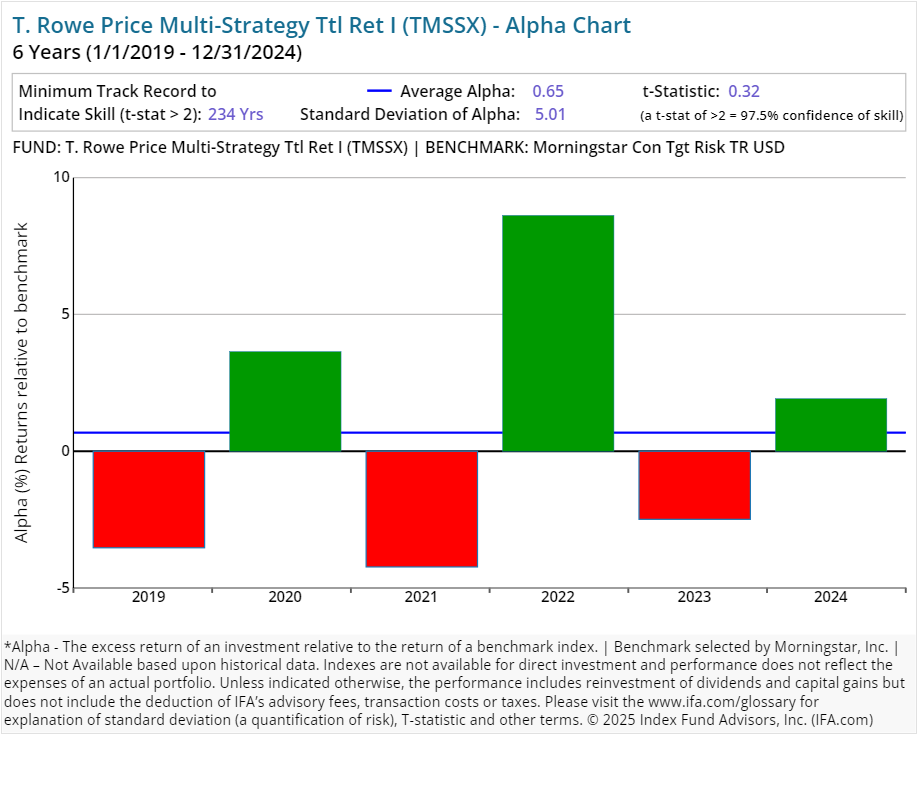
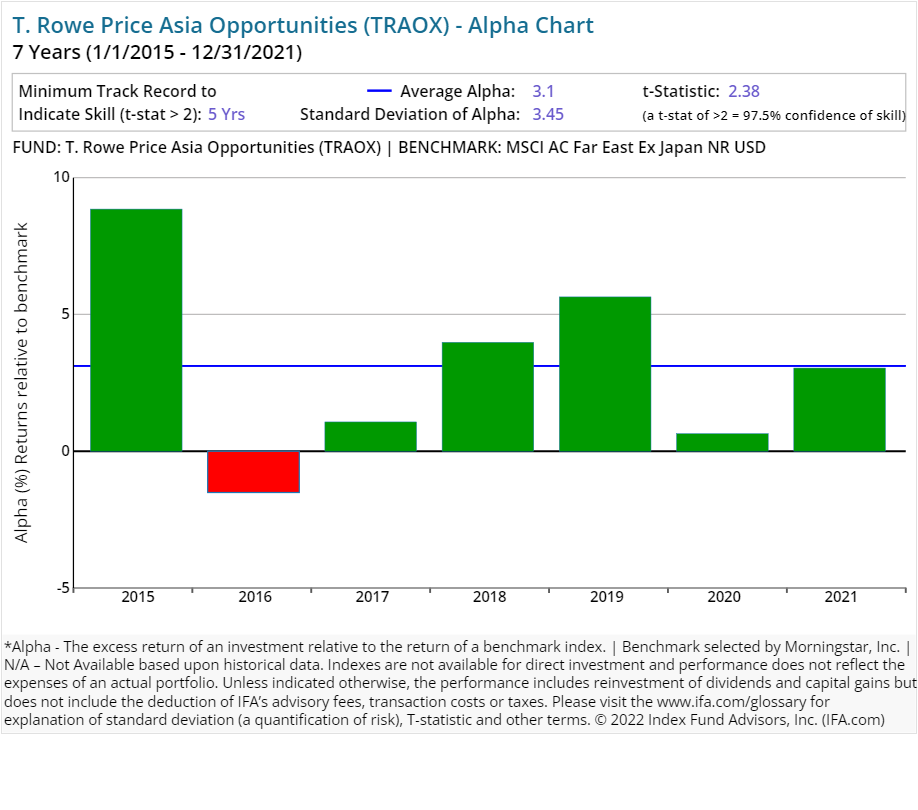
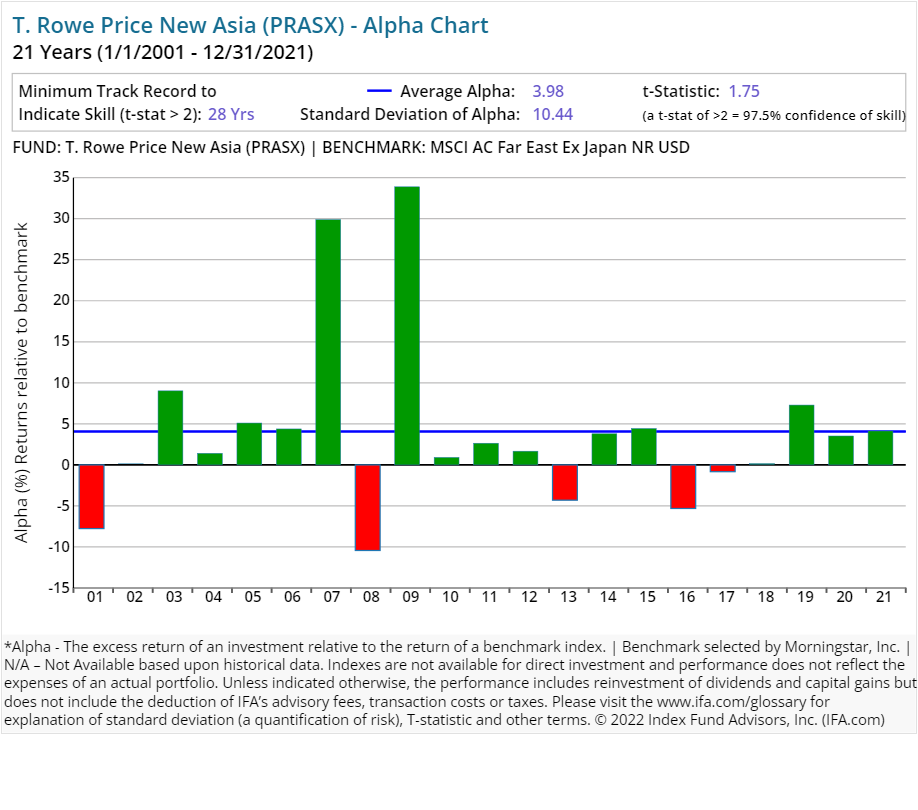
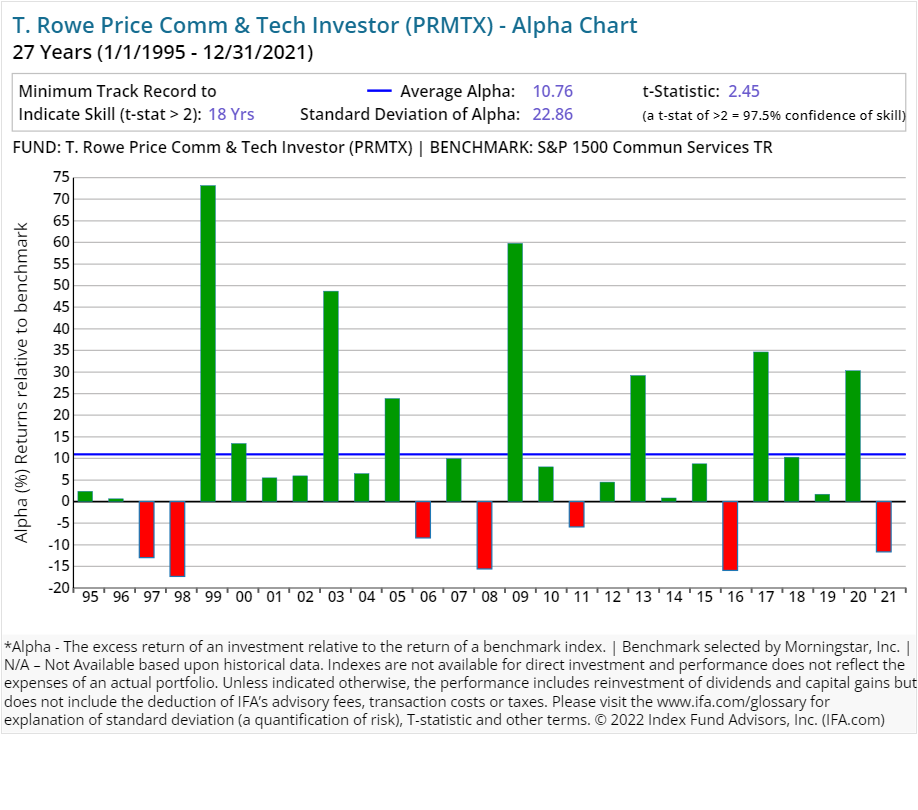
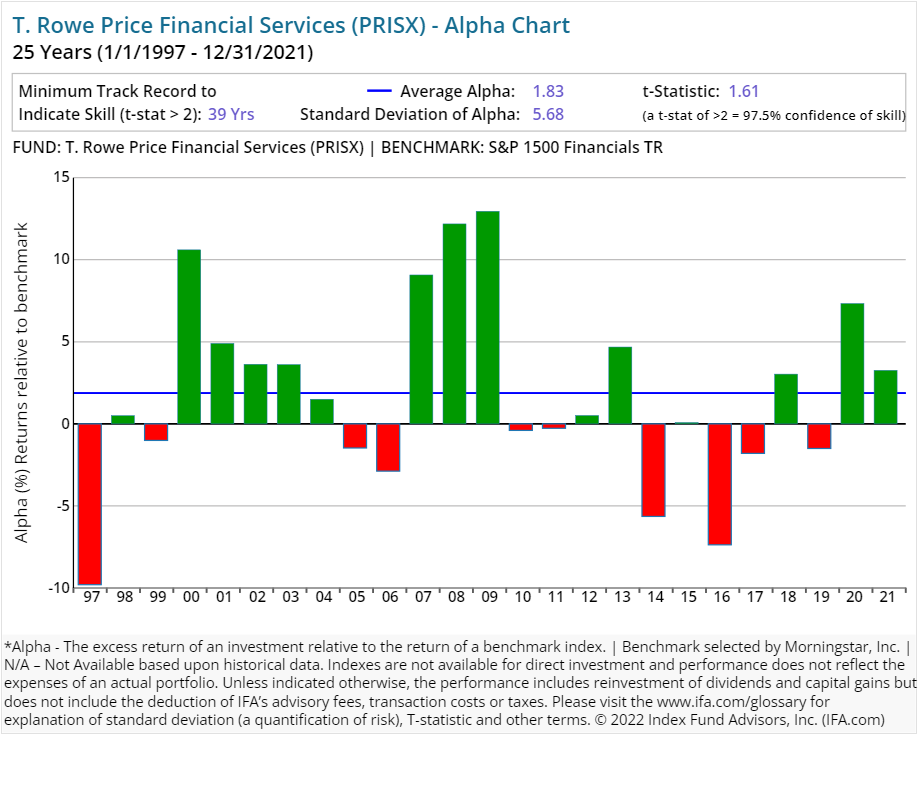
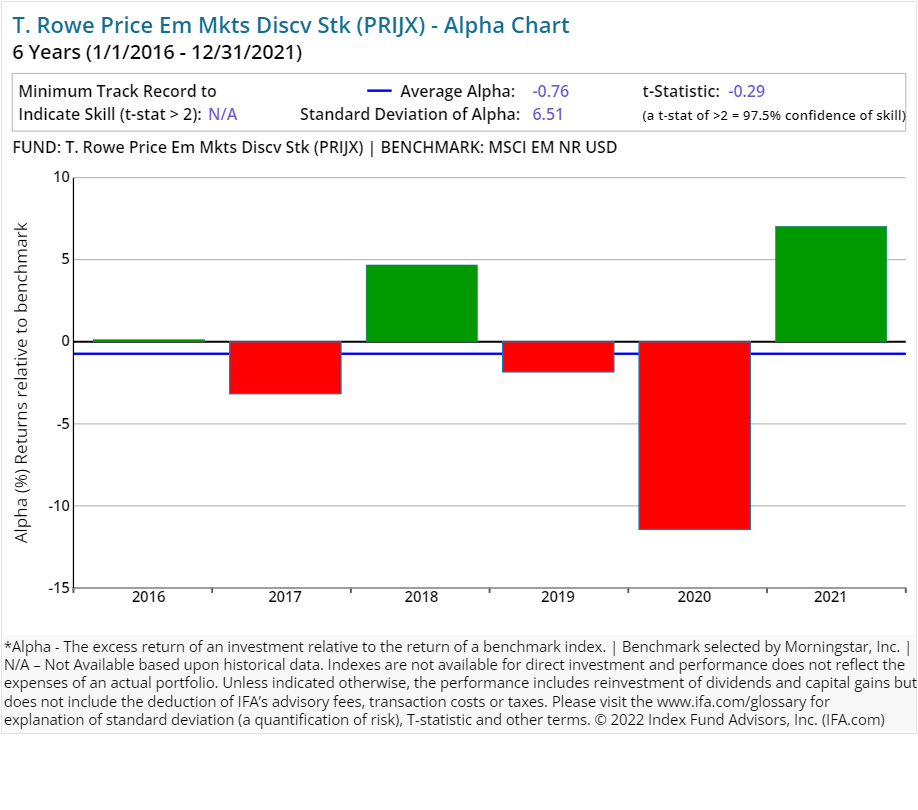
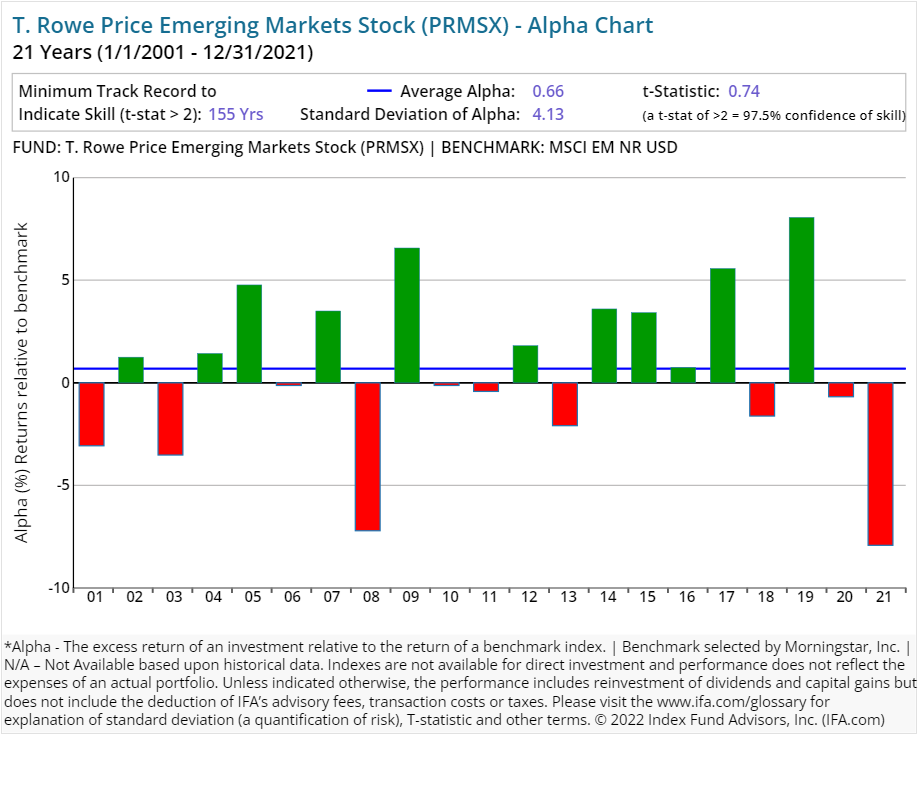
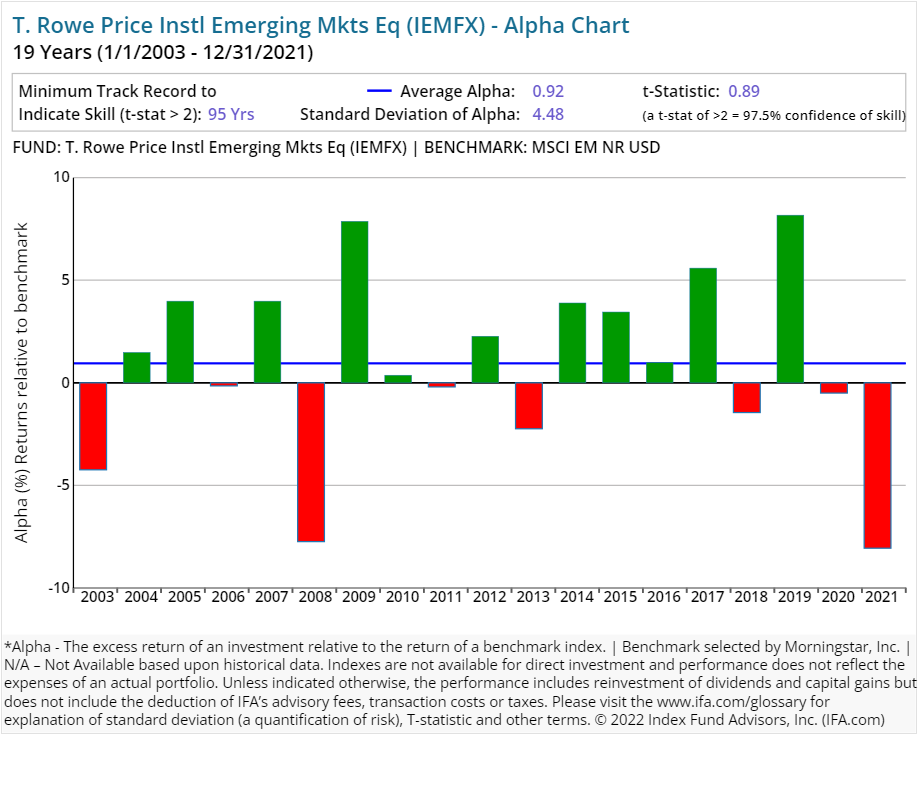
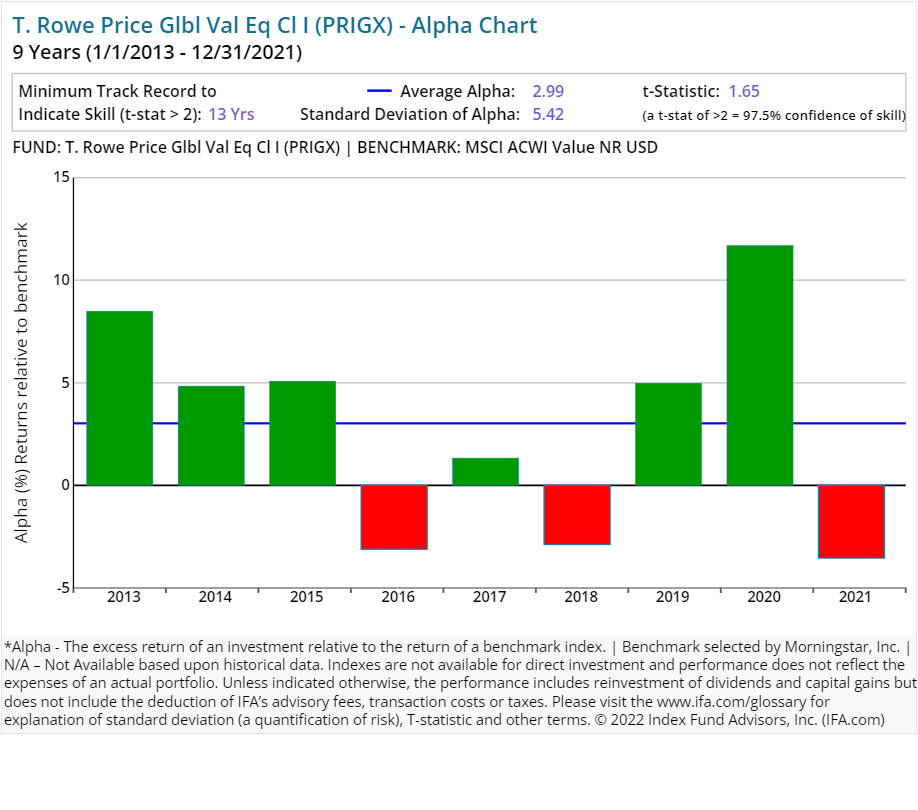
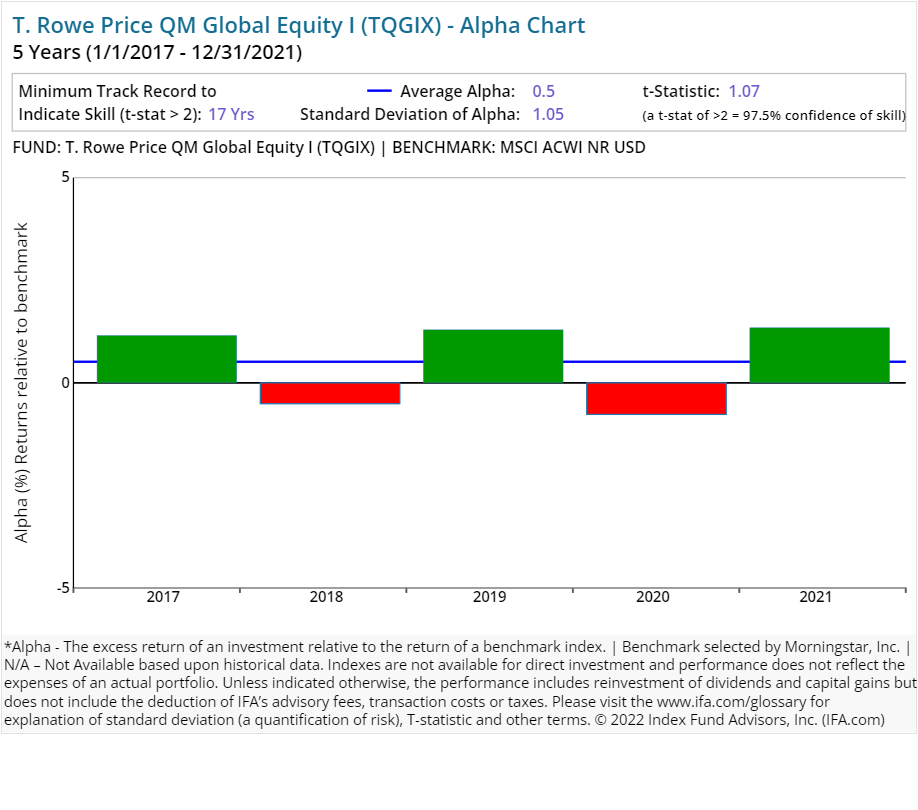
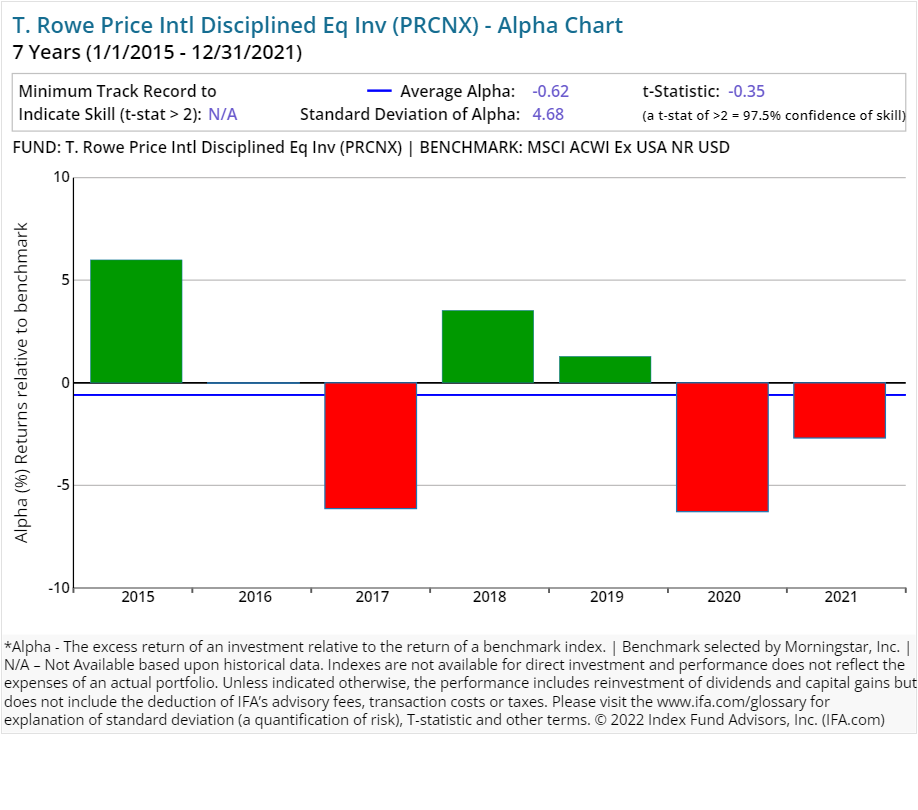
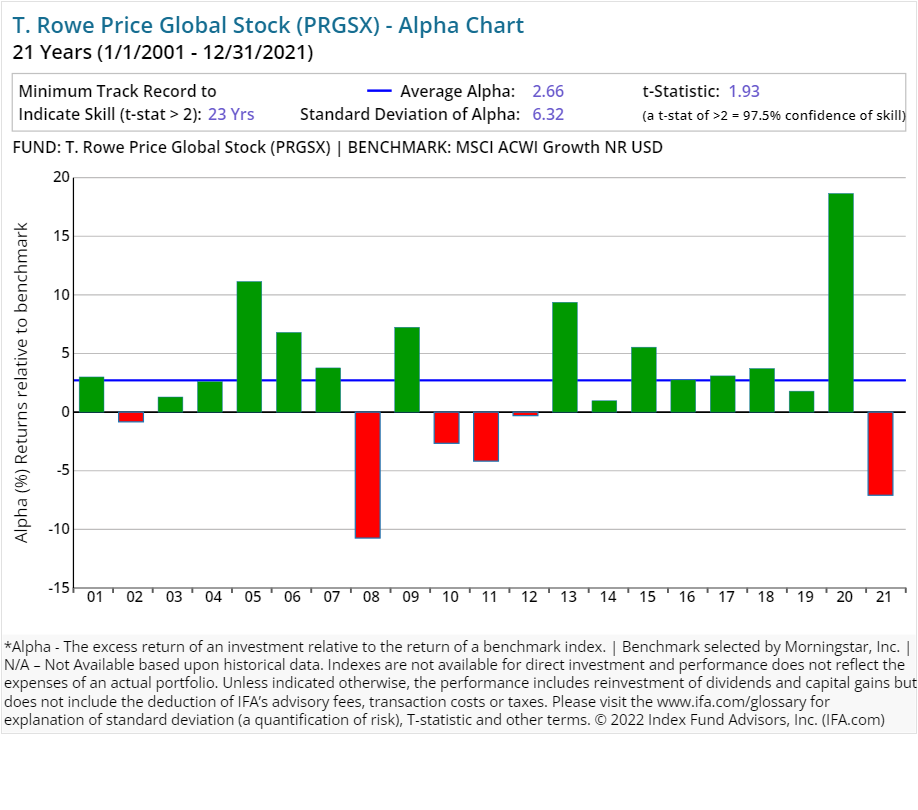
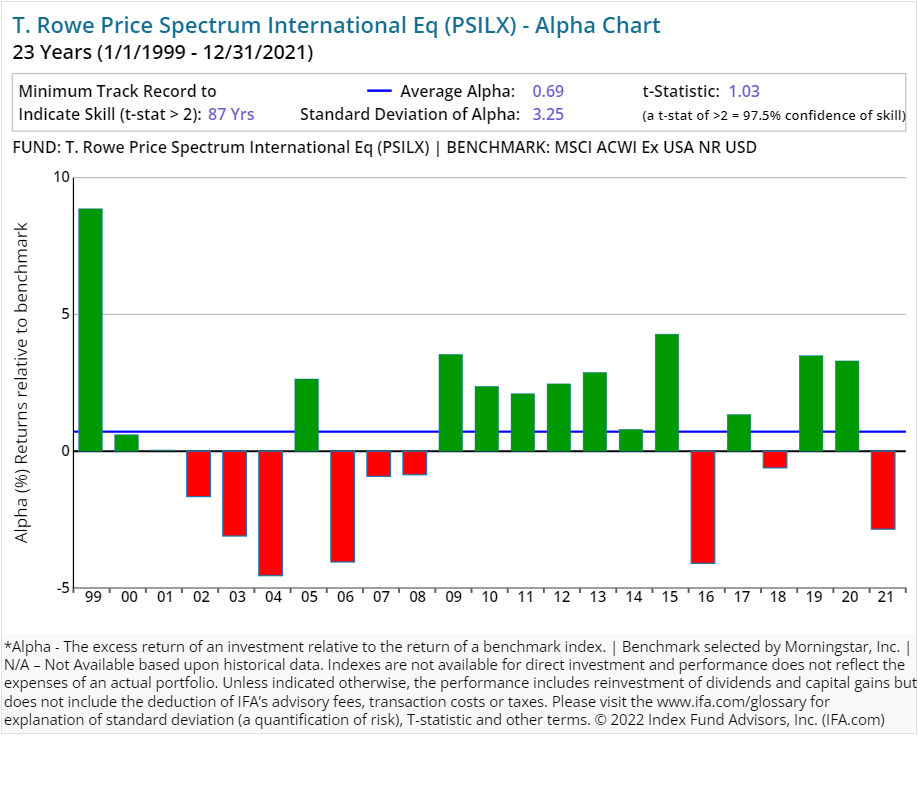
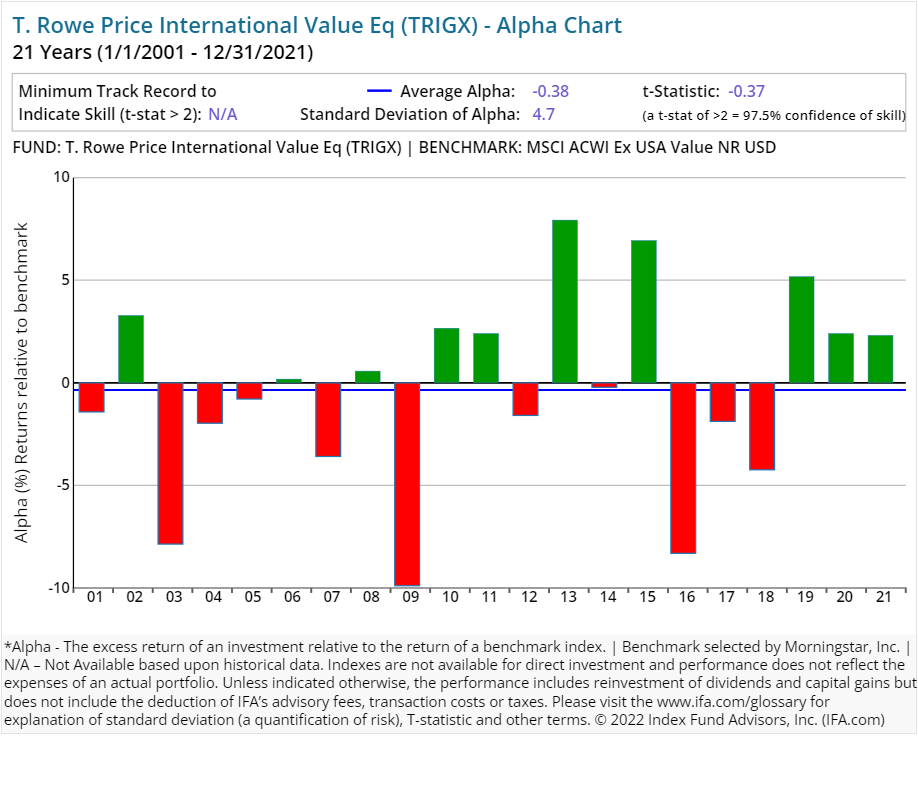
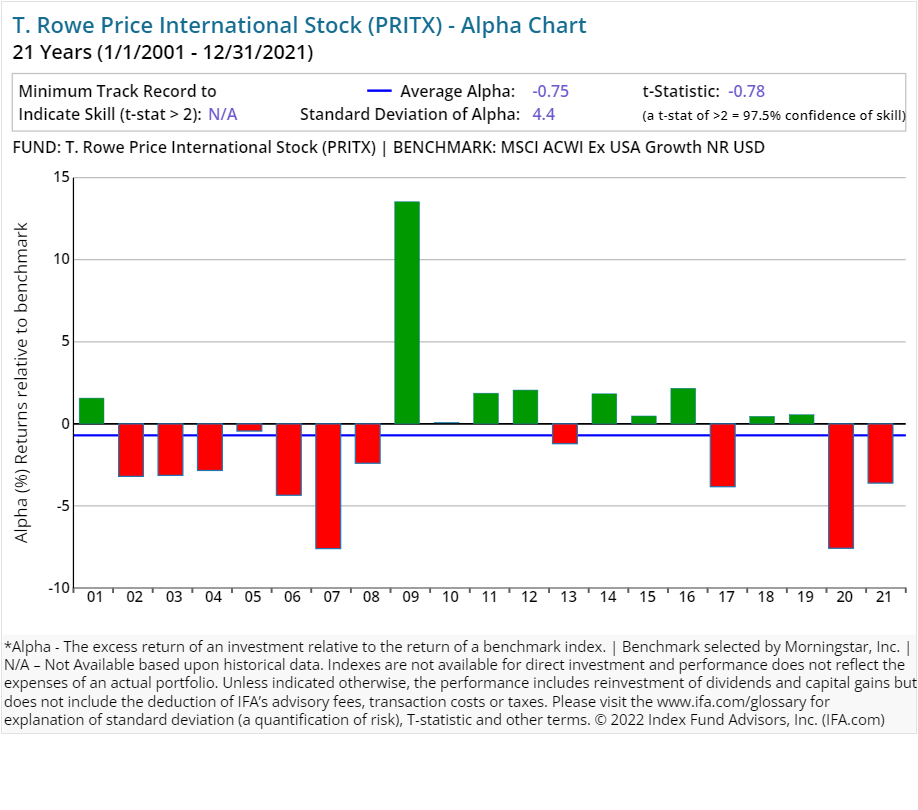
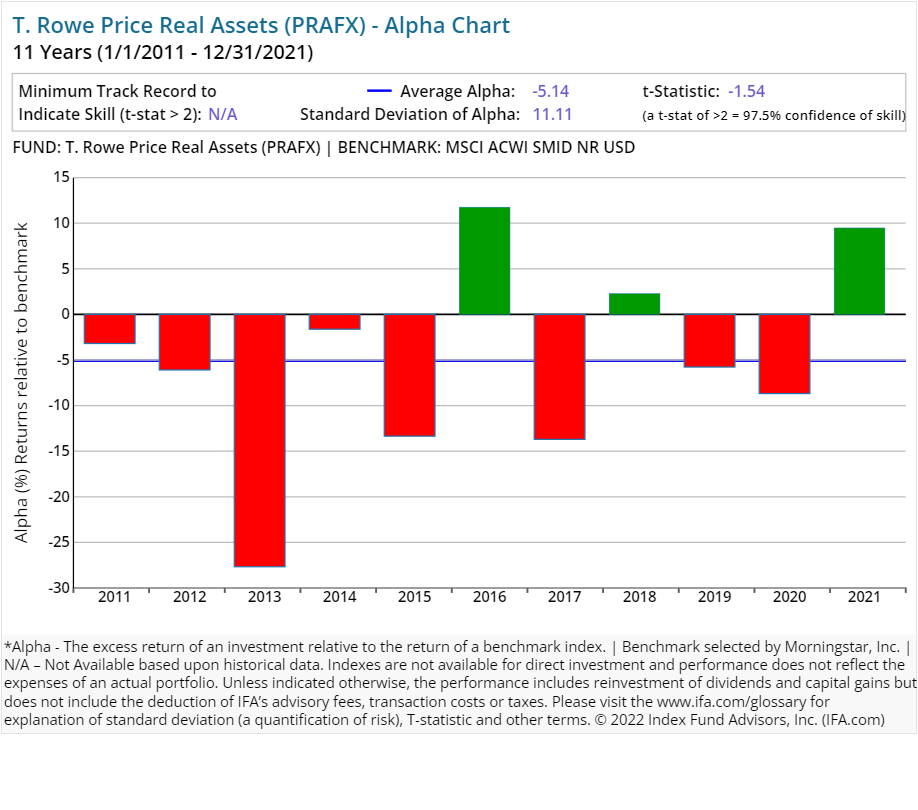
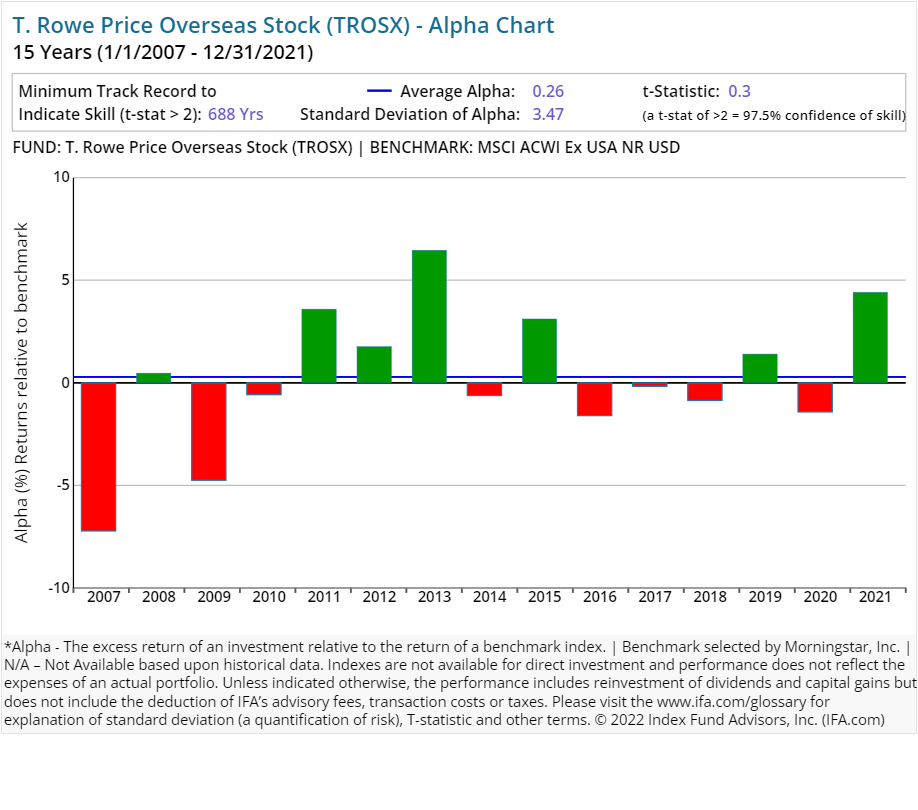
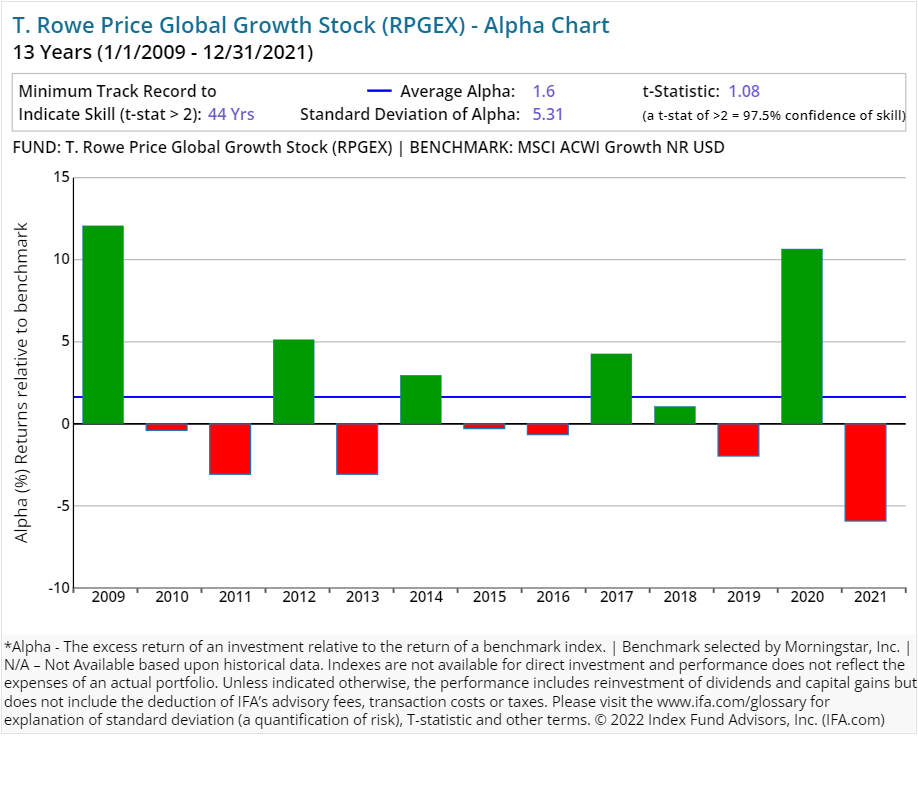
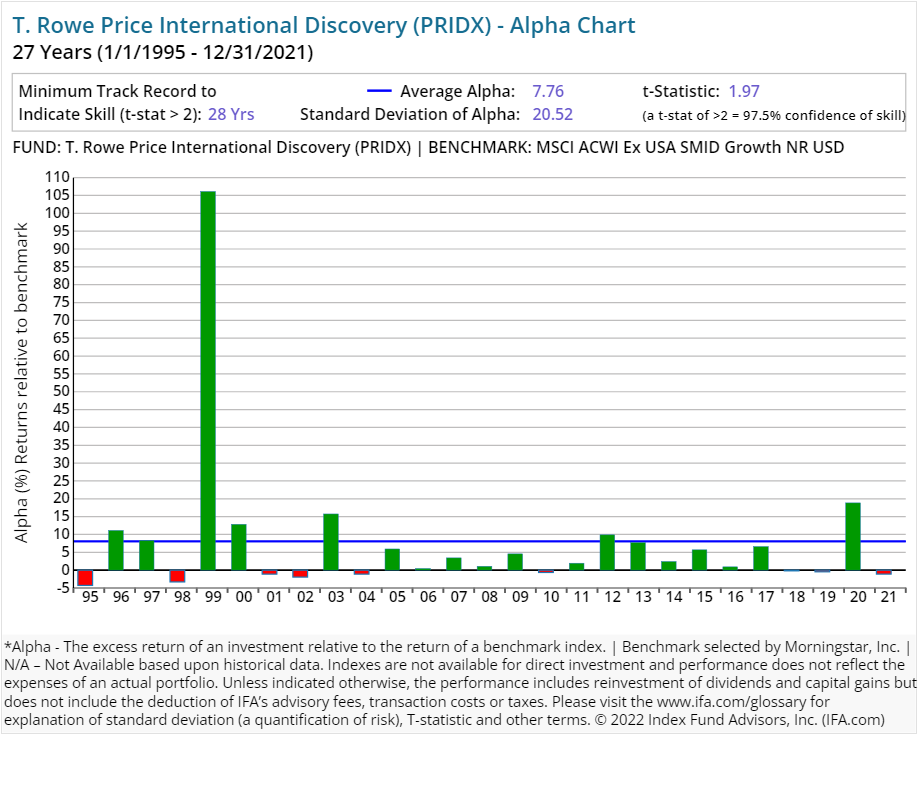
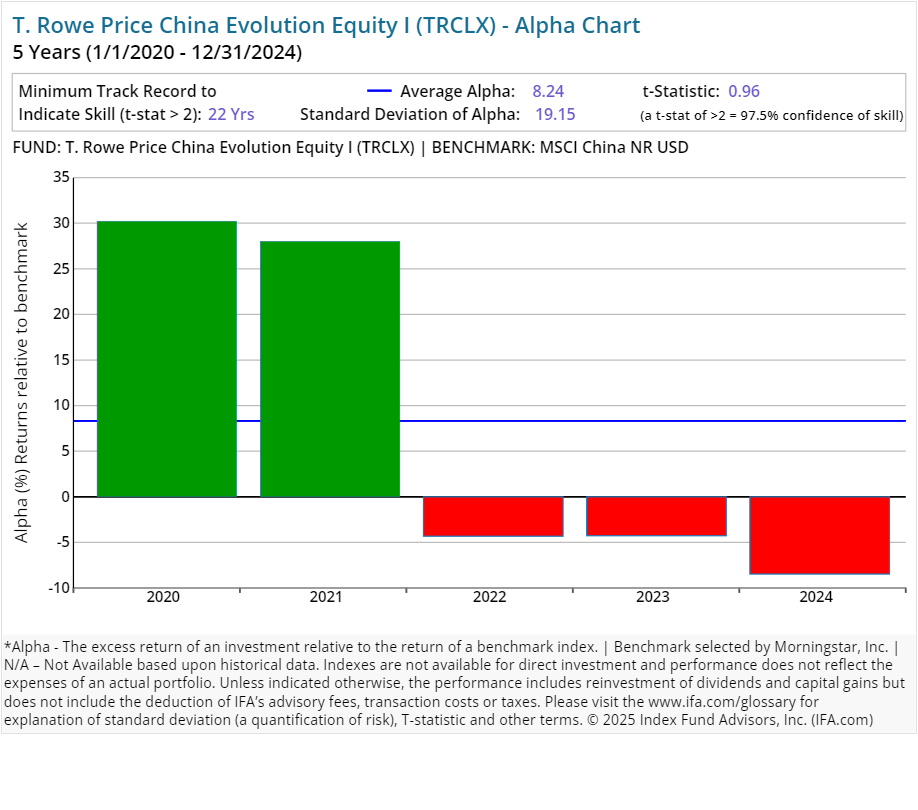
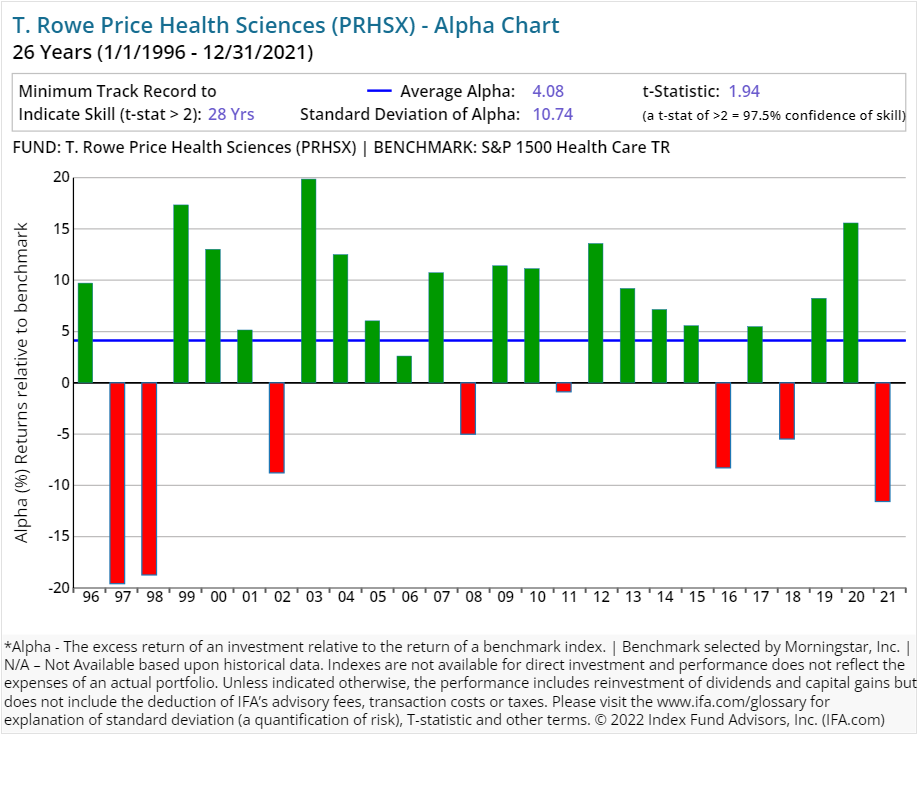
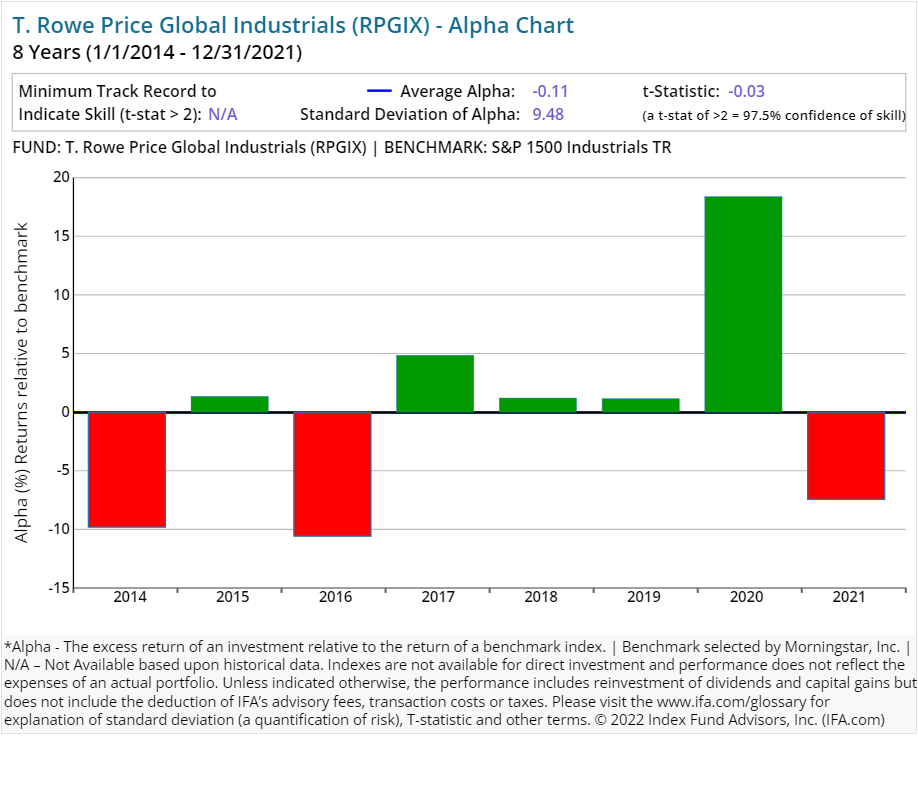
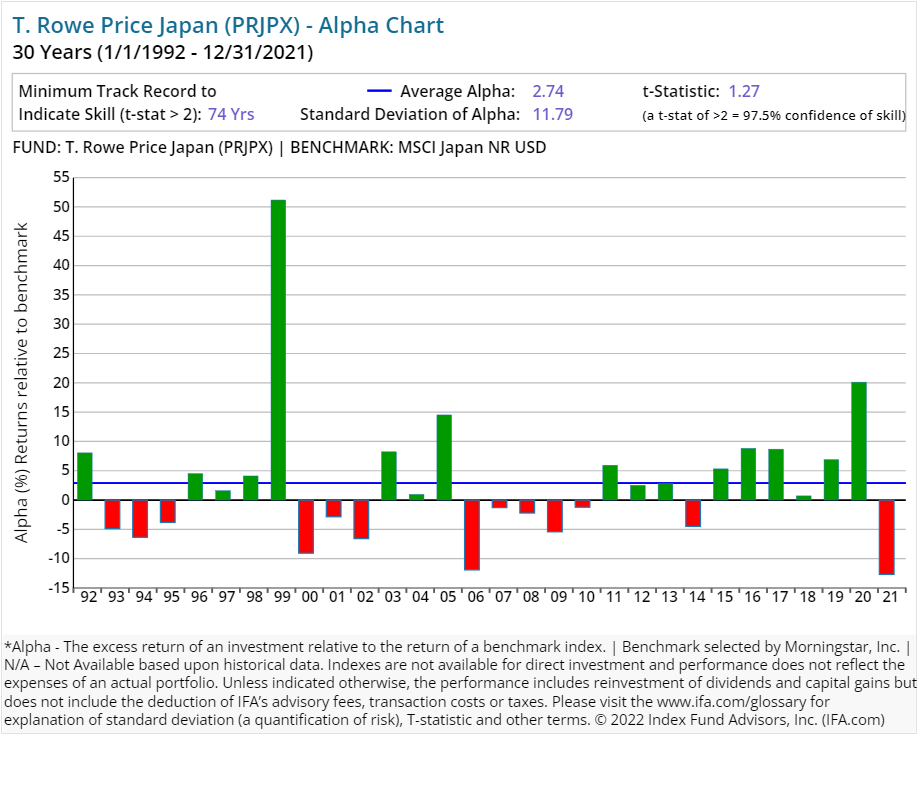
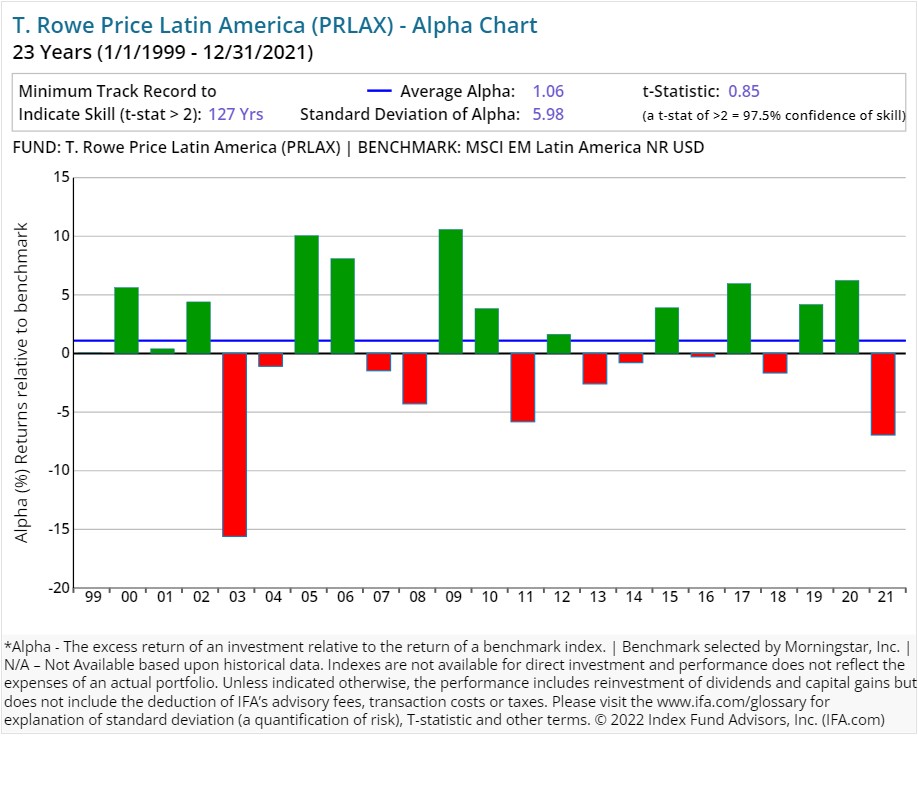
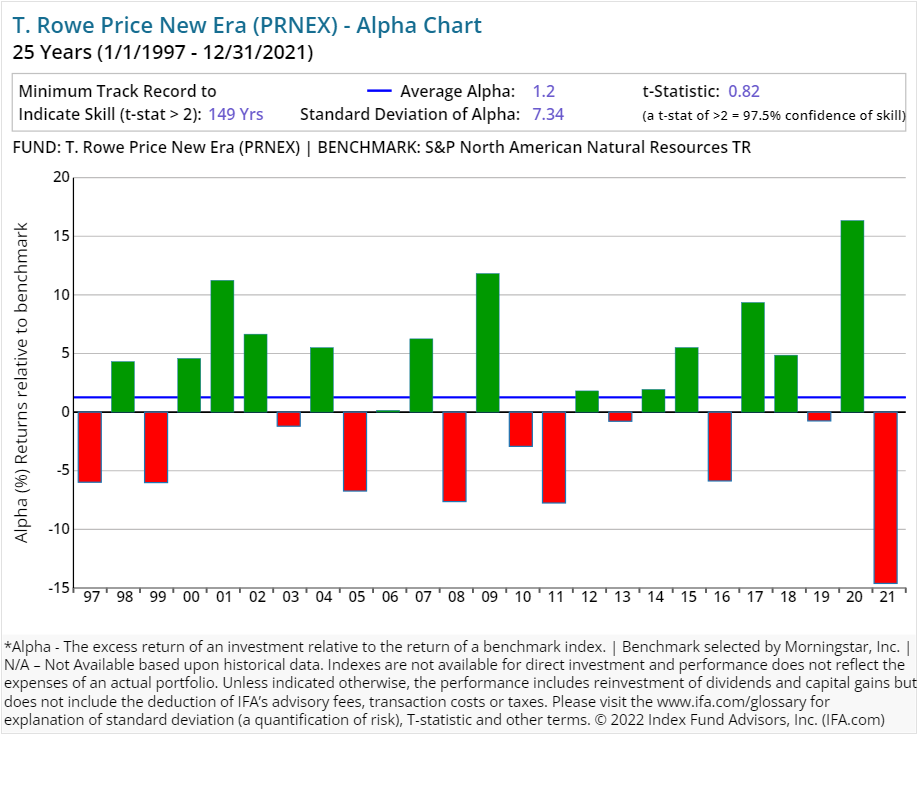
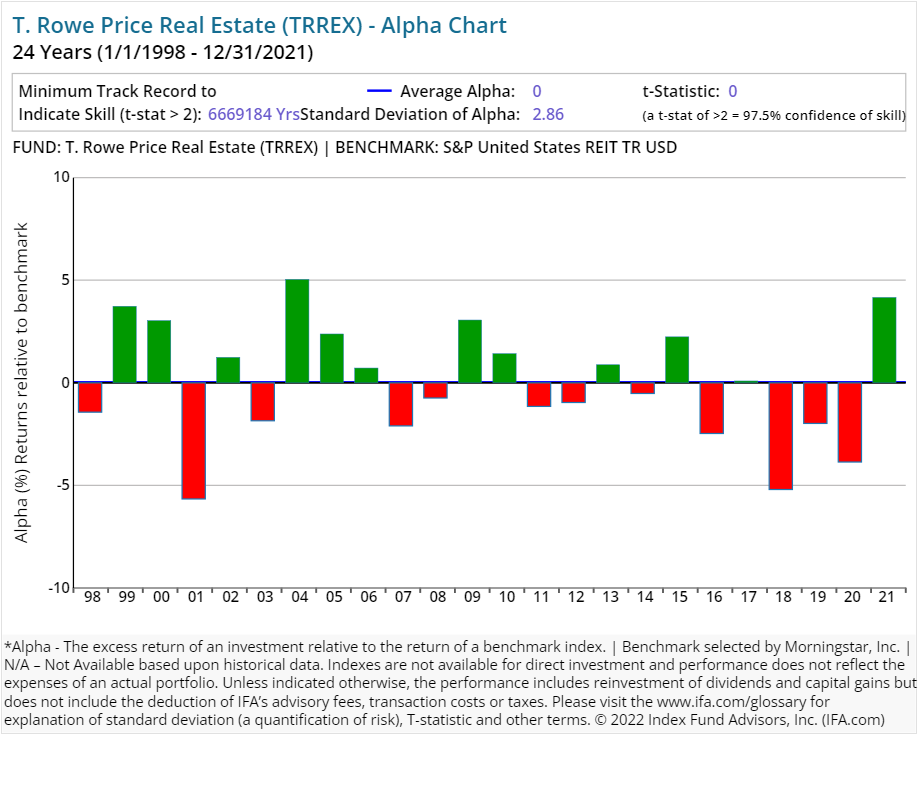
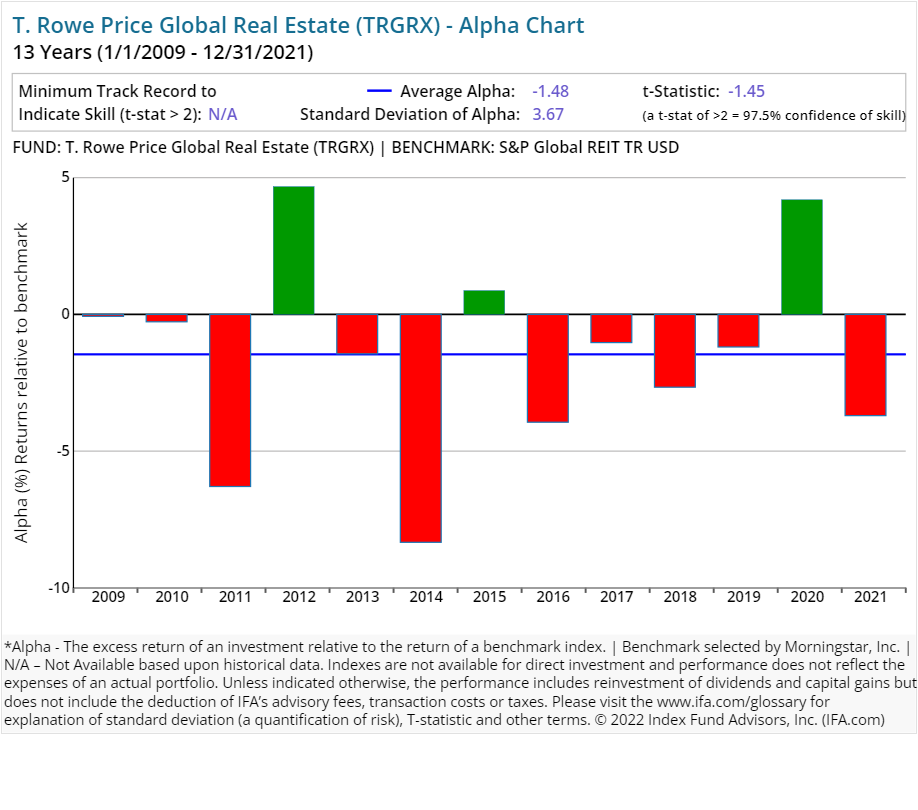
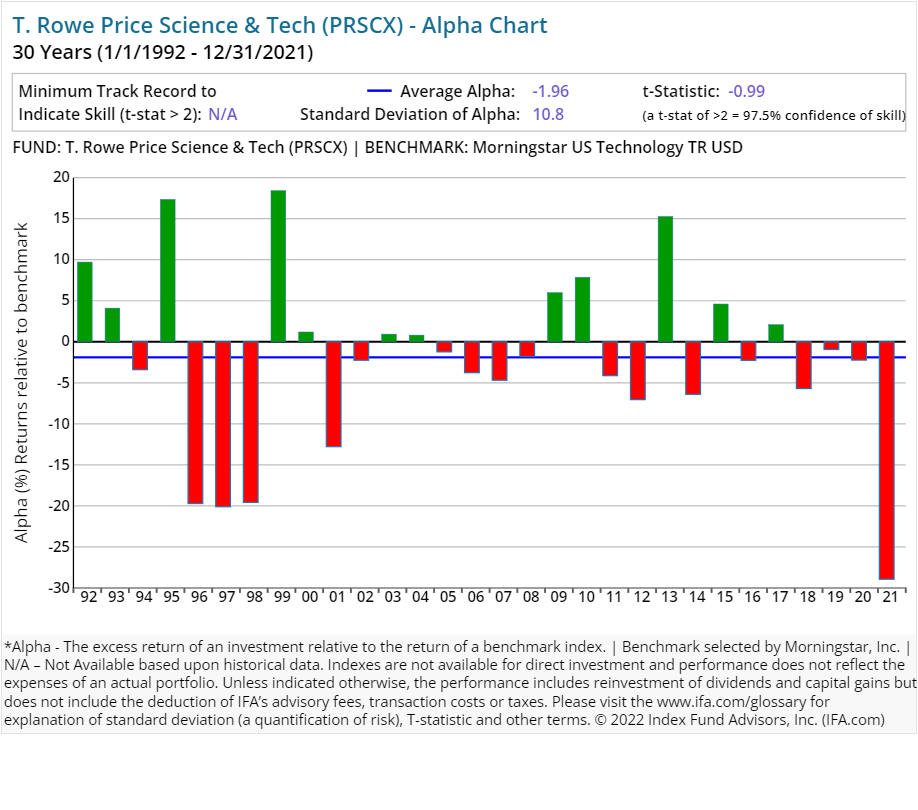
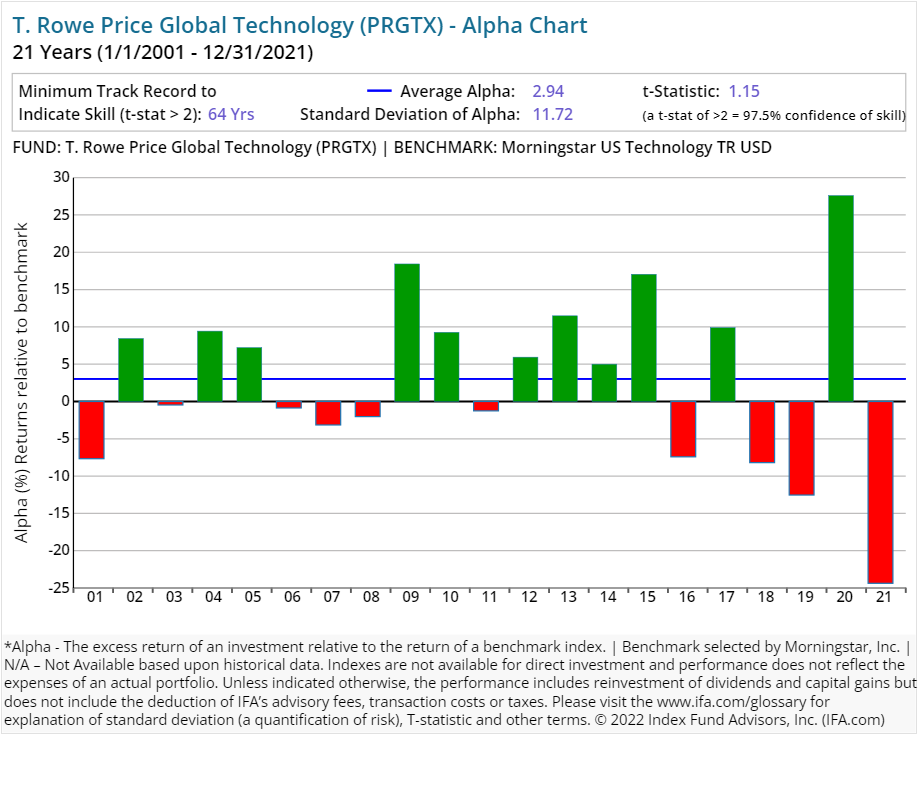
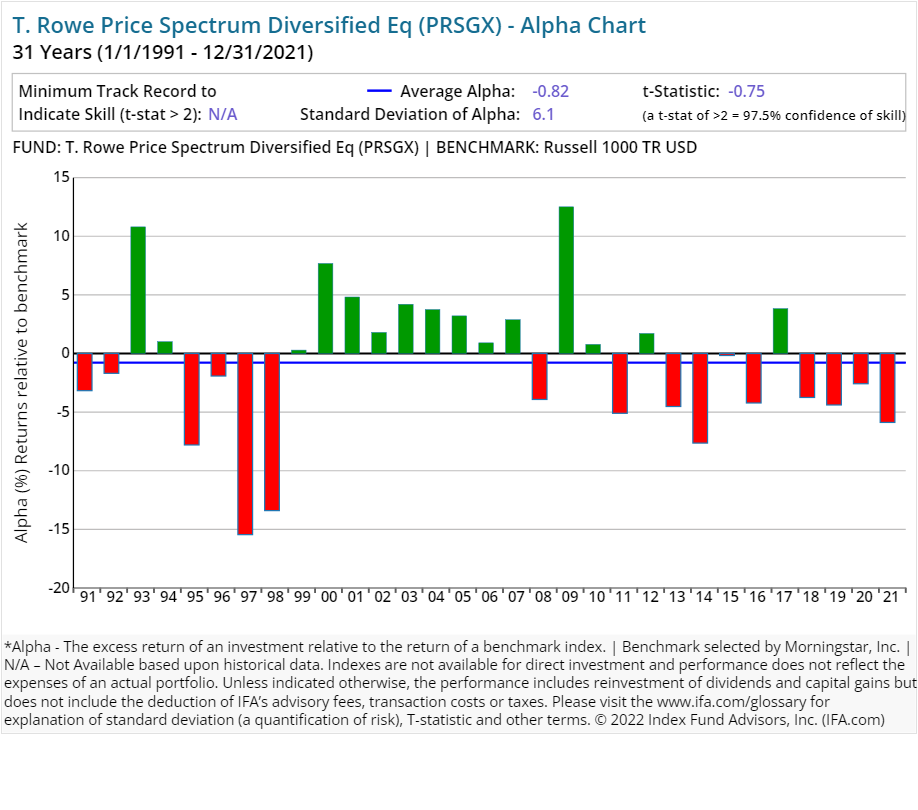
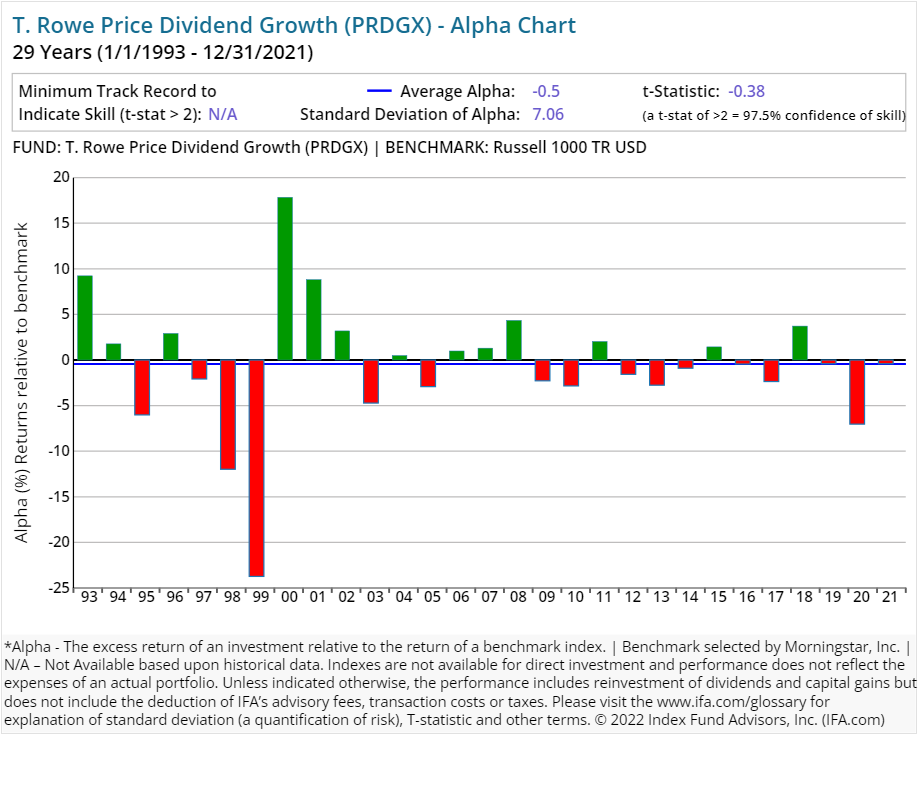
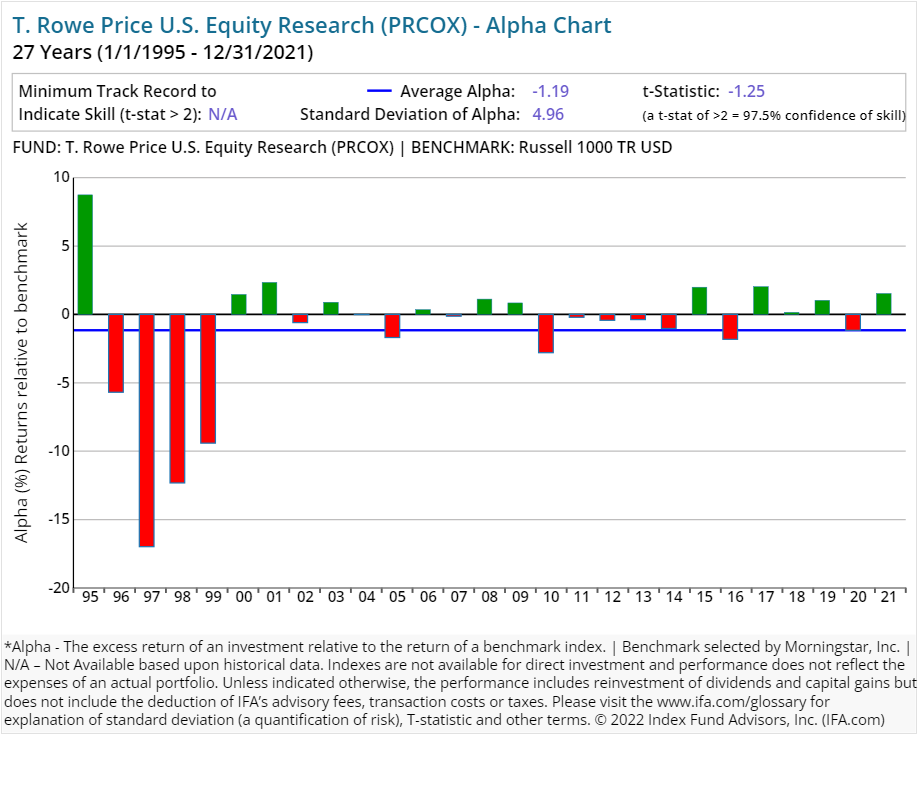
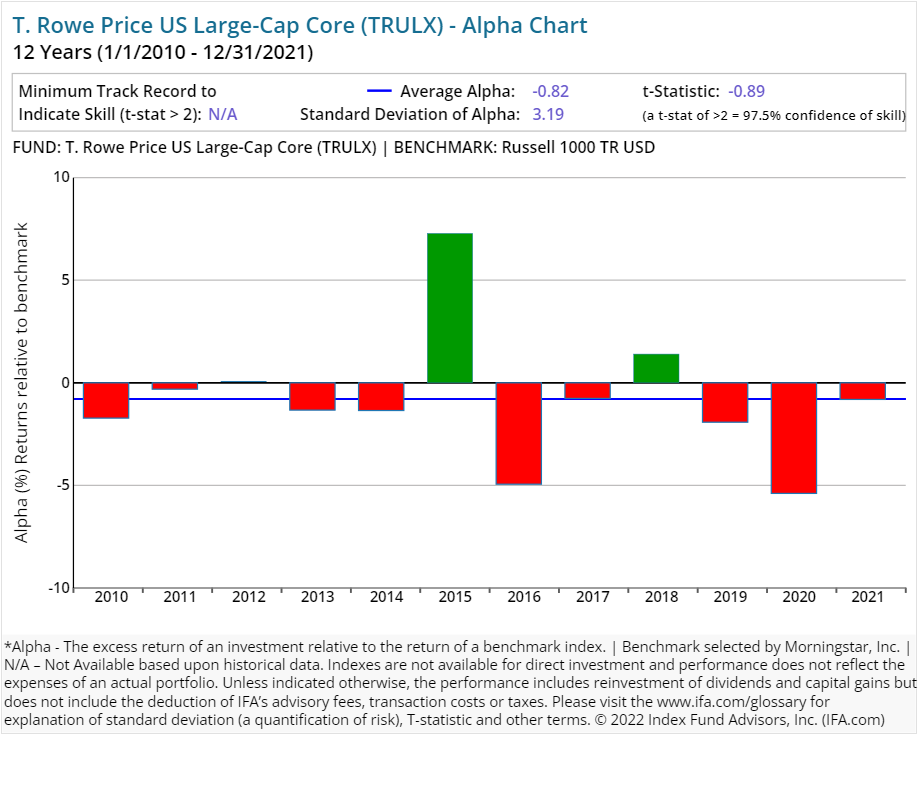
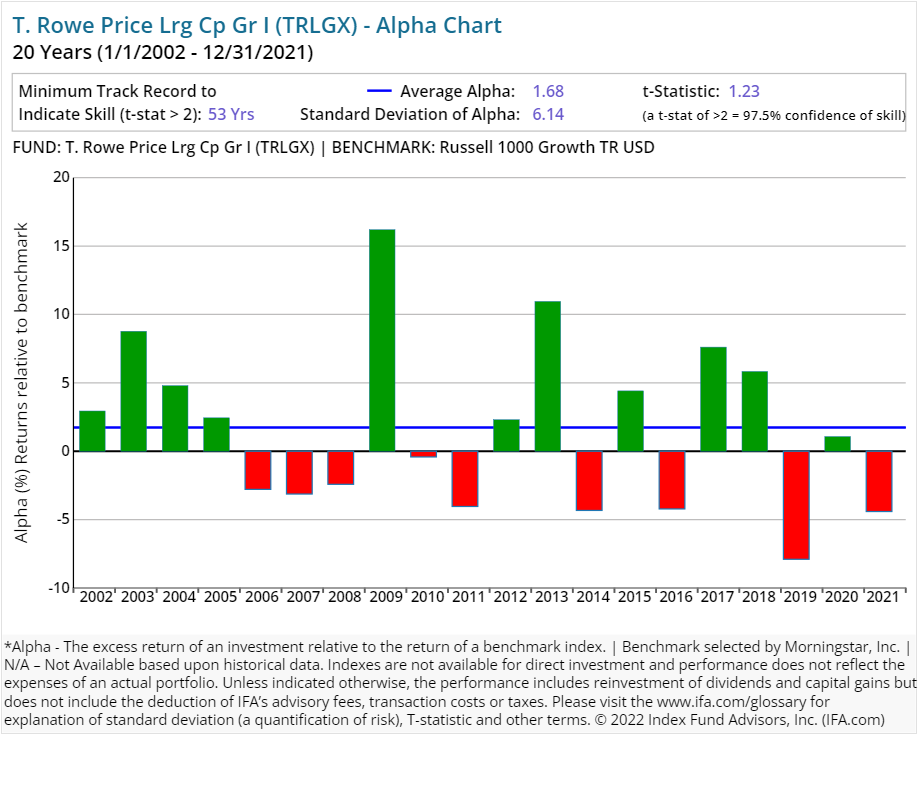
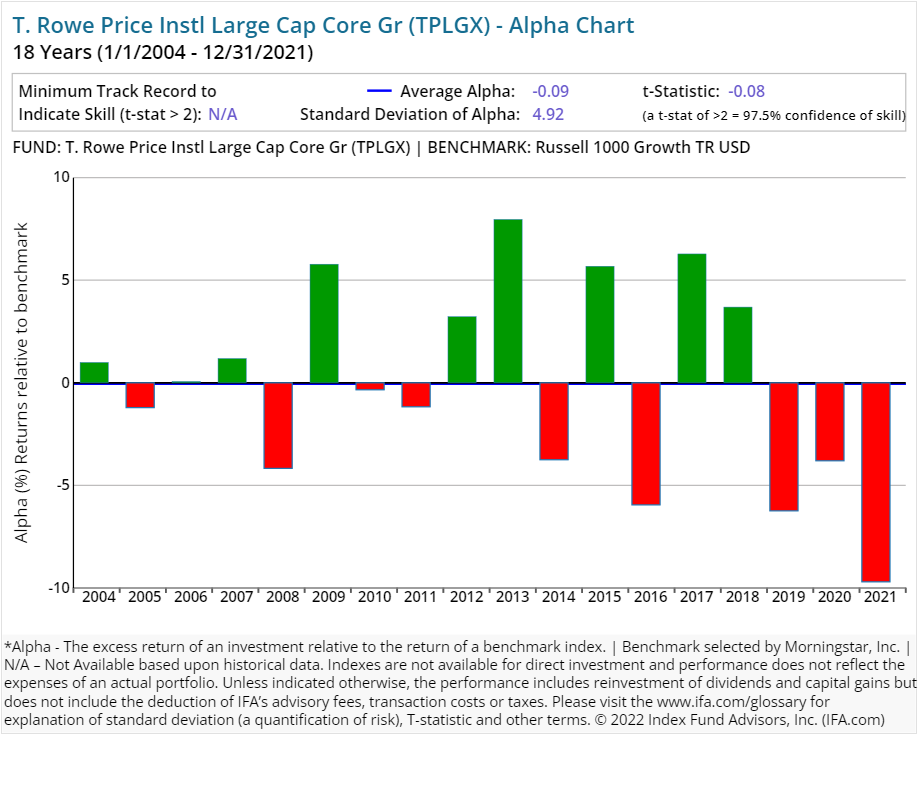
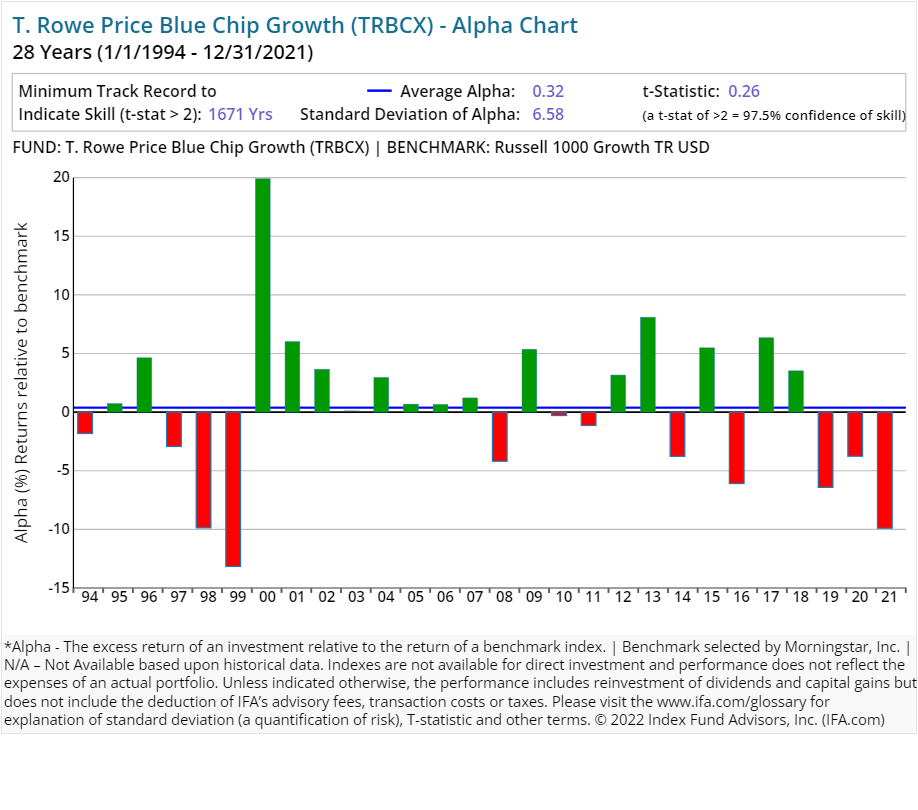
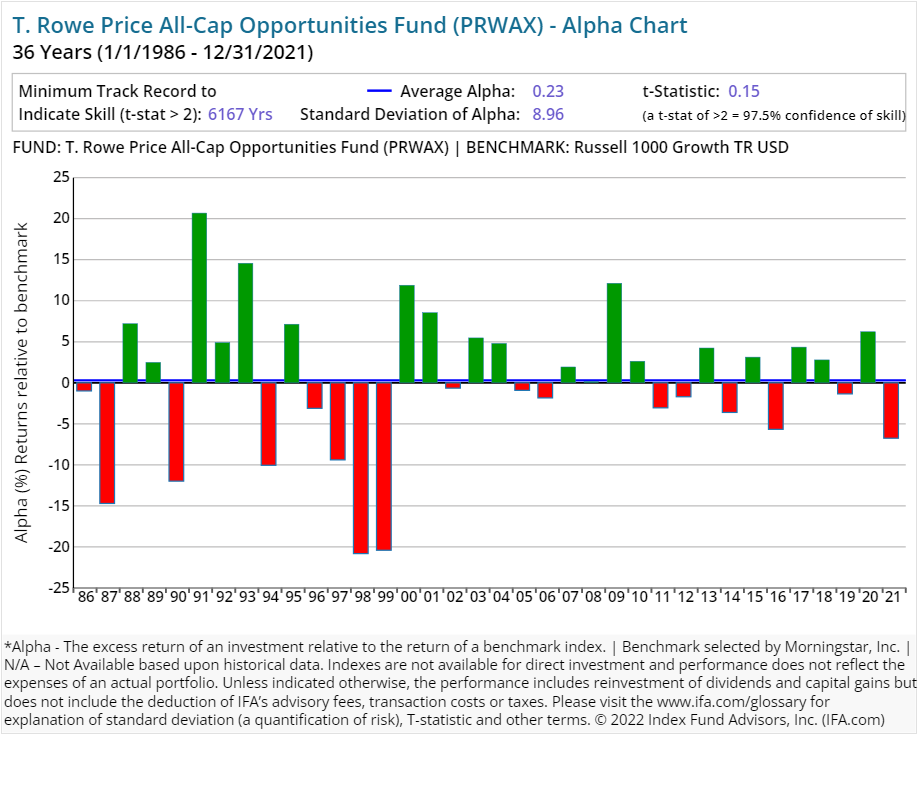
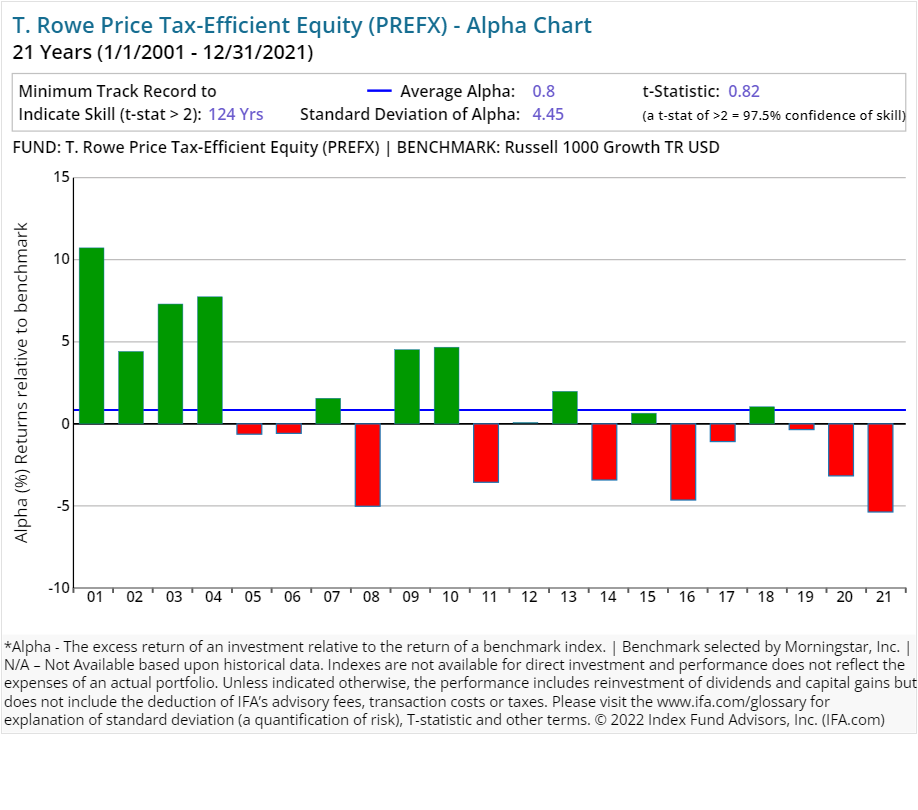
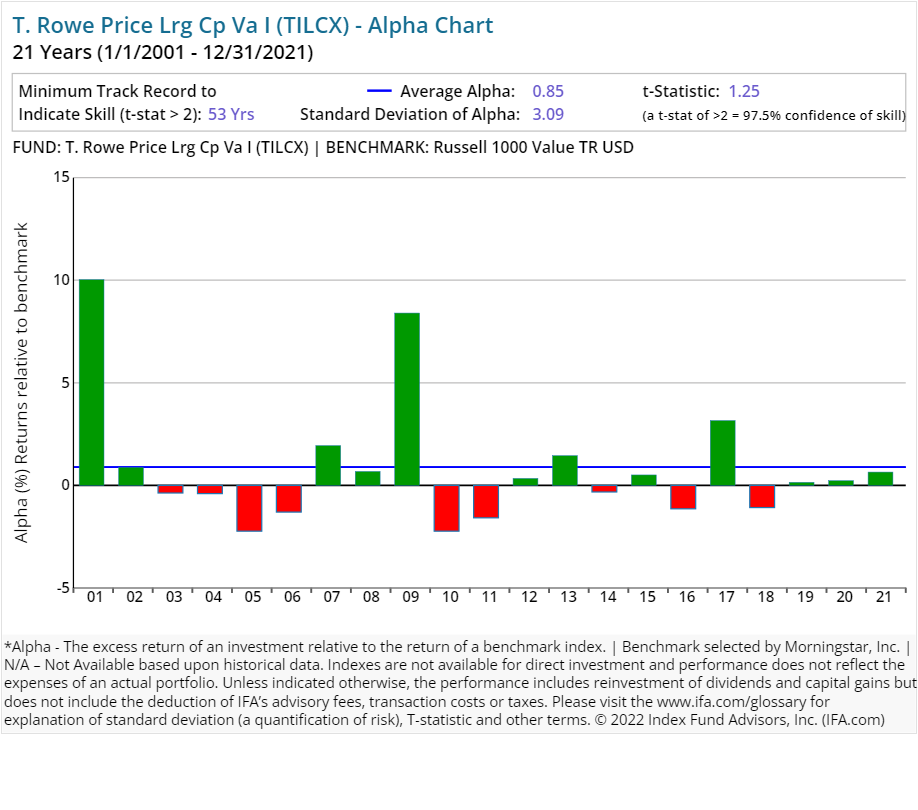
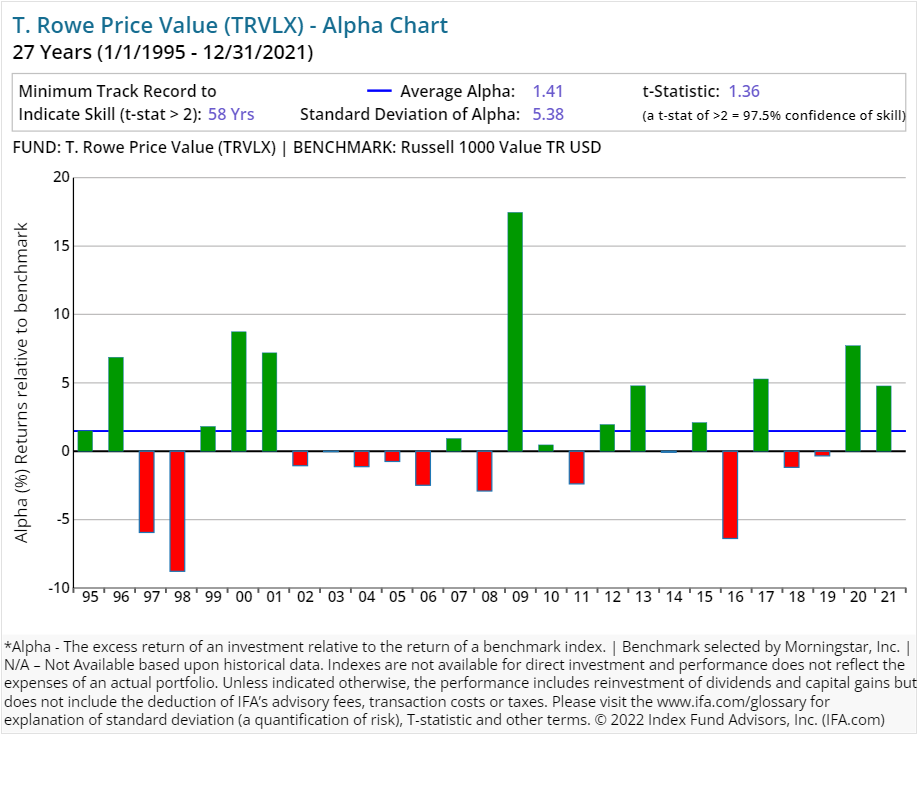
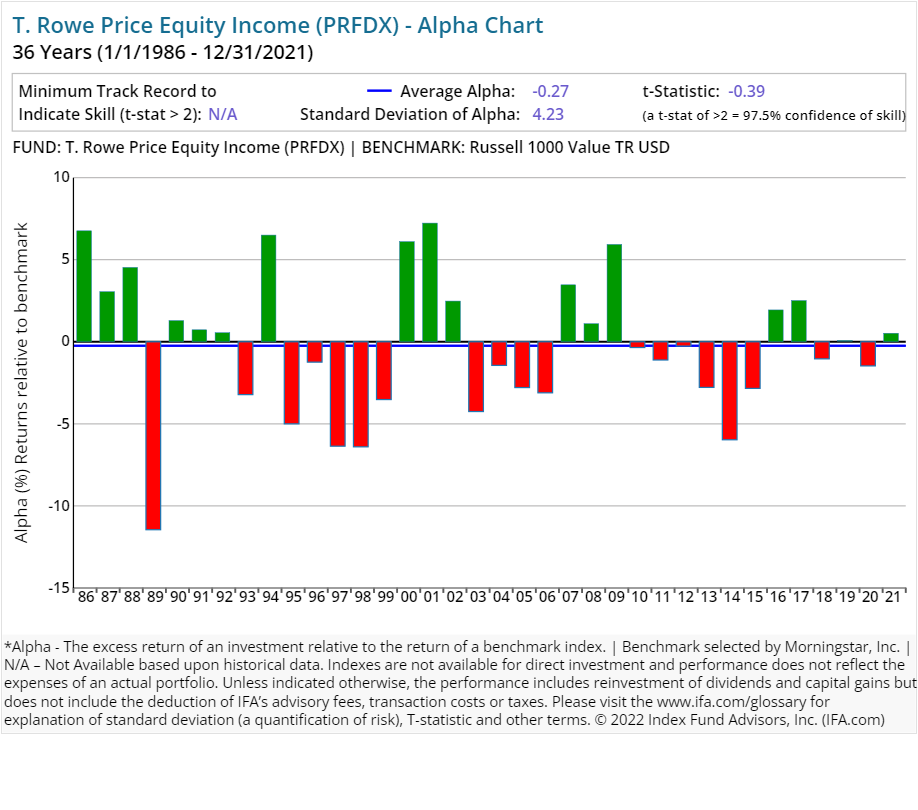
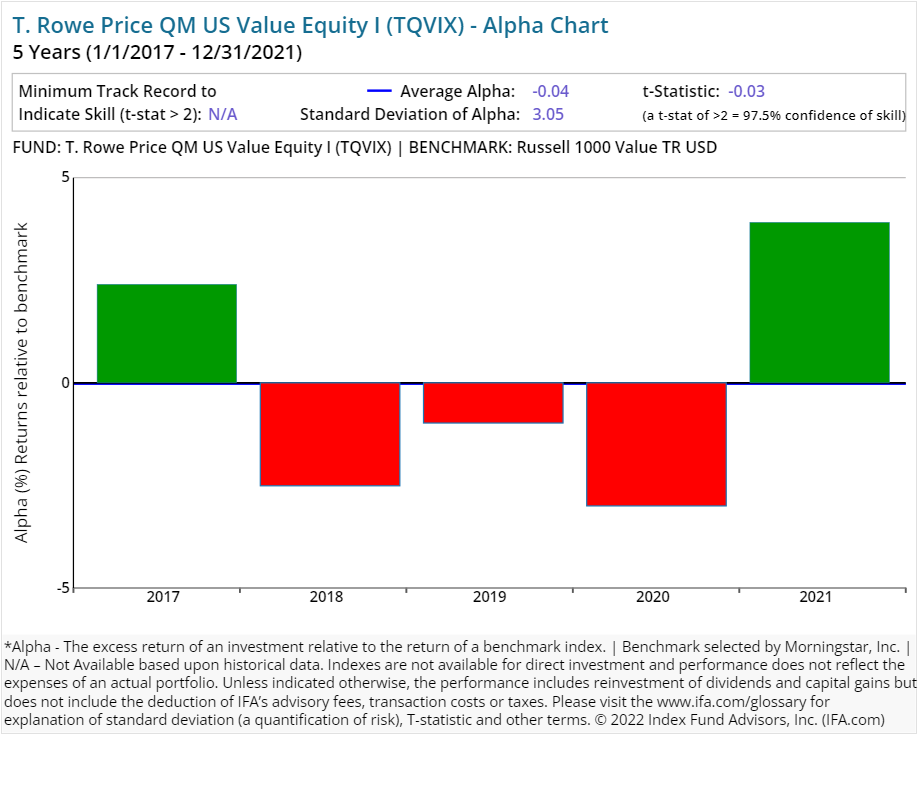
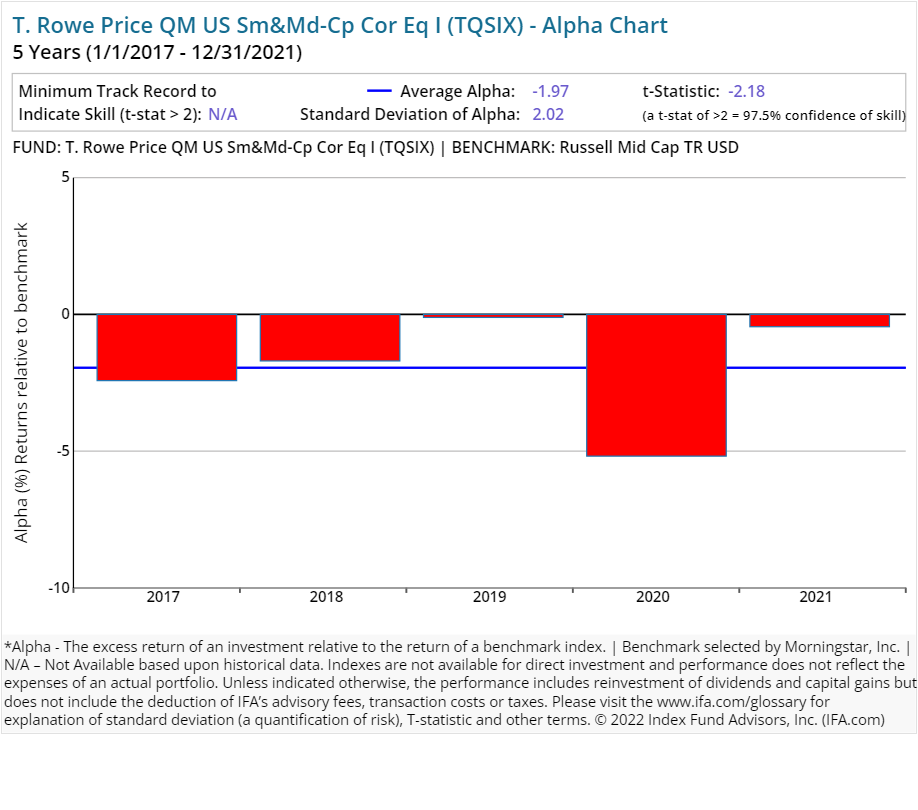
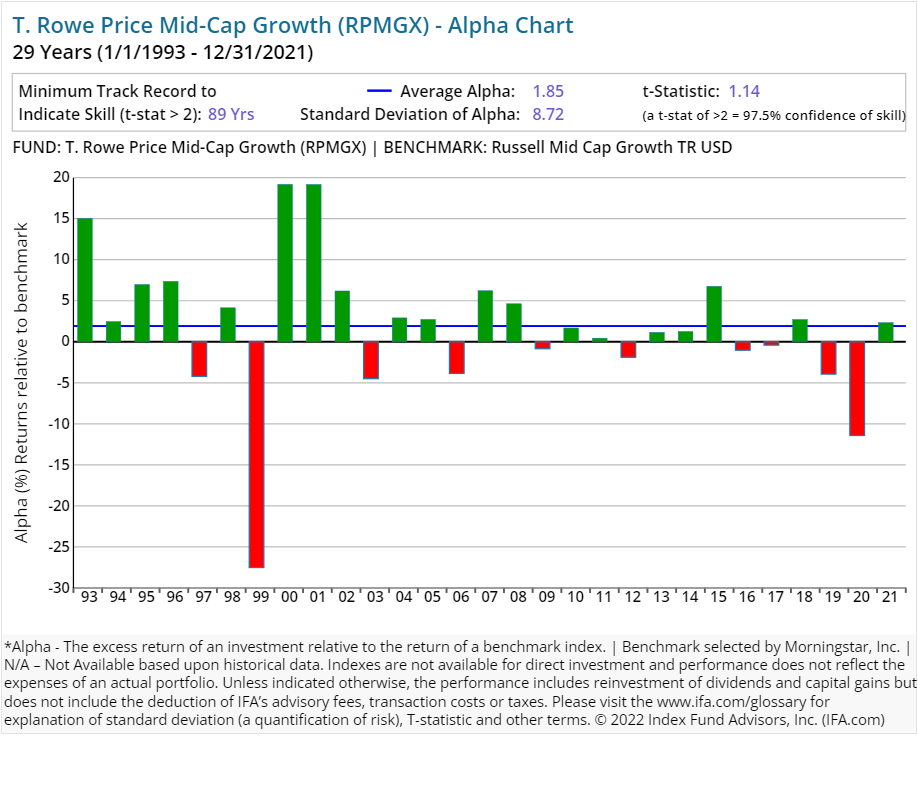
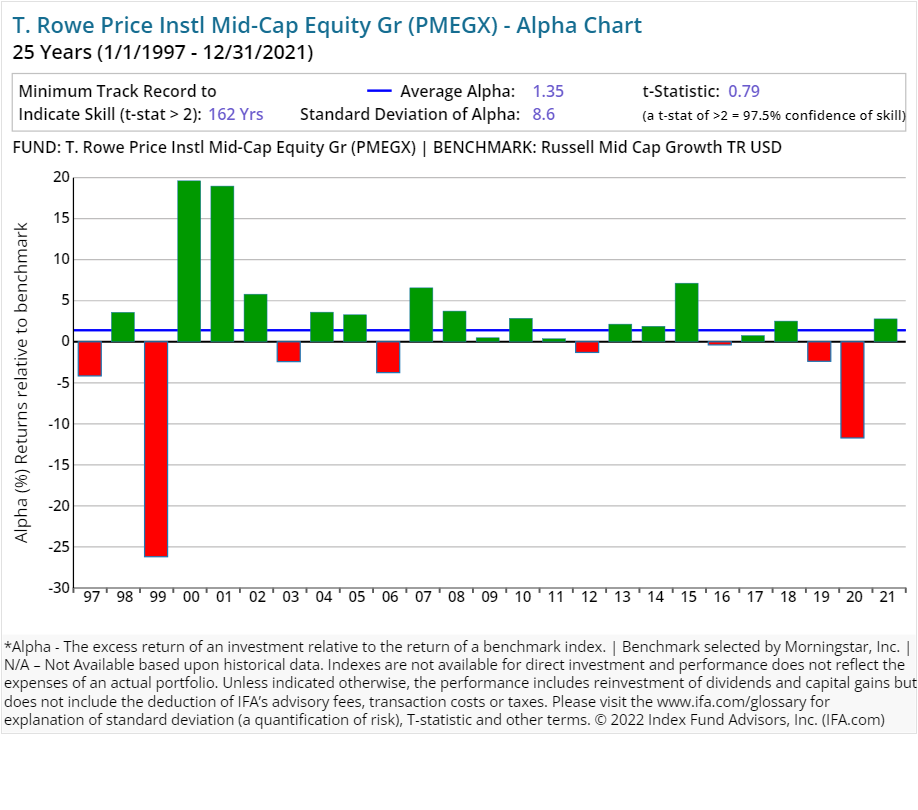
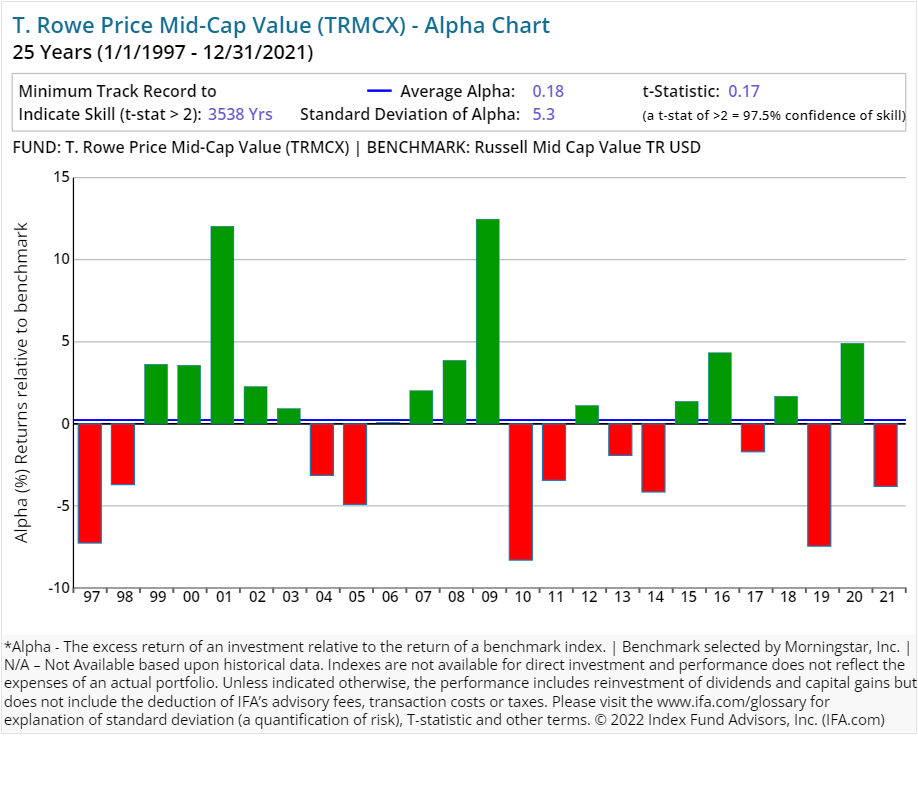
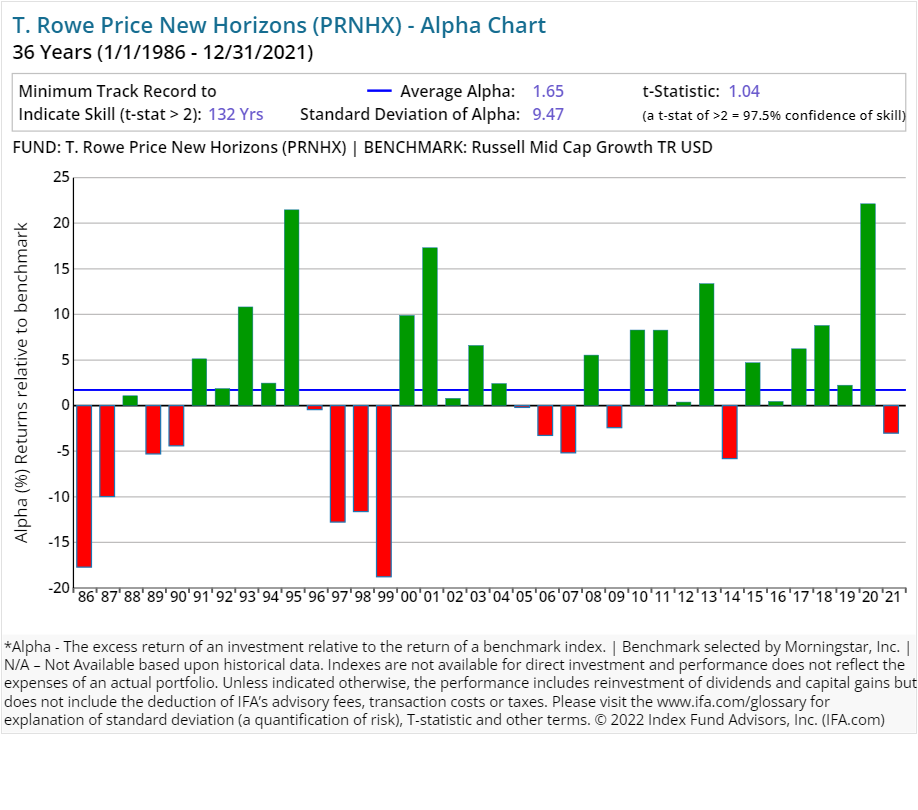
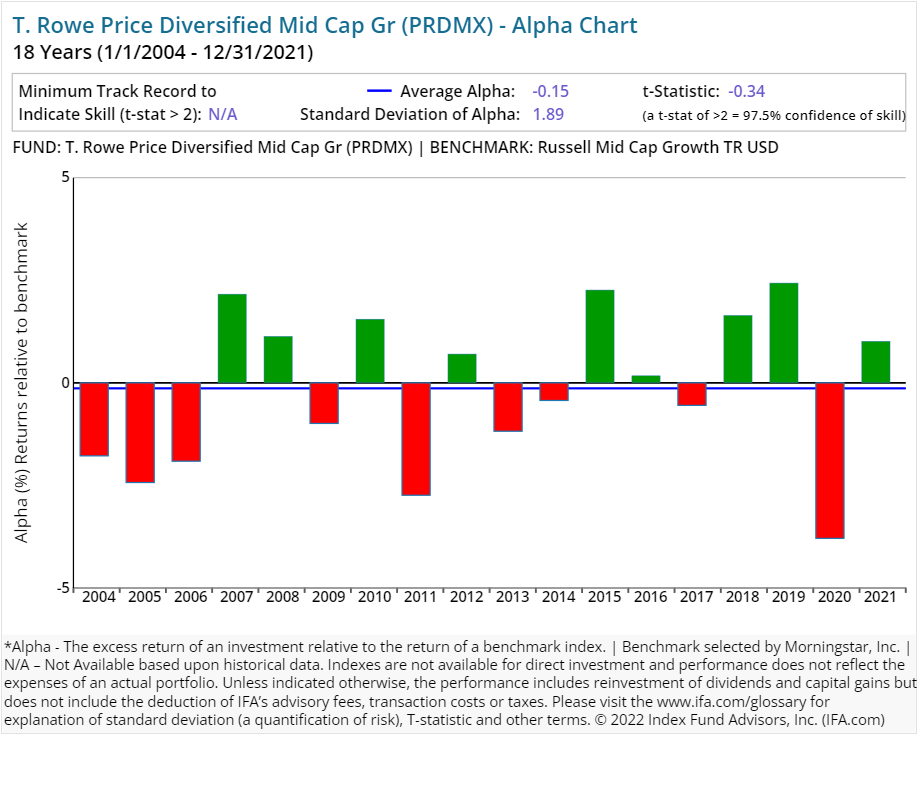
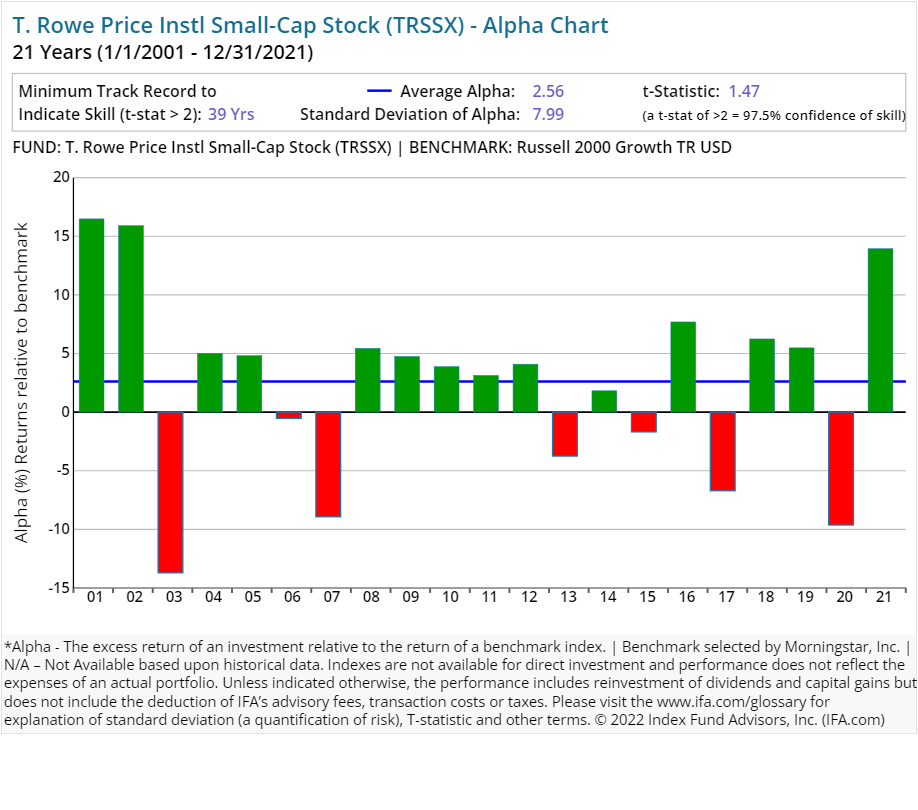
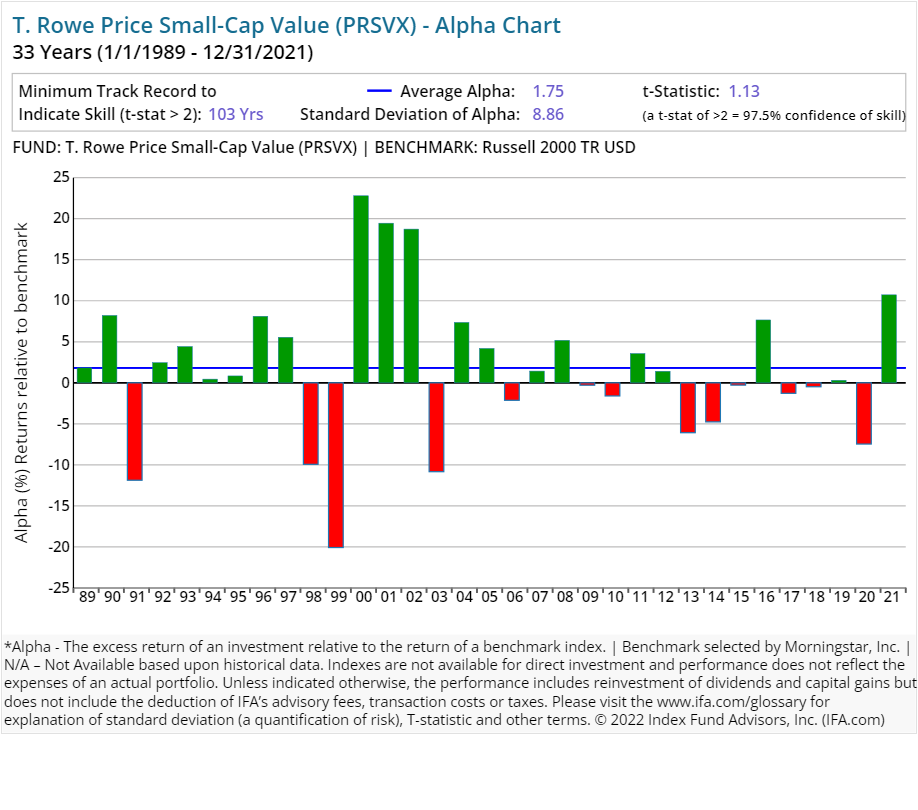
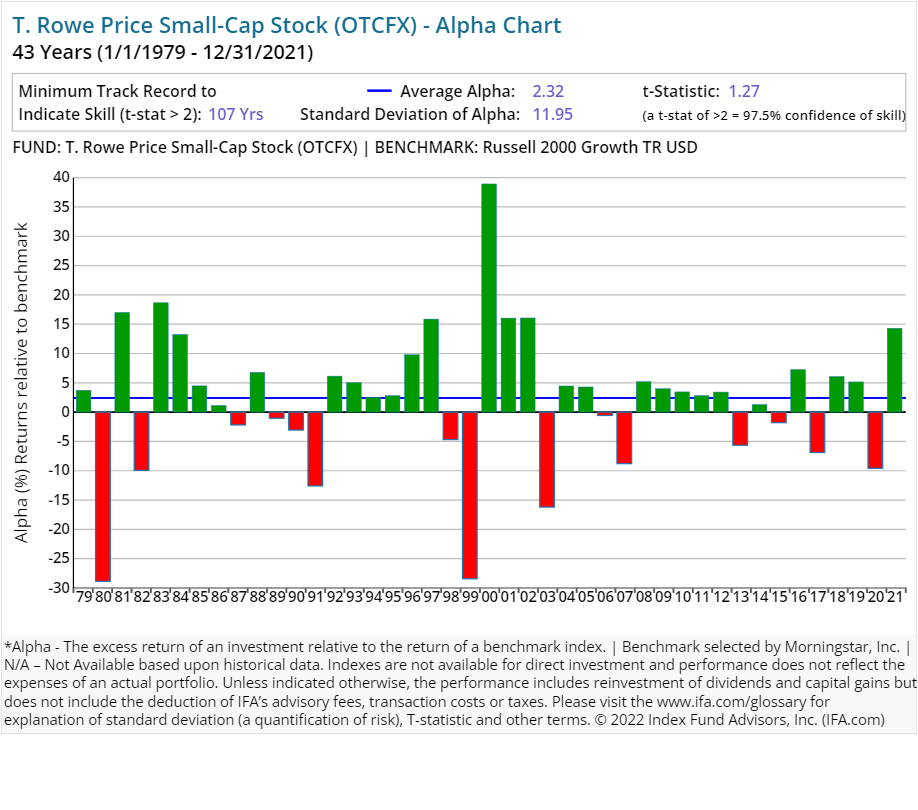
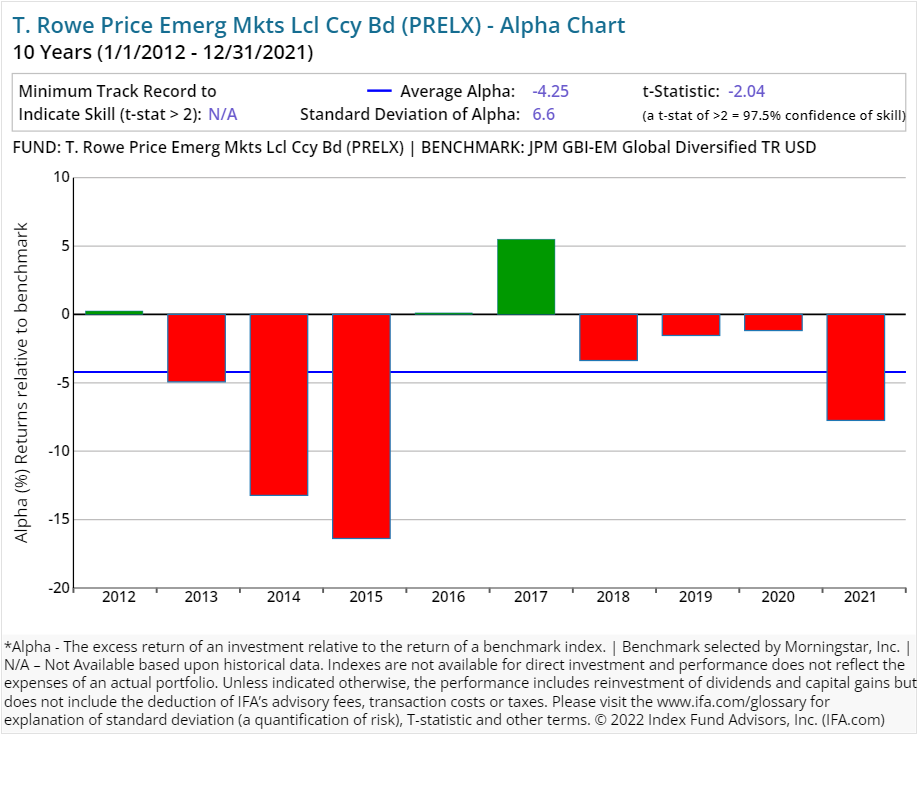
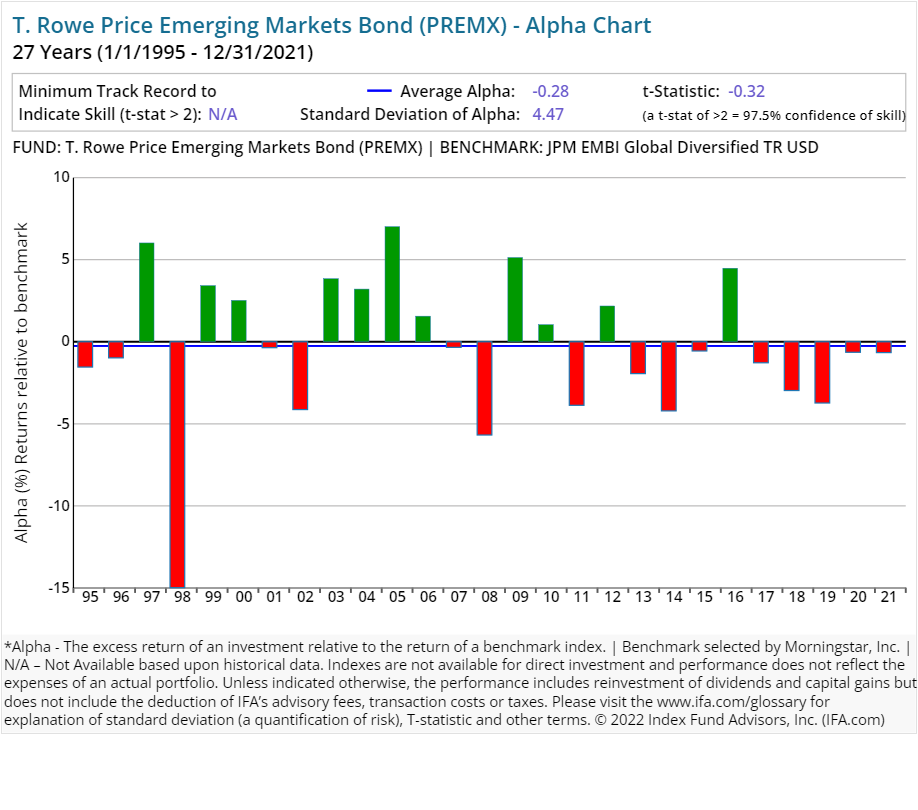
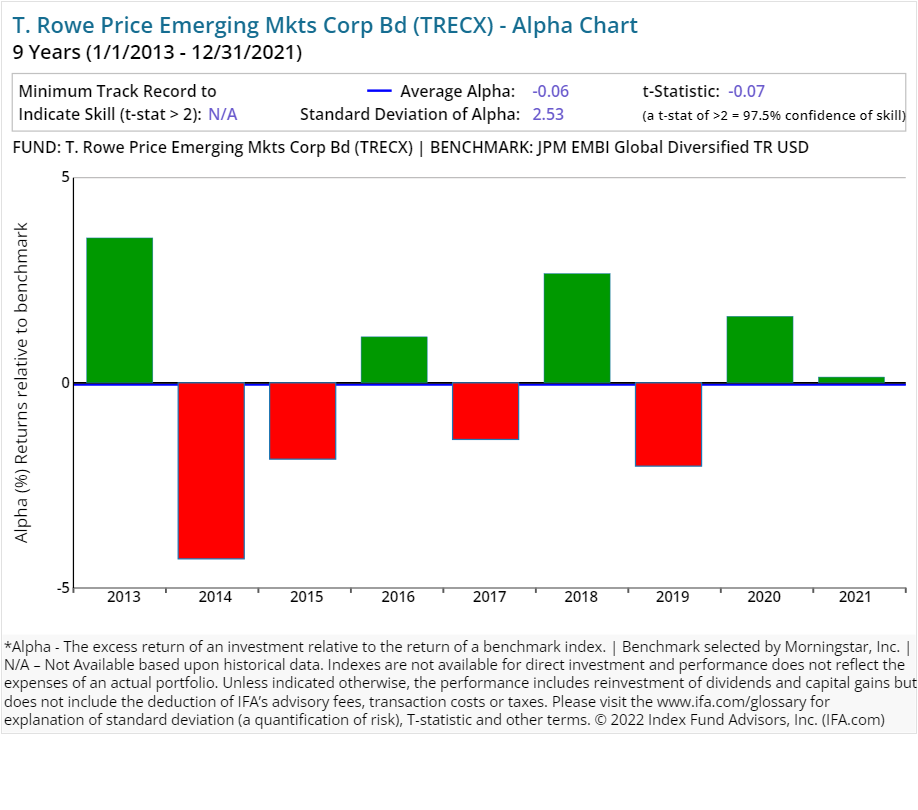
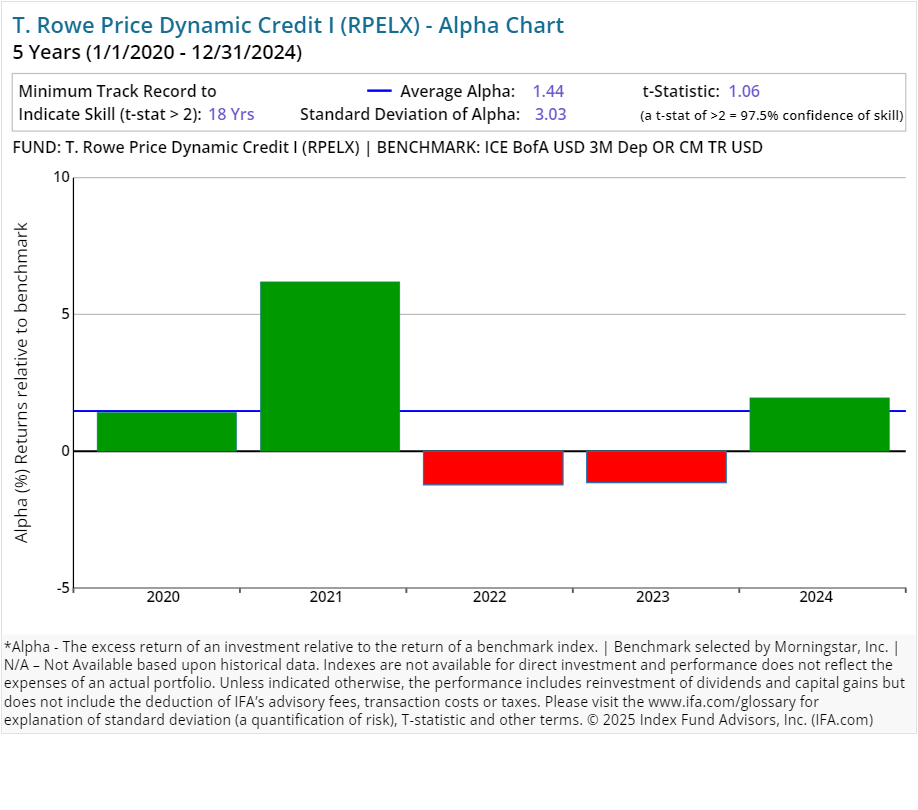
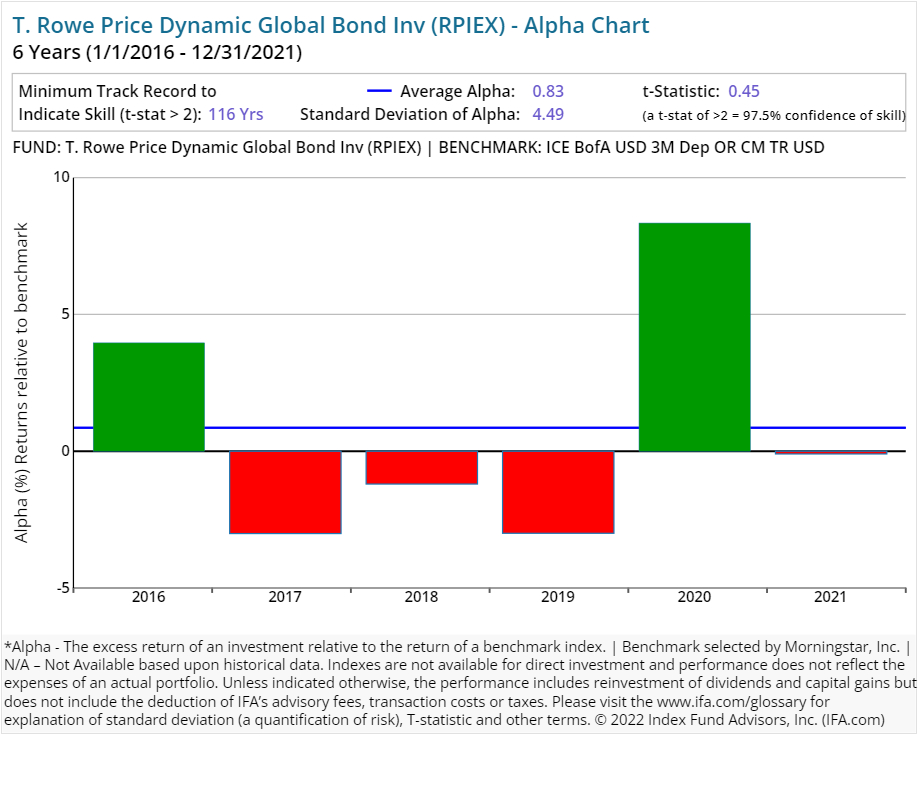
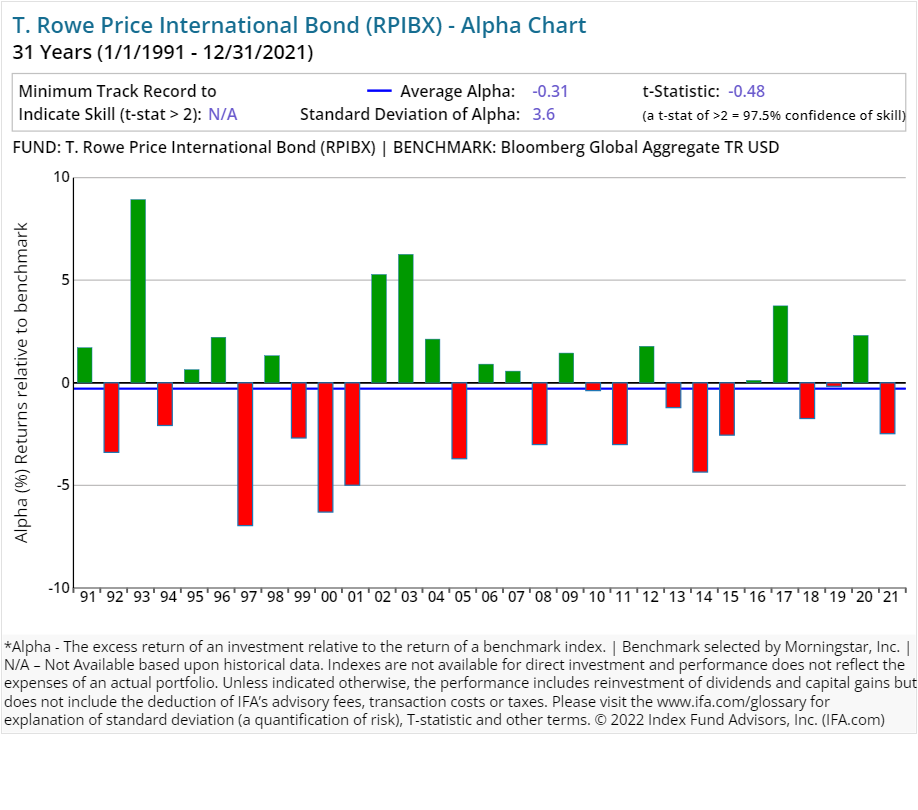
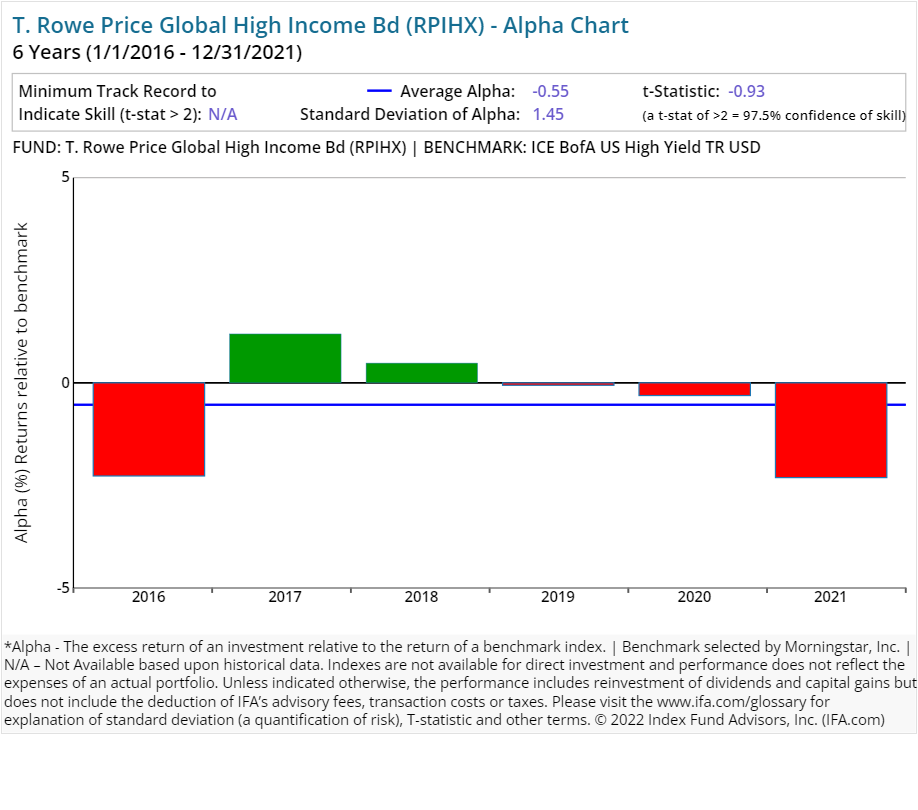
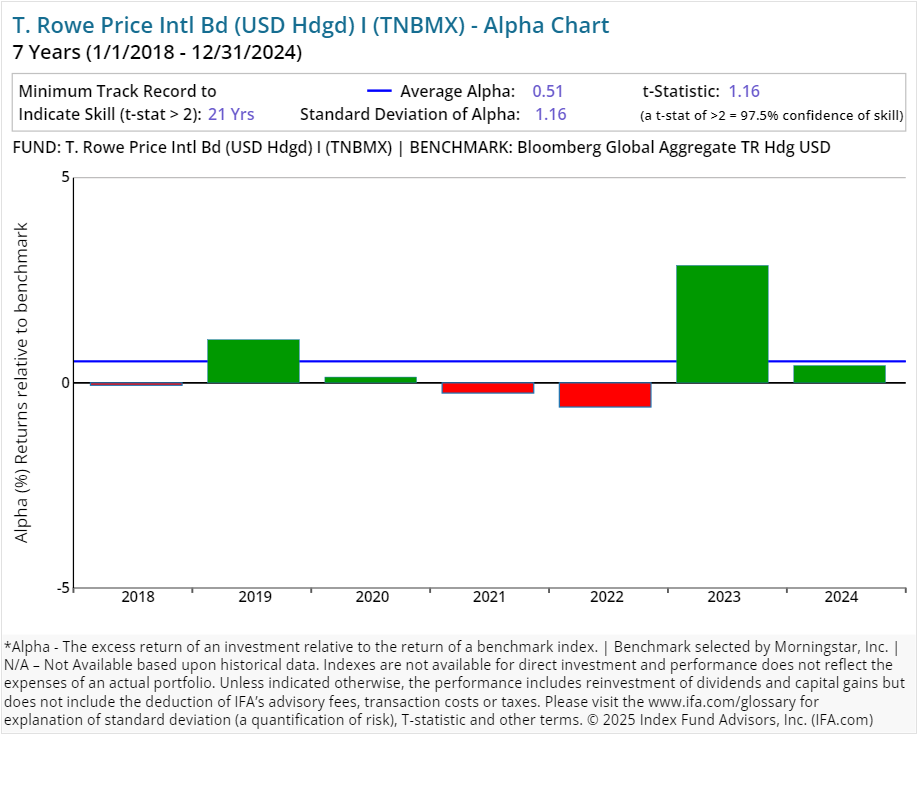
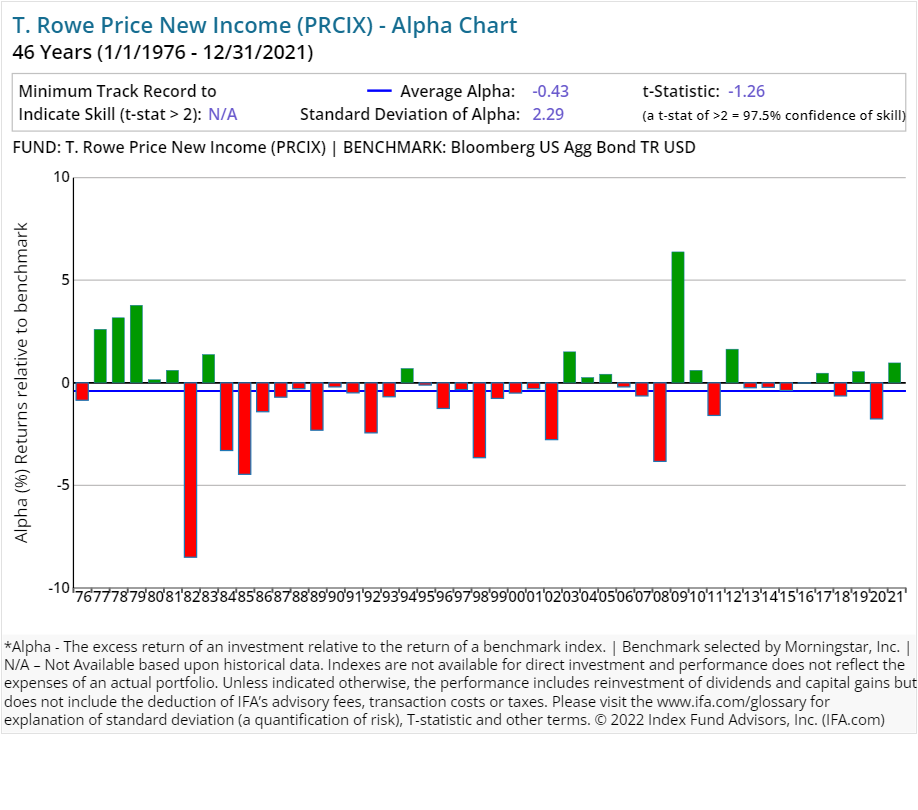
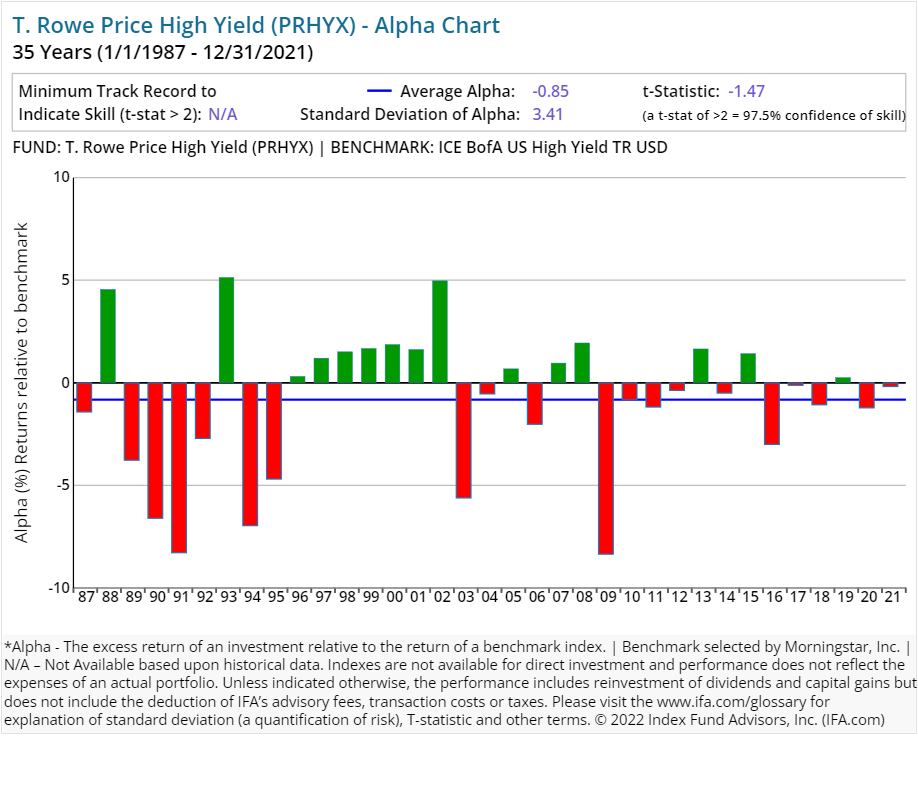
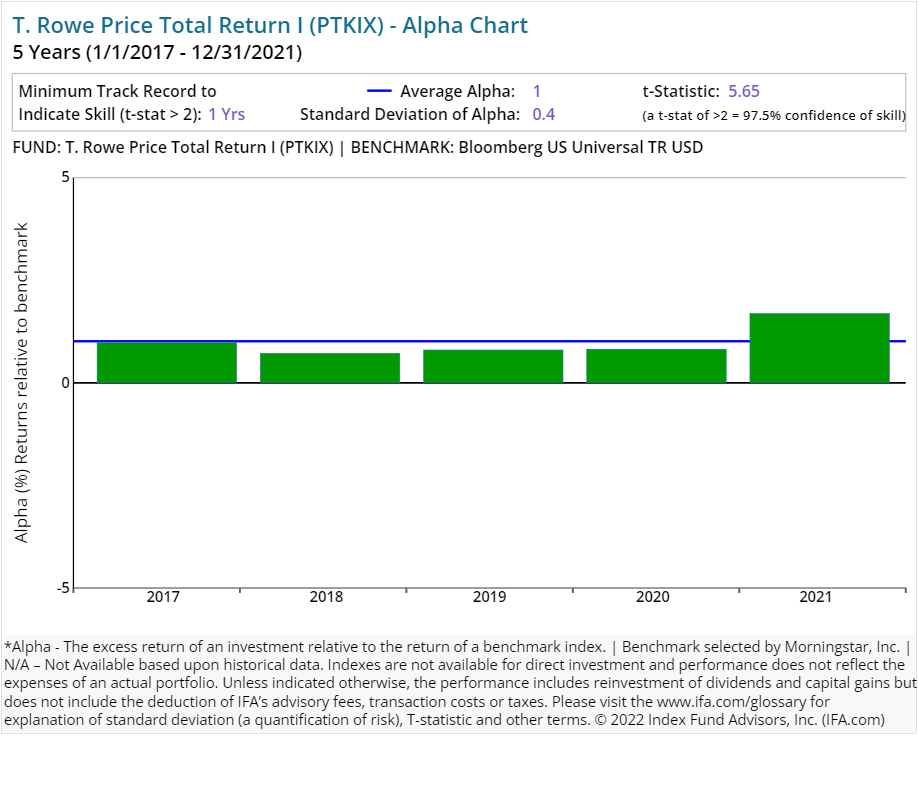
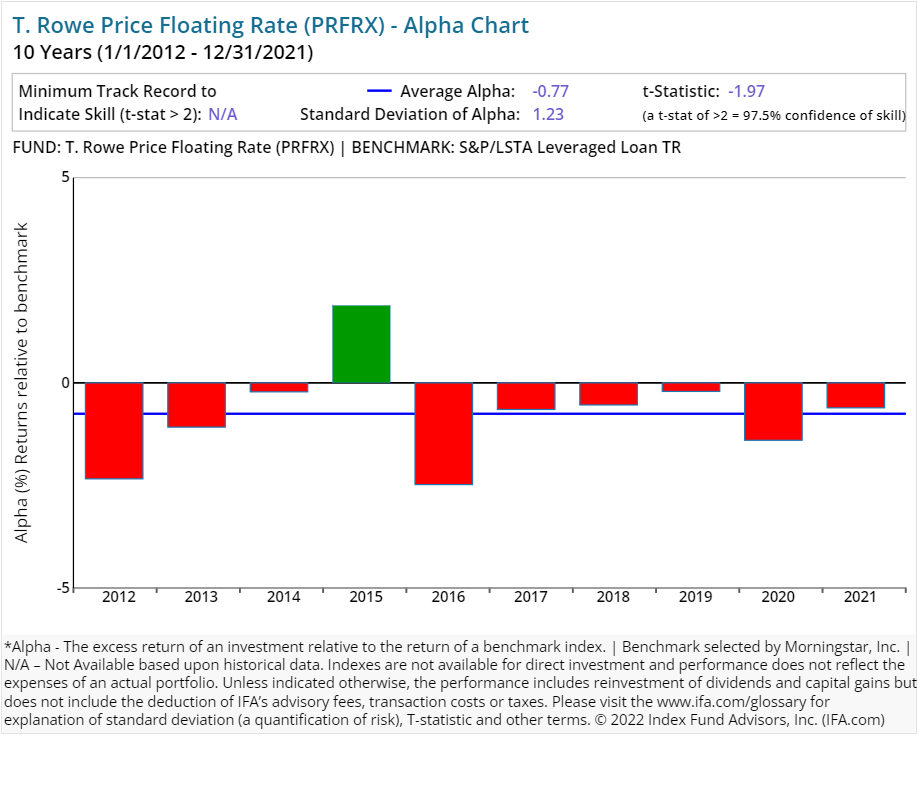
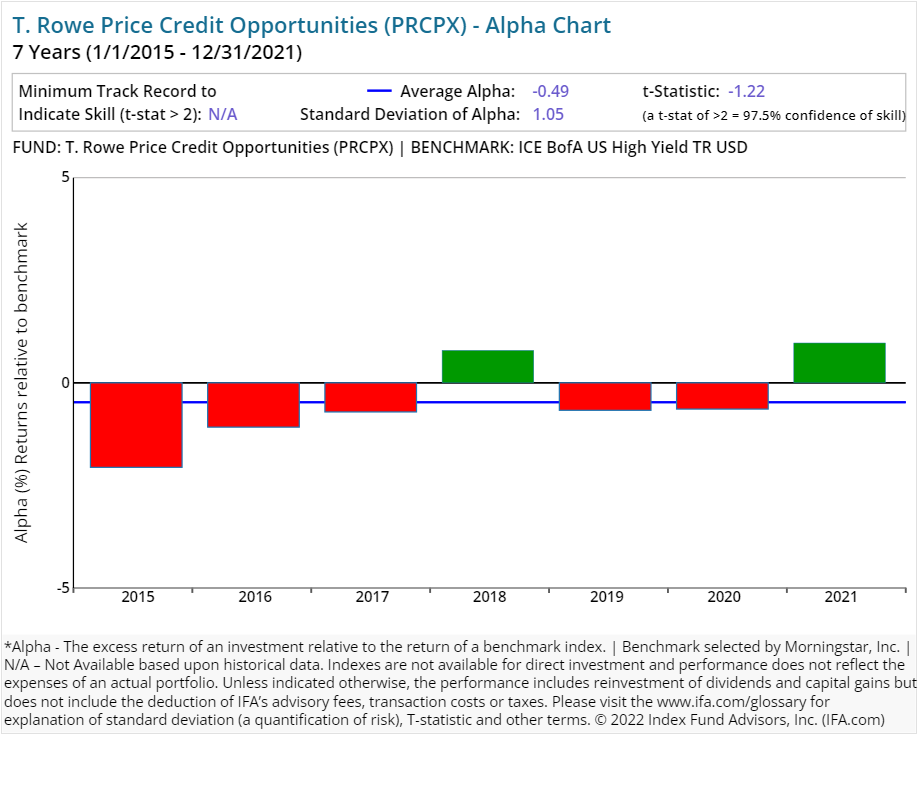
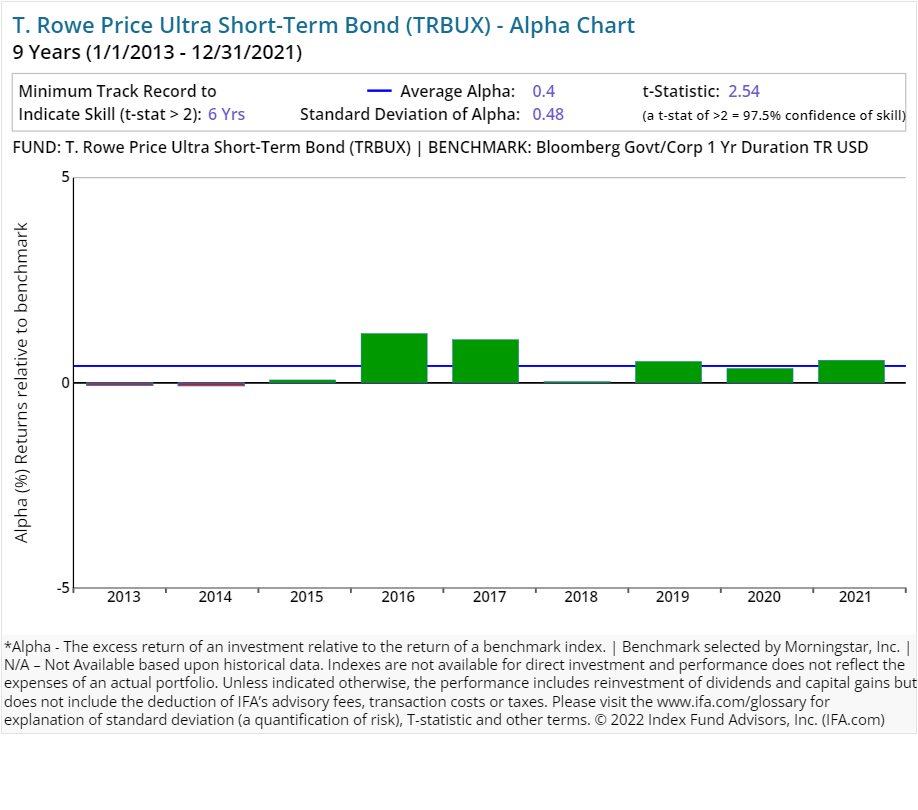
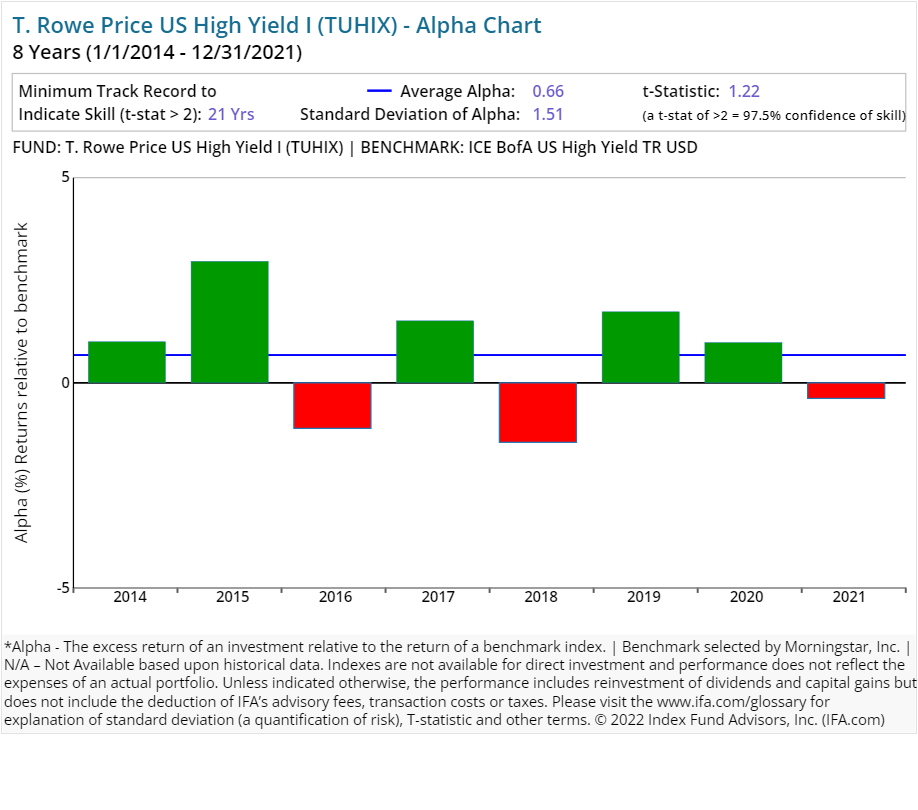
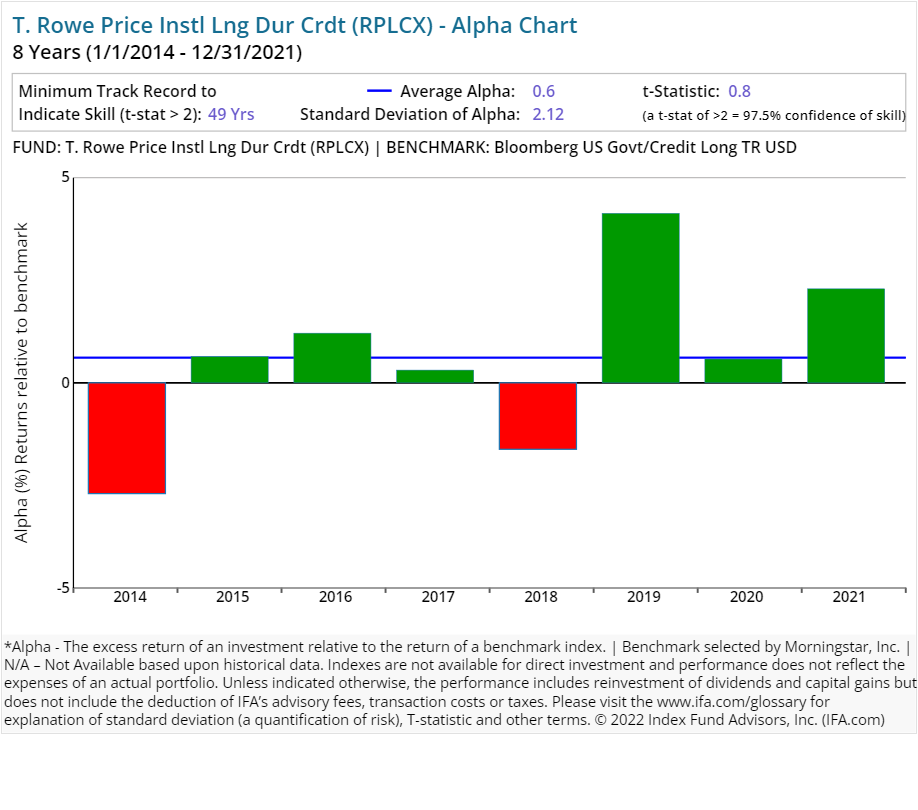
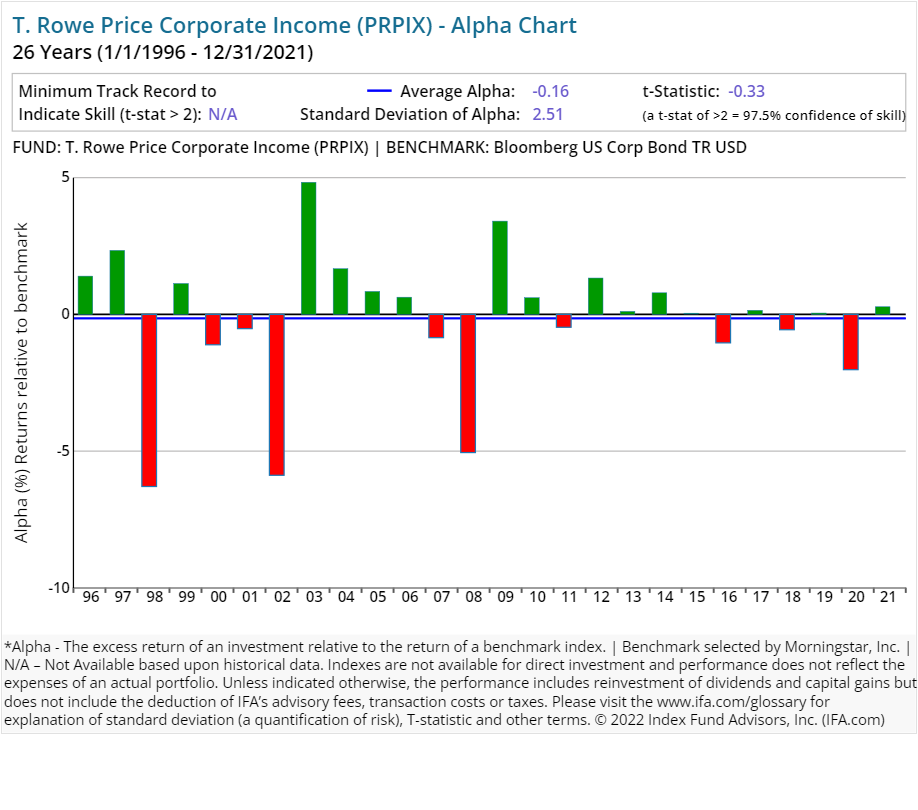
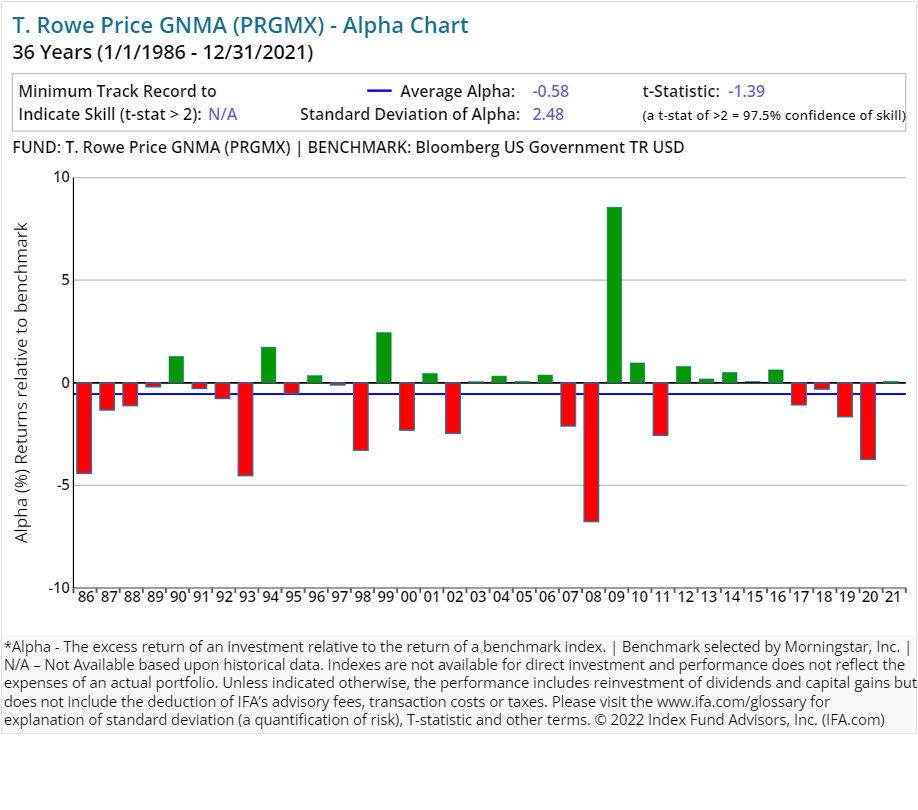
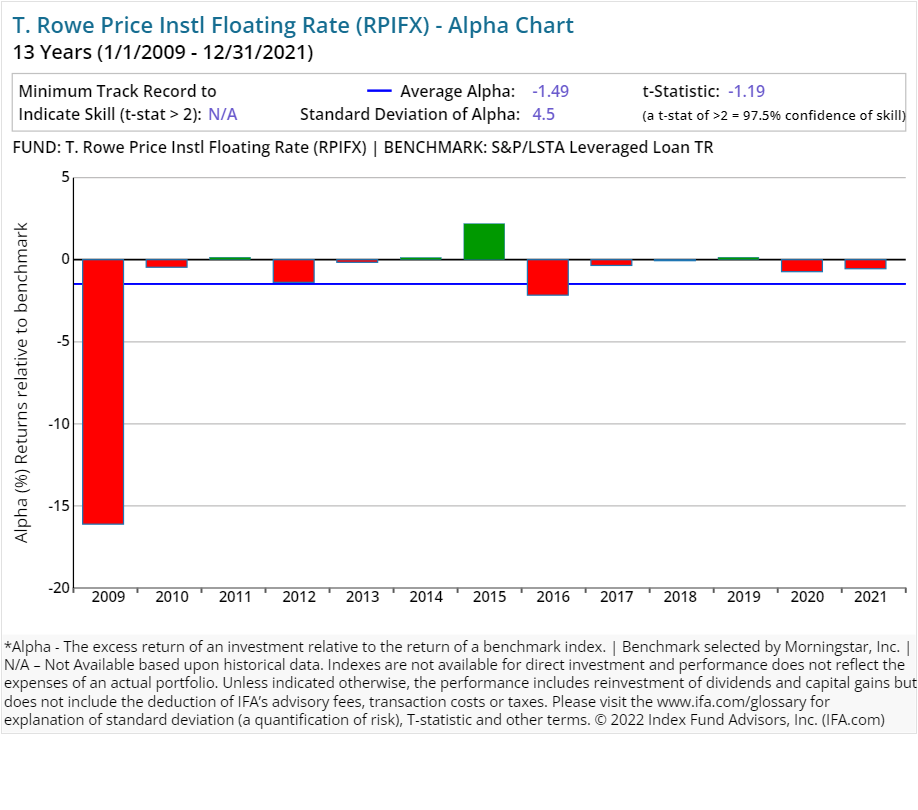
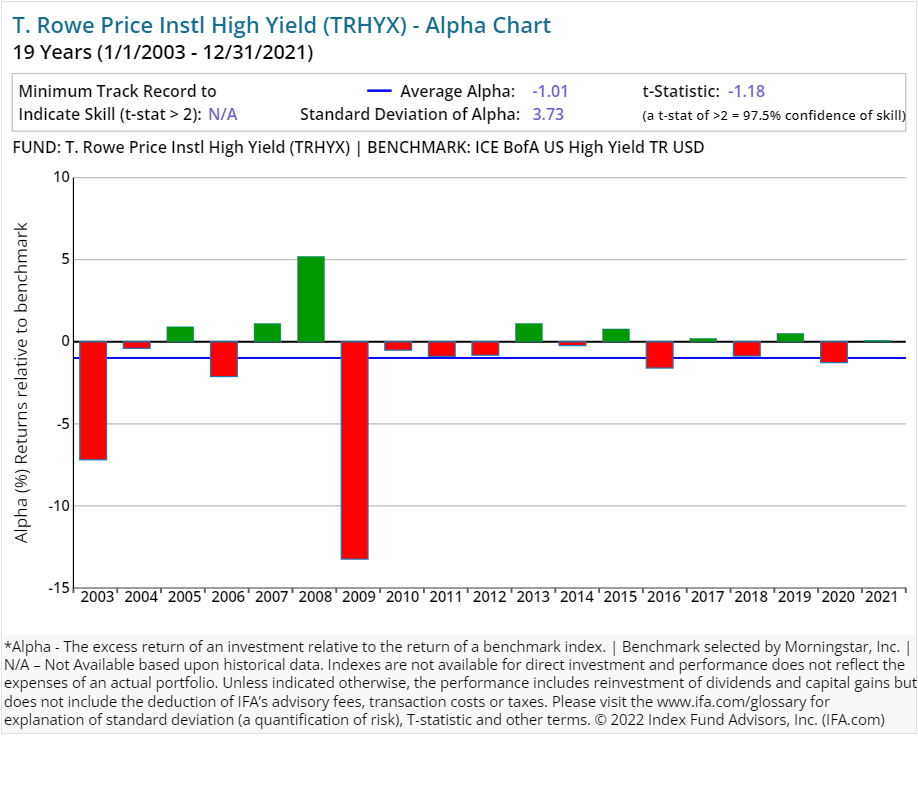
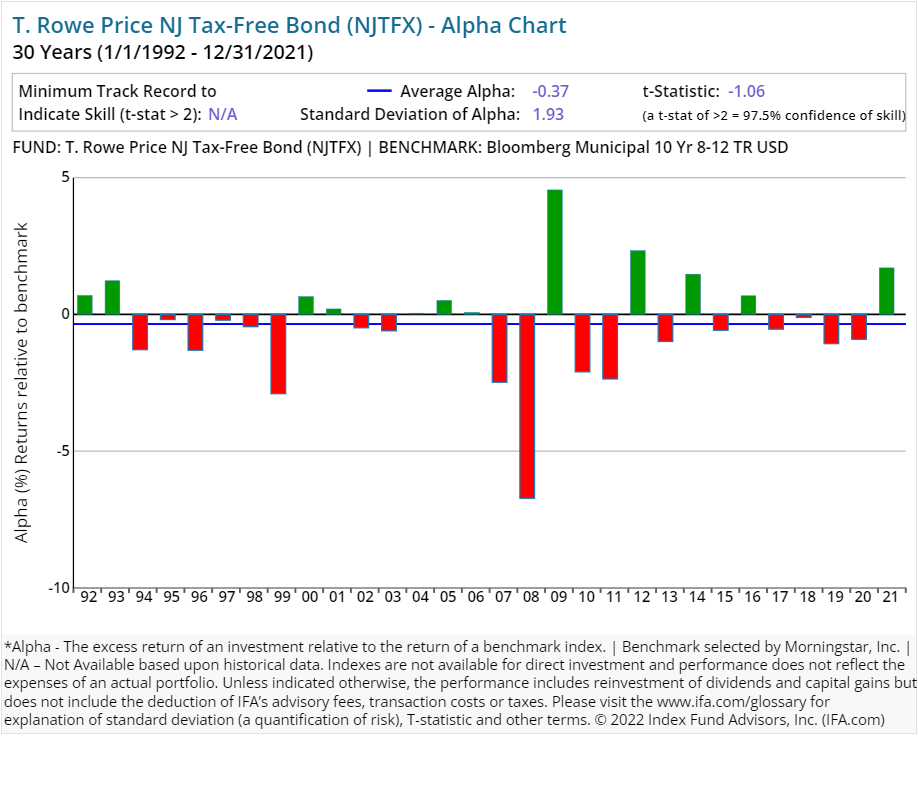
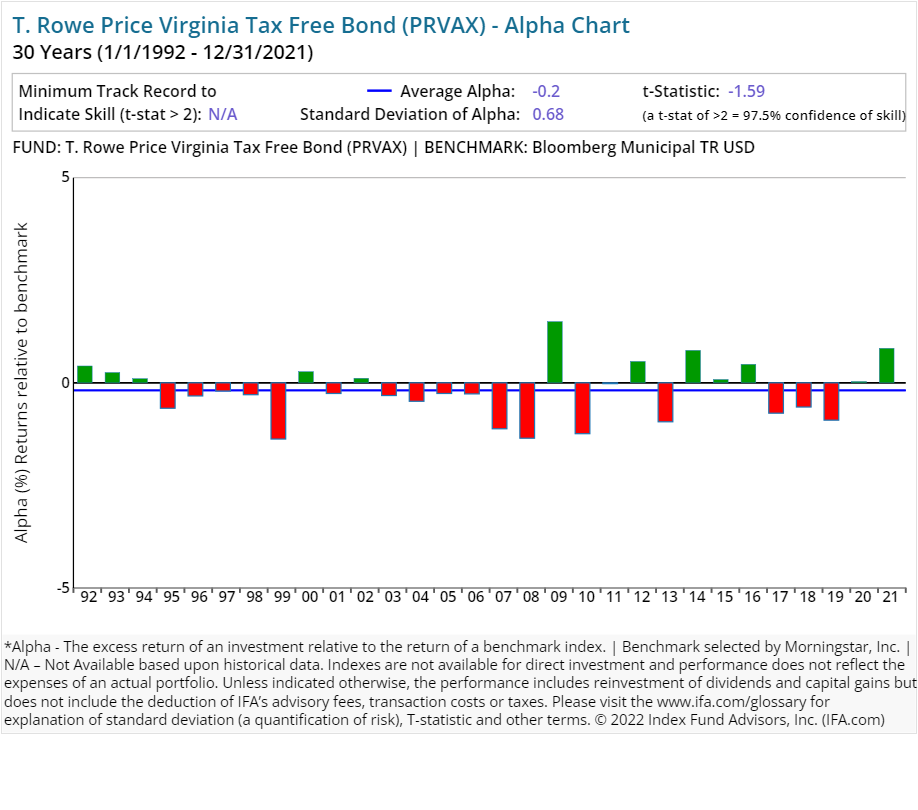
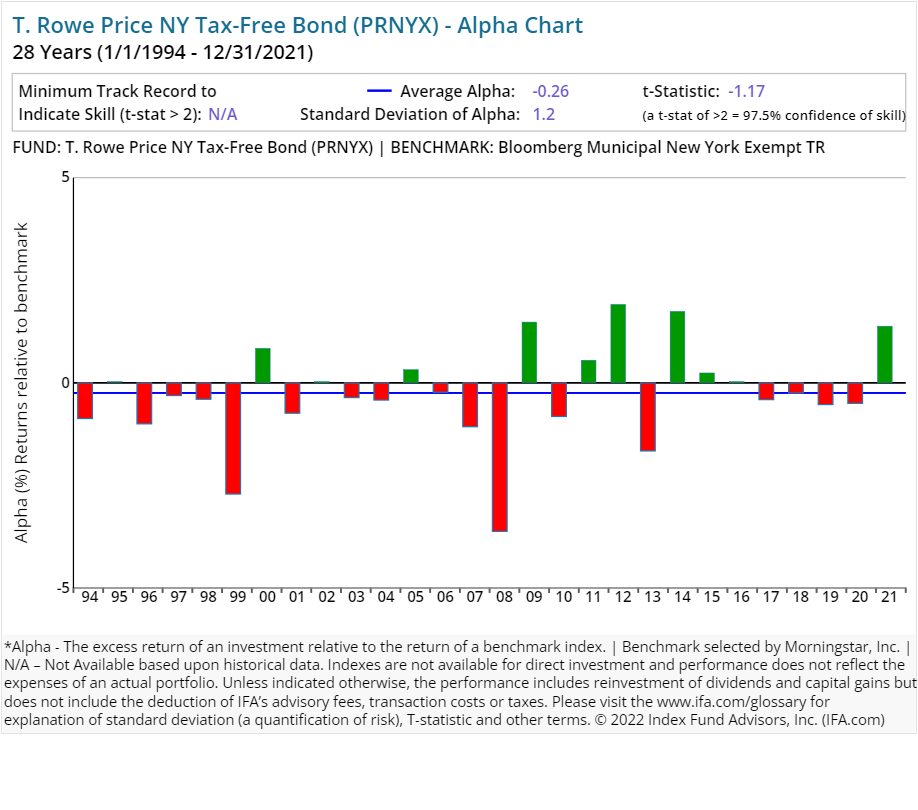
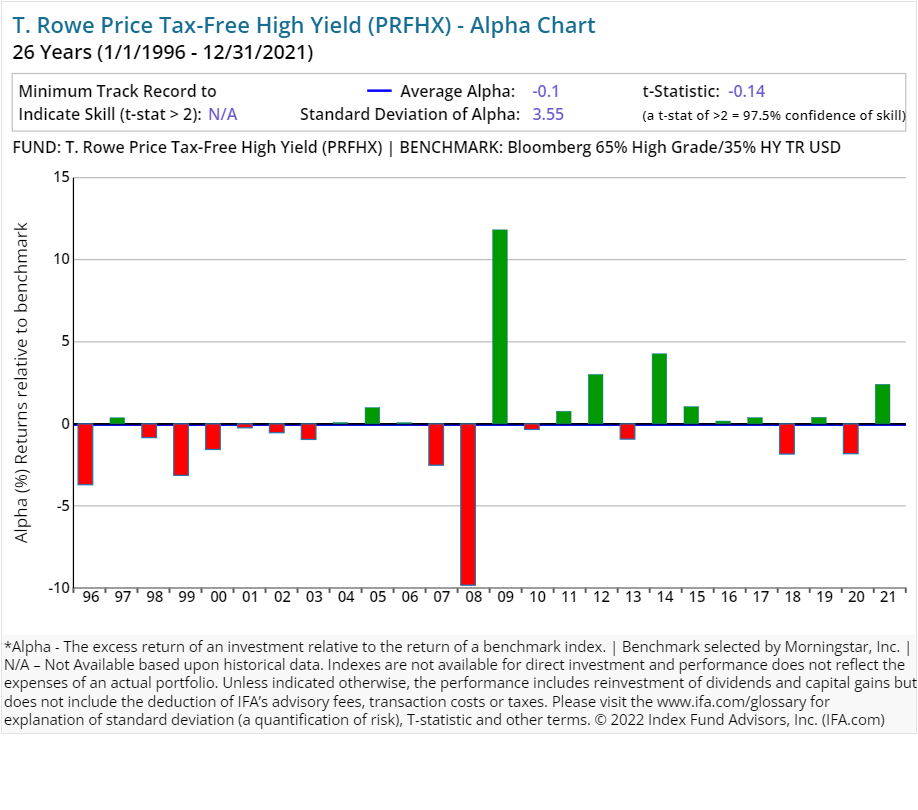
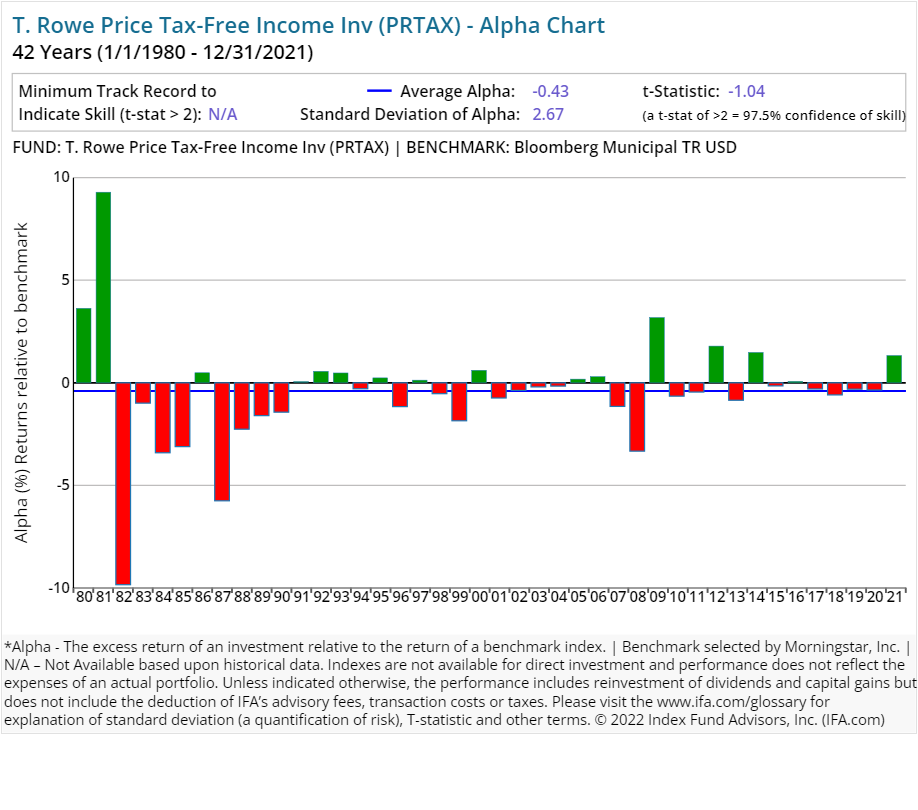
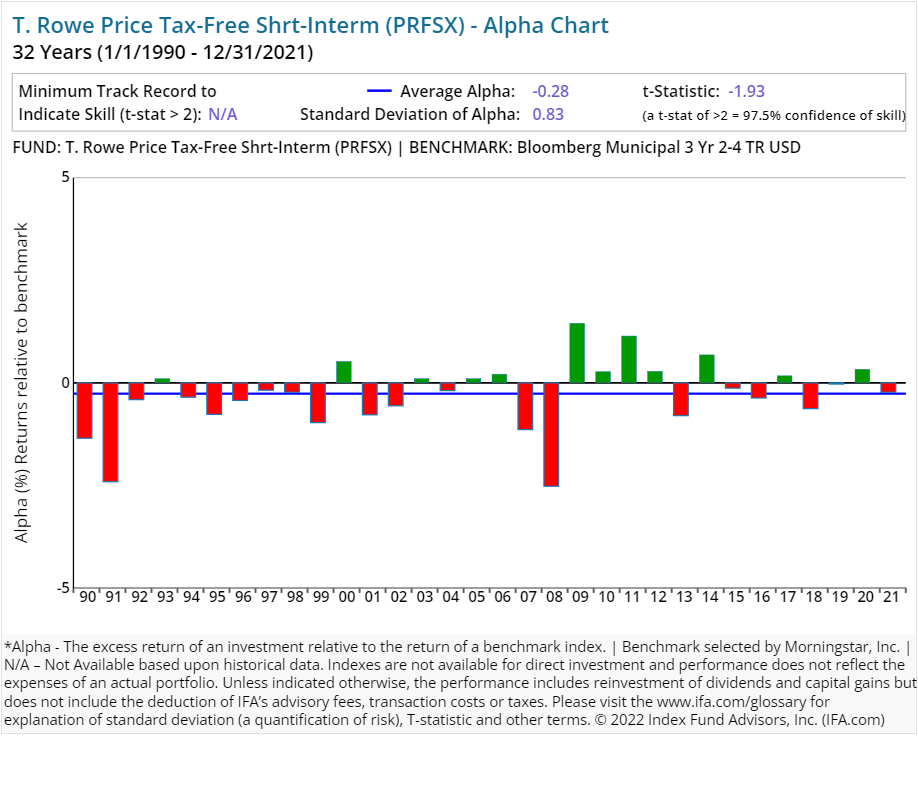
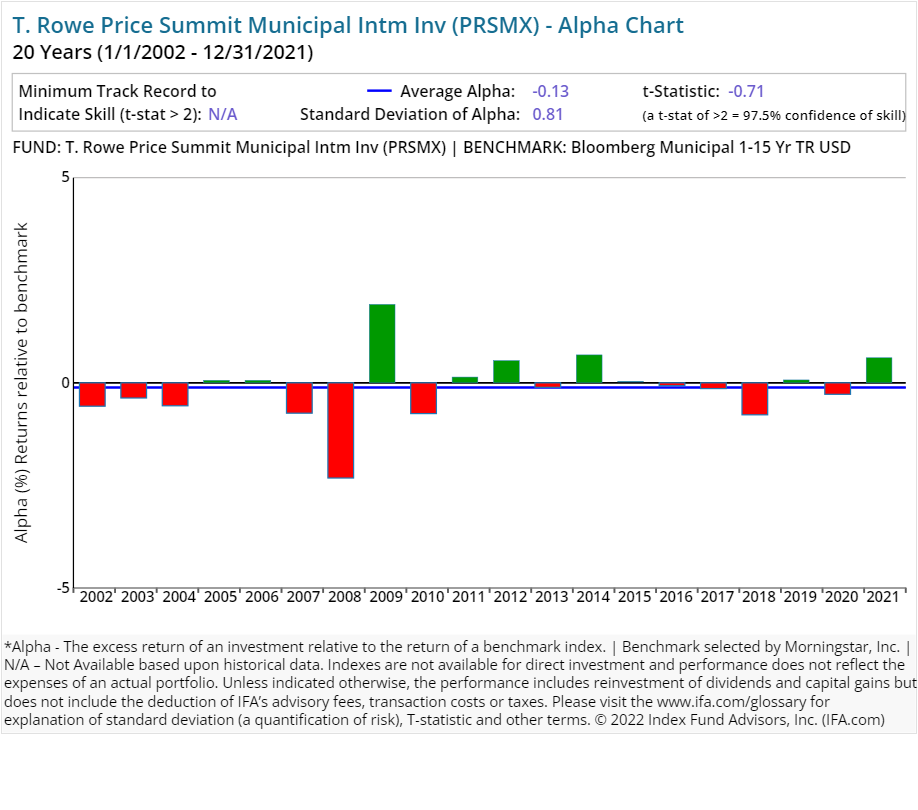
The table below details the hard costs as well as the turnover ratio for all 96 surviving active funds offered by T. Rowe Price that have at least five years of complete performance history. You can search this page for a symbol or name by using Control F in Windows or Command F on a Mac. Then click the link to see the Alpha Chart. Also, remember that this is what is considered an in-sample test; the next level of analysis is to do an out-of-sample test (for more information see here).
| Fund Name | Ticker | Turnover Ratio % | Prospectus Net Expense Ratio | Global Broad Category Group | Global Category |
| T. Rowe Price Multi-Strategy Ttl Ret I | TMSSX | 126.30 | 1.04 | Alternative | Multialternative |
| T. Rowe Price Asia Opportunities | TRAOX | 60.90 | 1.15 | Equity | Asia ex-Japan Equity |
| T. Rowe Price New Asia | PRASX | 54.80 | 1.03 | Equity | Asia ex-Japan Equity |
| T. Rowe Price Comm & Tech Investor | PRMTX | 33.90 | 0.77 | Equity | Communications Sector Equity |
| T. Rowe Price Global Consumer | PGLOX | 18.70 | 1.05 | Equity | Consumer Goods & Services Sector Equity |
| T. Rowe Price Emerging Europe | TREMX | 15.40 | 1.41 | Equity | Equity Miscellaneous |
| T. Rowe Price Africa & Middle East | TRAMX | 40.10 | 1.30 | Equity | Equity Miscellaneous |
| T. Rowe Price European Stock | PRESX | 25.90 | 1.04 | Equity | Europe Equity Large Cap |
| T. Rowe Price Financial Services | PRISX | 30.20 | 0.93 | Equity | Financials Sector Equity |
| T. Rowe Price Em Mkts Discv Stk | PRIJX | 51.10 | 1.13 | Equity | Global Emerging Markets Equity |
| T. Rowe Price Emerging Markets Stock | PRMSX | 64.10 | 1.22 | Equity | Global Emerging Markets Equity |
| T. Rowe Price Instl Emerging Mkts Eq | IEMFX | 553.00 | 1.00 | Equity | Global Emerging Markets Equity |
| T. Rowe Price Glbl Val Eq Cl I | PRIGX | 68.40 | 0.68 | Equity | Global Equity Large Cap |
| T. Rowe Price Integrated Global Eq I | TQGIX | 44.70 | 0.59 | Equity | Global Equity Large Cap |
| T. Rowe Price Intl Disciplined Eq Inv | PRCNX | 107.50 | 0.90 | Equity | Global Equity Large Cap |
| T. Rowe Price Global Stock | PRGSX | 139.20 | 0.80 | Equity | Global Equity Large Cap |
| T. Rowe Price Spectrum International Eq | PSILX | 7.50 | 0.89 | Equity | Global Equity Large Cap |
| T. Rowe Price International Value Eq | TRIGX | 15.90 | 0.87 | Equity | Global Equity Large Cap |
| T. Rowe Price International Stock | PRITX | 31.00 | 0.83 | Equity | Global Equity Large Cap |
| T. Rowe Price Real Assets | PRAFX | 65.10 | 0.95 | Equity | Global Equity Large Cap |
| T. Rowe Price Overseas Stock | TROSX | 8.70 | 0.79 | Equity | Global Equity Large Cap |
| T. Rowe Price Global Growth Stock | RPGEX | 61.50 | 0.92 | Equity | Global Equity Large Cap |
| T. Rowe Price International Discovery | PRIDX | 29.30 | 1.25 | Equity | Global Equity Mid/Small Cap |
| T. Rowe Price China Evolution Equity I | TRCLX | 82.40 | 1.03 | Equity | Greater China Equity |
| T. Rowe Price Health Sciences | PRHSX | 48.40 | 0.80 | Equity | Healthcare Sector Equity |
| T. Rowe Price Global Industrials | RPGIX | 56.10 | 1.05 | Equity | Industrials Sector Equity |
| T. Rowe Price Japan | PRJPX | 67.60 | 1.12 | Equity | Japan Equity |
| T. Rowe Price Latin America | PRLAX | 23.20 | 1.46 | Equity | Latin America Equity |
| T. Rowe Price New Era | PRNEX | 82.80 | 0.75 | Equity | Natural Resources Sector Equity |
| T. Rowe Price Real Estate | TRREX | 9.60 | 0.88 | Equity | Real Estate Sector Equity |
| T. Rowe Price Global Real Estate | TRGRX | 33.20 | 0.95 | Equity | Real Estate Sector Equity |
| T. Rowe Price Science & Tech | PRSCX | 186.30 | 0.81 | Equity | Technology Sector Equity |
| T. Rowe Price Global Technology | PRGTX | 53.90 | 0.94 | Equity | Technology Sector Equity |
| T. Rowe Price Spectrum Diversified Eq | PRSGX | 7.80 | 0.73 | Equity | US Equity Large Cap Blend |
| T. Rowe Price Dividend Growth | PRDGX | 15.90 | 0.64 | Equity | US Equity Large Cap Blend |
| T. Rowe Price U.S. Equity Research | PRCOX | 47.00 | 0.44 | Equity | US Equity Large Cap Blend |
| T. Rowe Price US Large-Cap Core | TRULX | 57.10 | 0.64 | Equity | US Equity Large Cap Blend |
| T. Rowe Price Lrg Cp Gr I | TRLGX | 15.10 | 0.56 | Equity | US Equity Large Cap Growth |
| T. Rowe Price Instl Large Cap Core Gr | TPLGX | 14.50 | 0.57 | Equity | US Equity Large Cap Growth |
| T. Rowe Price Growth Stock | PRGFX | 28.90 | 0.65 | Equity | US Equity Large Cap Growth |
| T. Rowe Price Blue Chip Growth | TRBCX | 9.80 | 0.70 | Equity | US Equity Large Cap Growth |
| T. Rowe Price All-Cap Opportunities Fund | PRWAX | 95.60 | 0.79 | Equity | US Equity Large Cap Growth |
| T. Rowe Price Tax-Efficient Equity | PREFX | 16.18 | 0.83 | Equity | US Equity Large Cap Growth |
| T. Rowe Price Lrg Cp Va I | TILCX | 28.20 | 0.57 | Equity | US Equity Large Cap Value |
| T. Rowe Price Value | TRVLX | 62.30 | 0.71 | Equity | US Equity Large Cap Value |
| T. Rowe Price Equity Income | PRFDX | 16.70 | 0.68 | Equity | US Equity Large Cap Value |
| T. Rowe Price Integrated US LCV Eq I | TQVIX | 64.00 | 0.54 | Equity | US Equity Large Cap Value |
| T. Rowe Price Integrated US SMCC Eq I | TQSIX | 57.10 | 0.69 | Equity | US Equity Mid Cap |
| T. Rowe Price Mid-Cap Growth | RPMGX | 21.70 | 0.76 | Equity | US Equity Mid Cap |
| T. Rowe Price Instl Mid-Cap Equity Gr | PMEGX | 28.60 | 0.61 | Equity | US Equity Mid Cap |
| T. Rowe Price Mid-Cap Value | TRMCX | 45.30 | 0.85 | Equity | US Equity Mid Cap |
| T. Rowe Price New Horizons | PRNHX | 54.80 | 0.78 | Equity | US Equity Mid Cap |
| T. Rowe Price Diversified Mid Cap Gr | PRDMX | 49.70 | 0.86 | Equity | US Equity Mid Cap |
| T. Rowe Price Instl Small-Cap Stock | TRSSX | 26.20 | 0.66 | Equity | US Equity Small Cap |
| T. Rowe Price Small-Cap Value | PRSVX | 27.50 | 0.80 | Equity | US Equity Small Cap |
| T. Rowe Price Integrated US Sm Gr Eq | PRDSX | 37.10 | 0.80 | Equity | US Equity Small Cap |
| T. Rowe Price Small-Cap Stock | OTCFX | 28.20 | 0.90 | Equity | US Equity Small Cap |
| T. Rowe Price Emerg Mkts Lcl Ccy Bd | PRELX | 107.60 | 1.02 | Fixed Income | Emerging Markets Fixed Income |
| T. Rowe Price Emerging Markets Bond | PREMX | 23.00 | 0.98 | Fixed Income | Emerging Markets Fixed Income |
| T. Rowe Price Emerging Mkts Corp Bd | TRECX | 46.30 | 0.88 | Fixed Income | Emerging Markets Fixed Income |
| T. Rowe Price Dynamic Credit I | RPELX | 146.50 | 0.57 | Fixed Income | Fixed Income Miscellaneous |
| T. Rowe Price Dynamic Global Bond Inv | RPIEX | 122.20 | 0.72 | Fixed Income | Fixed Income Miscellaneous |
| T. Rowe Price International Bond | RPIBX | 68.10 | 0.67 | Fixed Income | Global Fixed Income |
| T. Rowe Price Global High Income Bd | RPIHX | 51.70 | 0.75 | Fixed Income | Global Fixed Income |
| T. Rowe Price Intl Bd (USD Hdgd) I | TNBMX | 68.90 | 0.54 | Fixed Income | Global Fixed Income |
| T. Rowe Price Global Multi-Sector Bd Inv | PRSNX | 228.70 | 0.67 | Fixed Income | Global Fixed Income |
| T. Rowe Price QM U.S. Bond Index Fund | PBDIX | 78.10 | 0.25 | Fixed Income | US Fixed Income |
| T. Rowe Price Spectrum Income | RPSIX | 23.60 | 0.62 | Fixed Income | US Fixed Income |
| T. Rowe Price Short-Term Bond | PRWBX | 92.30 | 0.47 | Fixed Income | US Fixed Income |
| T. Rowe Price New Income | PRCIX | 179.30 | 0.44 | Fixed Income | US Fixed Income |
| T. Rowe Price High Yield | PRHYX | 37.90 | 0.70 | Fixed Income | US Fixed Income |
| T. Rowe Price Total Return I | PTKIX | 255.20 | 0.34 | Fixed Income | US Fixed Income |
| T. Rowe Price Floating Rate | PRFRX | 77.90 | 0.77 | Fixed Income | US Fixed Income |
| T. Rowe Price Credit Opportunities | PRCPX | 36.20 | 0.81 | Fixed Income | US Fixed Income |
| T. Rowe Price Ultra Short-Term Bond | TRBUX | 82.00 | 0.31 | Fixed Income | US Fixed Income |
| T. Rowe Price US High Yield I | TUHIX | 87.00 | 0.61 | Fixed Income | US Fixed Income |
| T. Rowe Price Instl Lng Dur Crdt | RPLCX | 59.30 | 0.45 | Fixed Income | US Fixed Income |
| T. Rowe Price Corporate Income | PRPIX | 90.70 | 0.59 | Fixed Income | US Fixed Income |
| T. Rowe Price GNMA | PRGMX | 304.50 | 0.62 | Fixed Income | US Fixed Income |
| T. Rowe Price Instl Floating Rate | RPIFX | 78.50 | 0.57 | Fixed Income | US Fixed Income |
| T. Rowe Price Instl High Yield | TRHYX | 38.40 | 0.50 | Fixed Income | US Fixed Income |
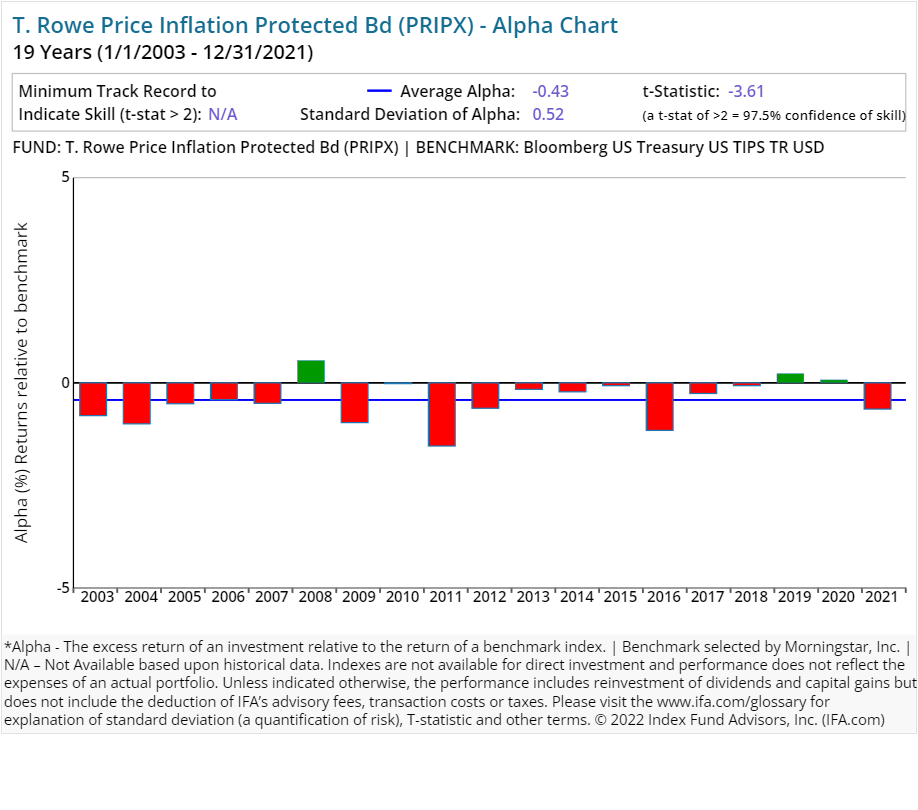
| T. Rowe Price Inflation Protected Bd | PRIPX | 160.50 | 0.41 | Fixed Income | US Fixed Income |
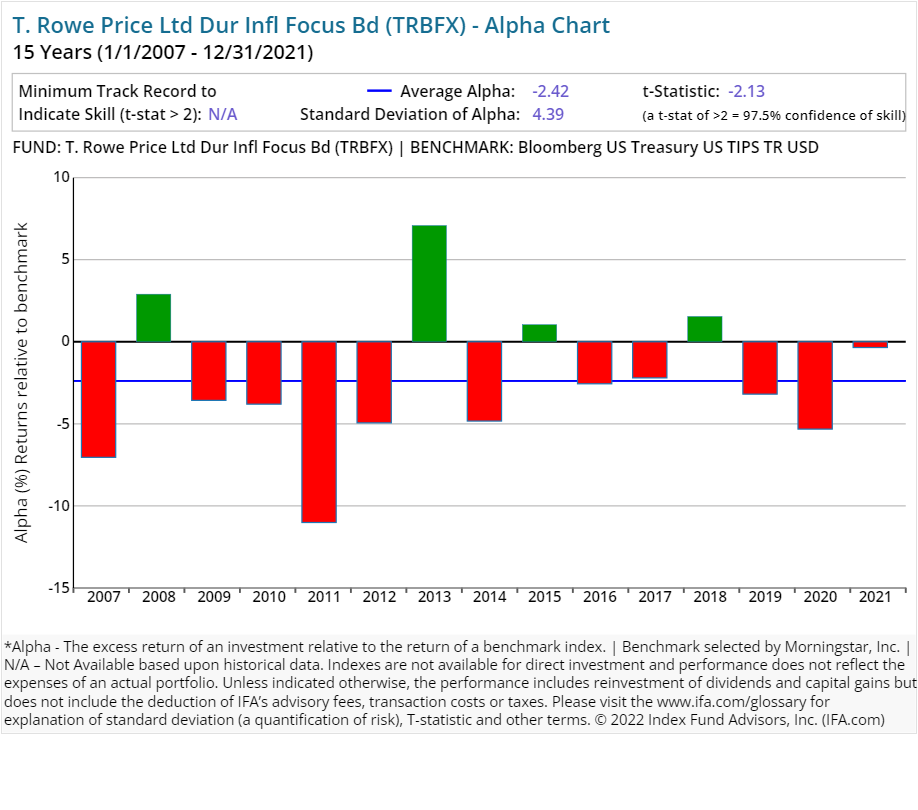
| T. Rowe Price Ltd Dur Infl Focus Bd | TRBFX | 123.50 | 0.50 | Fixed Income | US Fixed Income |
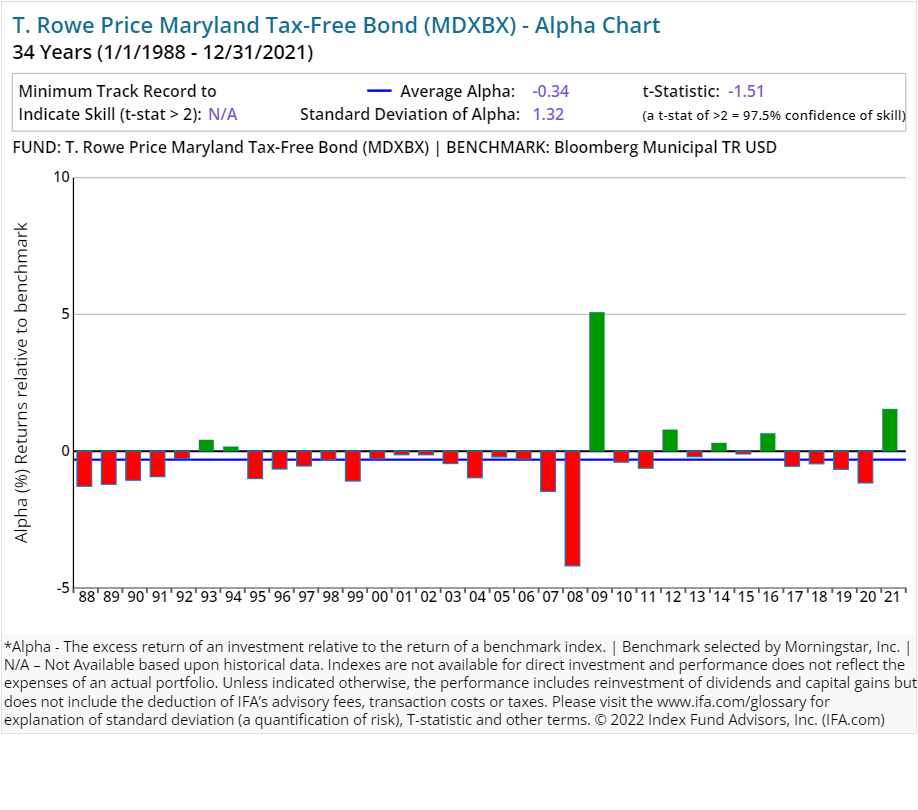
| T. Rowe Price Maryland Tax-Free Bond | MDXBX | 25.70 | 0.49 | Fixed Income | US Municipal Fixed Income |
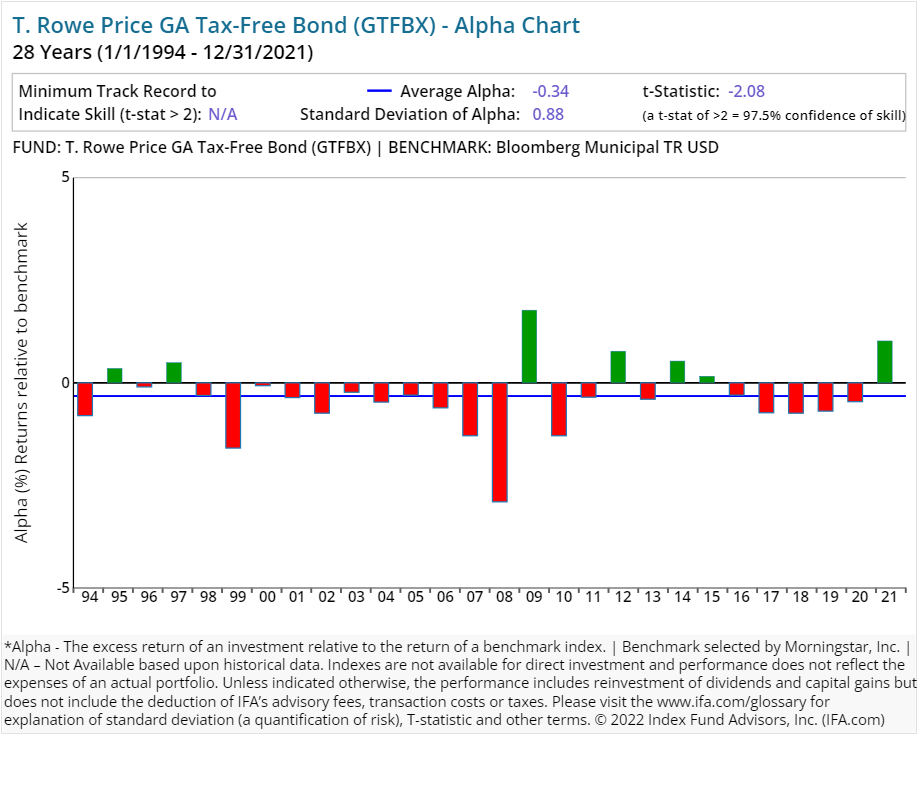
| T. Rowe Price GA Tax-Free Bond | GTFBX | 34.80 | 0.56 | Fixed Income | US Municipal Fixed Income |
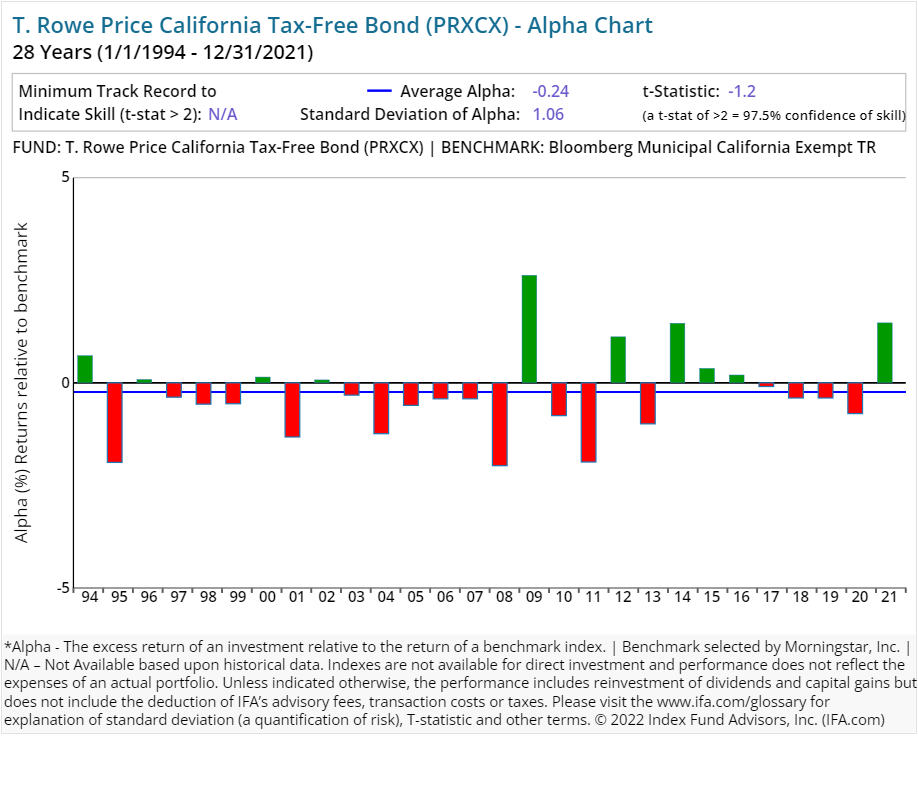
| T. Rowe Price California Tax-Free Bond | PRXCX | 12.00 | 0.57 | Fixed Income | US Municipal Fixed Income |
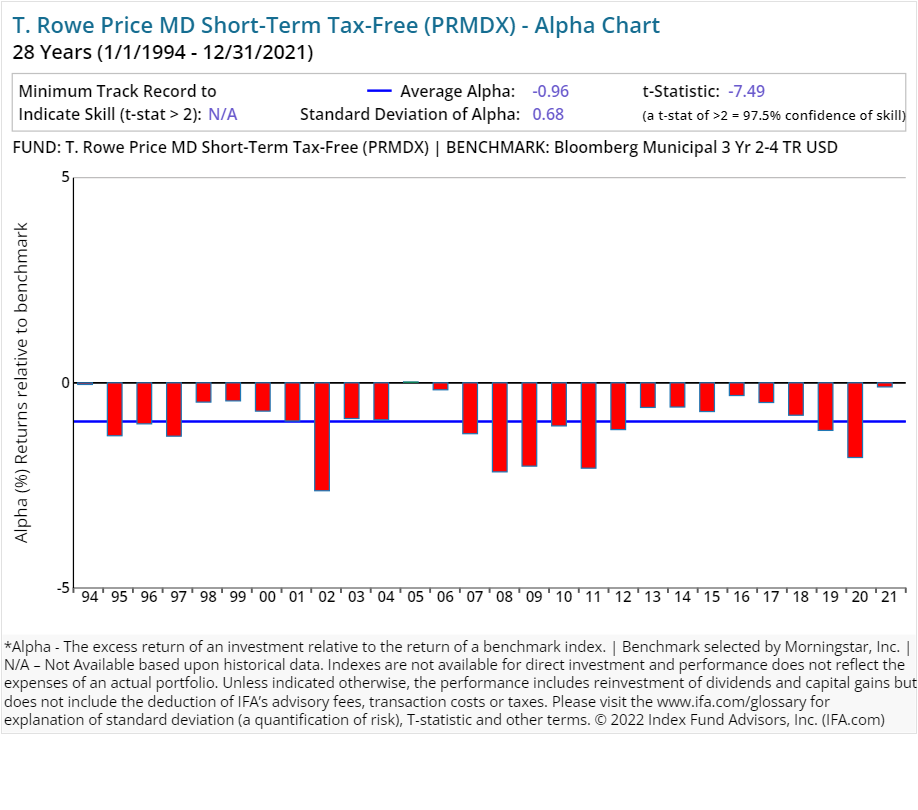
| T. Rowe Price MD Short-Term Tax-Free | PRMDX | 45.80 | 0.53 | Fixed Income | US Municipal Fixed Income |
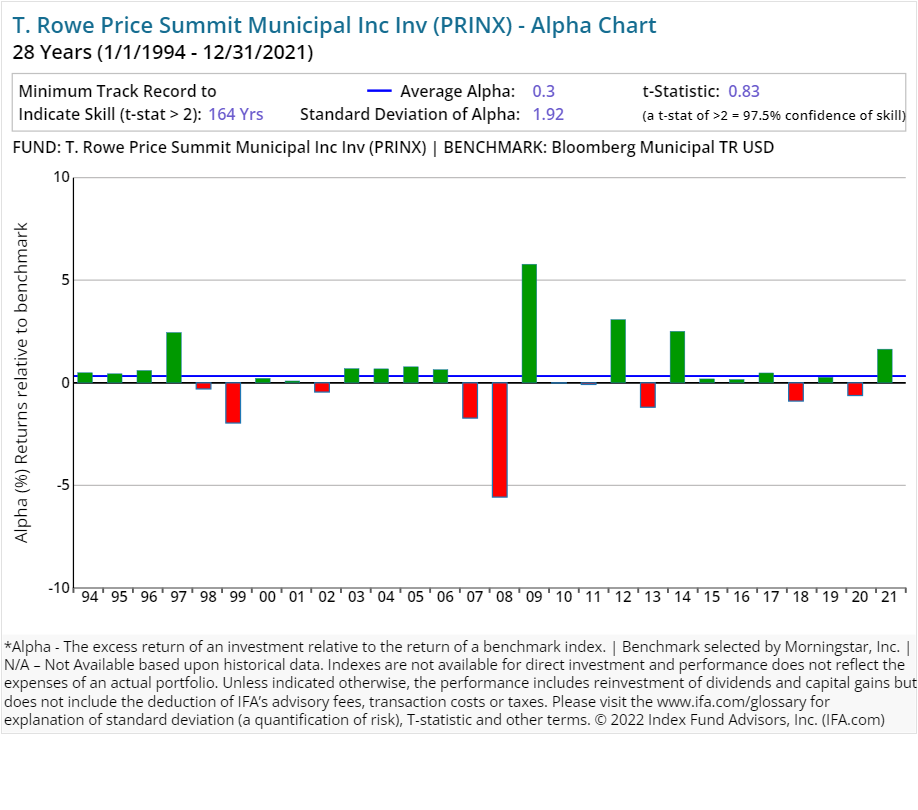
| T. Rowe Price Summit Municipal Inc Inv | PRINX | 16.20 | 0.45 | Fixed Income | US Municipal Fixed Income |
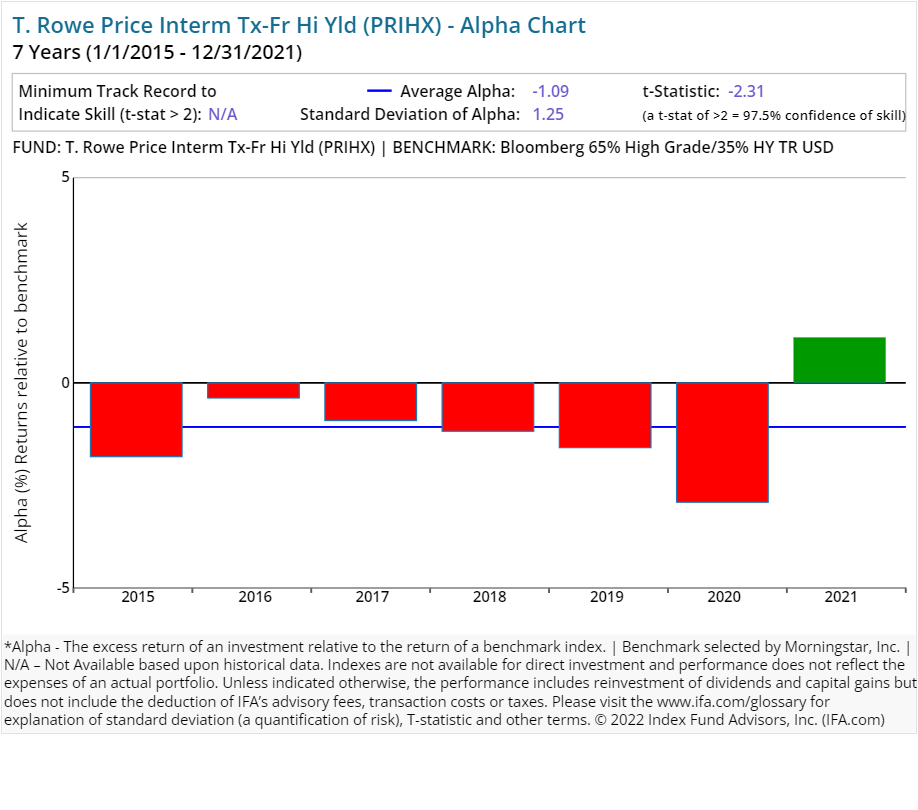
| T. Rowe Price Interm Tx-Fr Hi Yld | PRIHX | 12.10 | 0.46 | Fixed Income | US Municipal Fixed Income |
| T. Rowe Price NJ Tax-Free Bond | NJTFX | 15.00 | 0.57 | Fixed Income | US Municipal Fixed Income |
| T. Rowe Price Virginia Tax Free Bond | PRVAX | 28.00 | 0.55 | Fixed Income | US Municipal Fixed Income |
| T. Rowe Price NY Tax-Free Bond | PRNYX | 22.70 | 0.53 | Fixed Income | US Municipal Fixed Income |
| T. Rowe Price Tax-Free High Yield | PRFHX | 11.60 | 0.63 | Fixed Income | US Municipal Fixed Income |
| T. Rowe Price Tax-Free Income Inv | PRTAX | 25.00 | 0.41 | Fixed Income | US Municipal Fixed Income |
| T. Rowe Price Tax-Free Shrt-Interm | PRFSX | 28.80 | 0.38 | Fixed Income | US Municipal Fixed Income |
| T. Rowe Price Summit Municipal Intm Inv | PRSMX | 20.80 | 0.40 | Fixed Income | US Municipal Fixed Income |
Please read the prospectus carefully to review the investment objectives, risks, charges and expenses of the mutual funds before investing. T. Rowe Price prospectuses are available at https://www.troweprice.com/corporate/en/prospectuses.html
On average, an investor who utilized an active equity strategy from T. Rowe Price experienced a 0.86% expense ratio. Similarly, an investor who utilized an active bond strategy from the company experienced a 0.57% expense ratio.
These expenses can have a substantial impact on an investor's overall accumulated wealth if they are not backed by superior performance. The average turnover ratios for active equity and bond strategies from T. Rowe Price were 54% and 76%, respectively. This implies an average holding period of 15.78 to 22.21 months.
In contrast, most index funds have very long holding periods — decades, in fact, thus deafening themselves to the random noise that accompanies short-term market movements, and focusing instead on the long-term. Again, turnover is a cost that is not itemized to the investor but is definitely embedded in a fund's overall performance.
Performance Analysis
The next question we address is whether investors can expect superior performance in exchange for the higher costs associated with T. Rowe Price's implementation of active management. We compare each of its 120 strategies, which includes both current funds and funds no longer in existence, against its Morningstar assigned benchmark to see just how well each has delivered on their perceived value proposition.
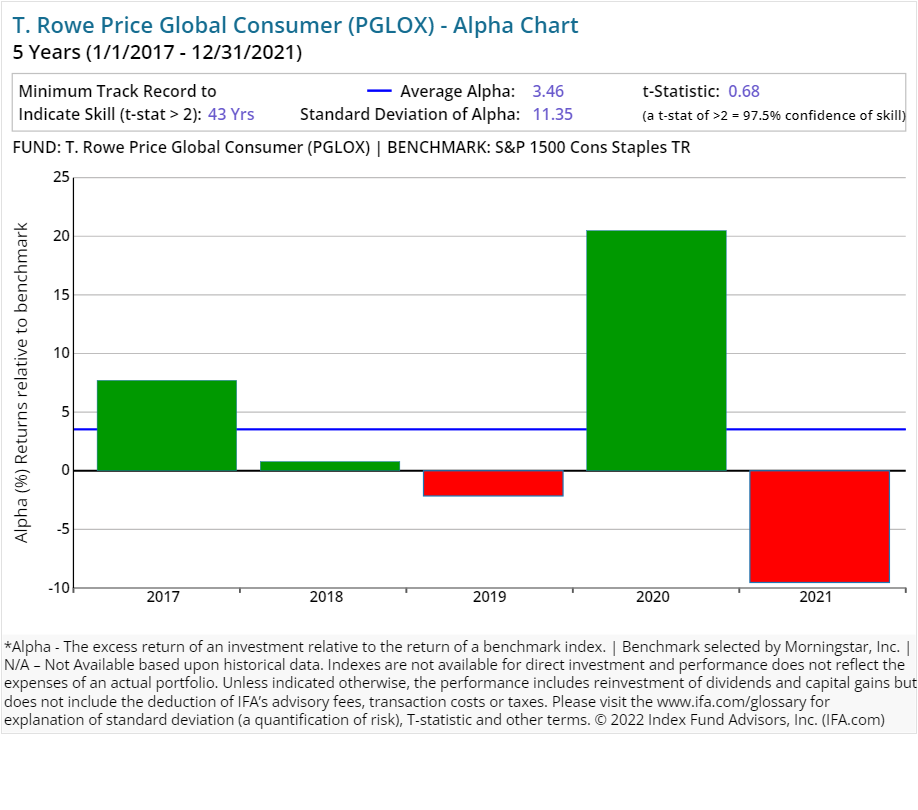
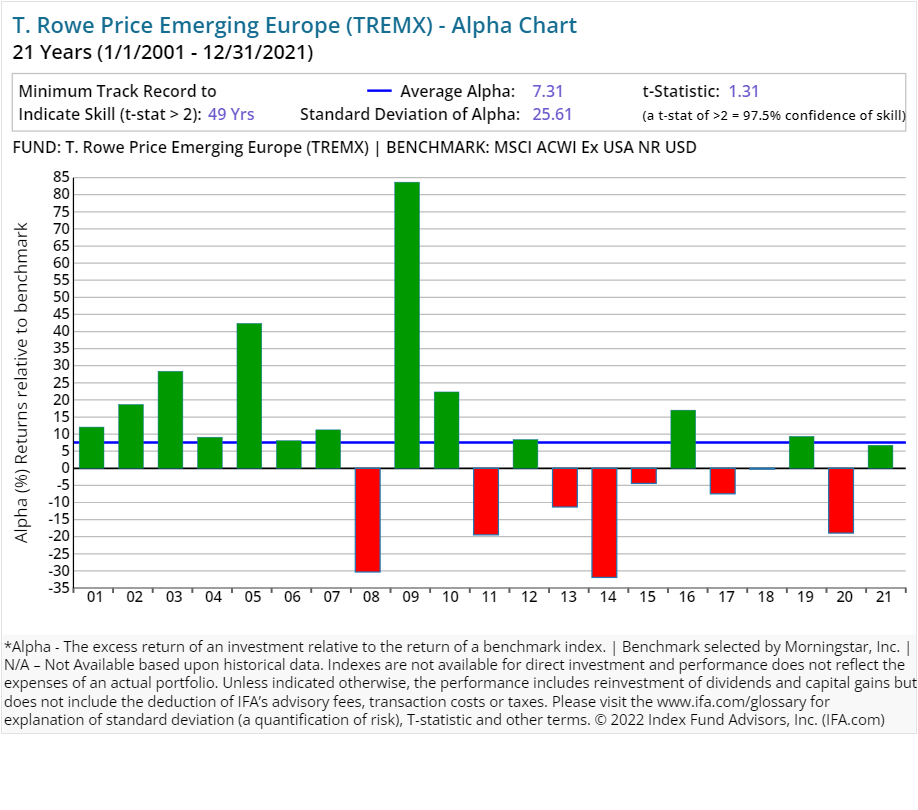
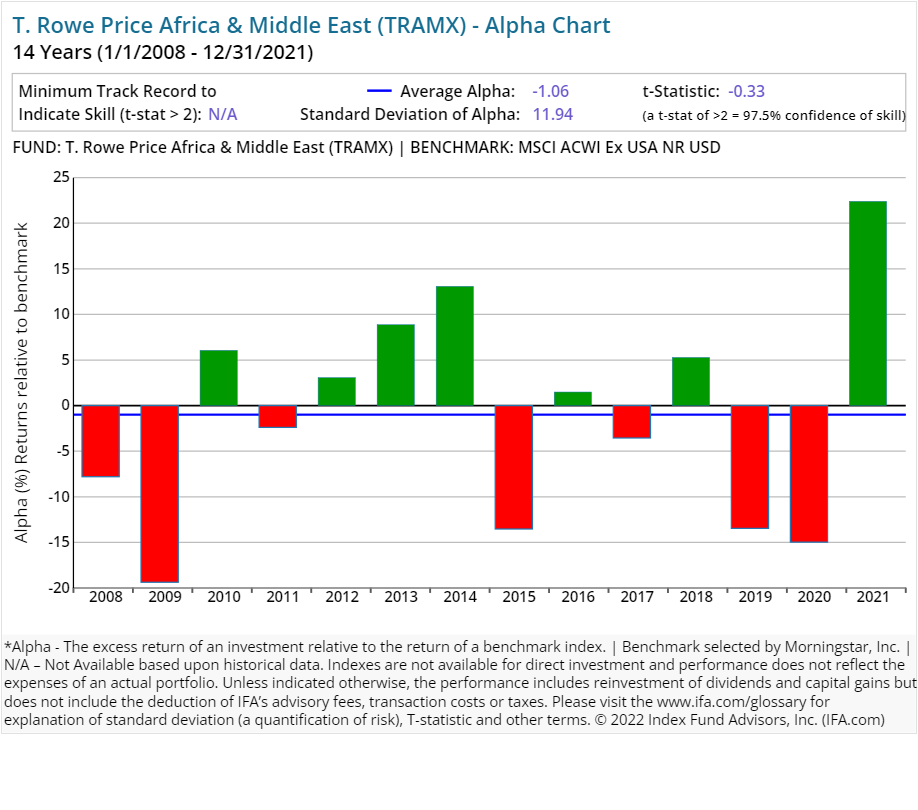
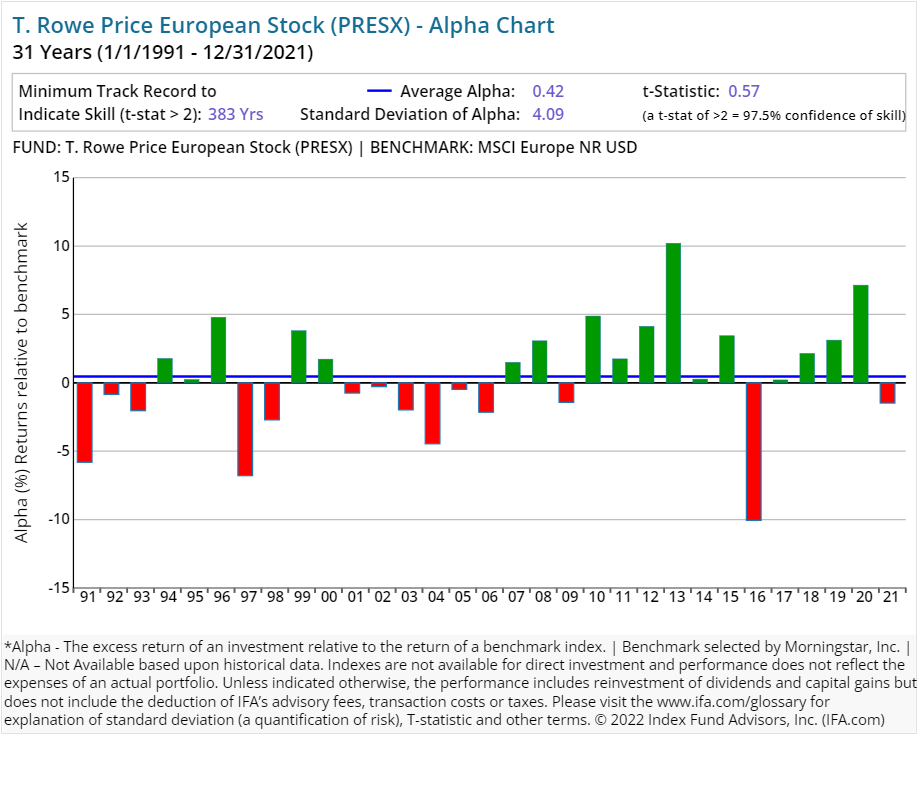
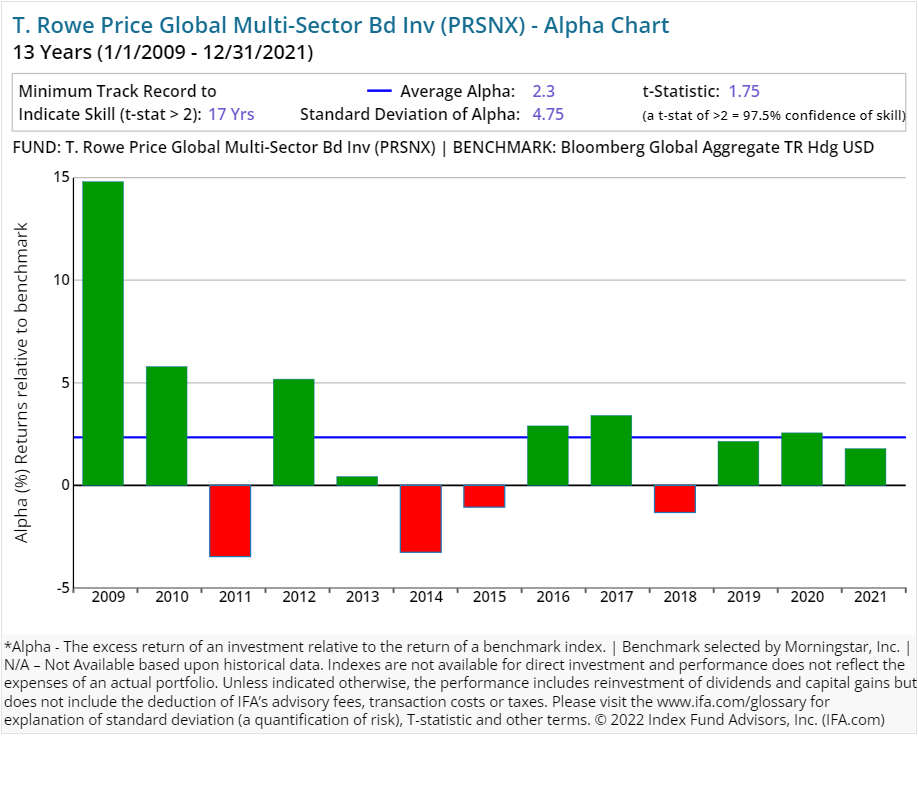
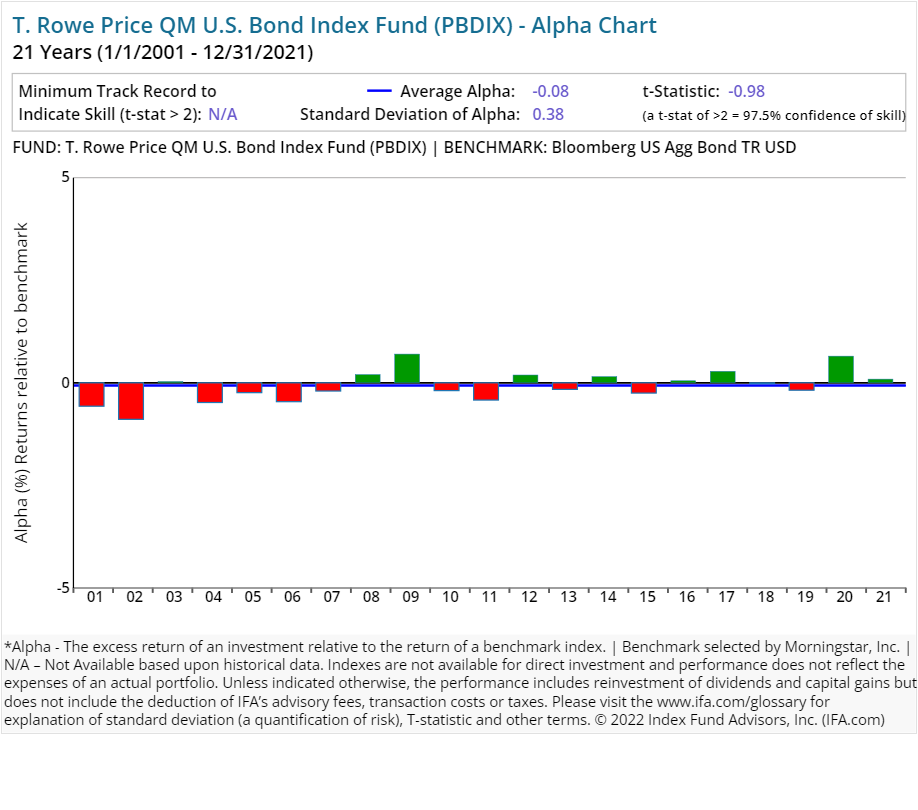
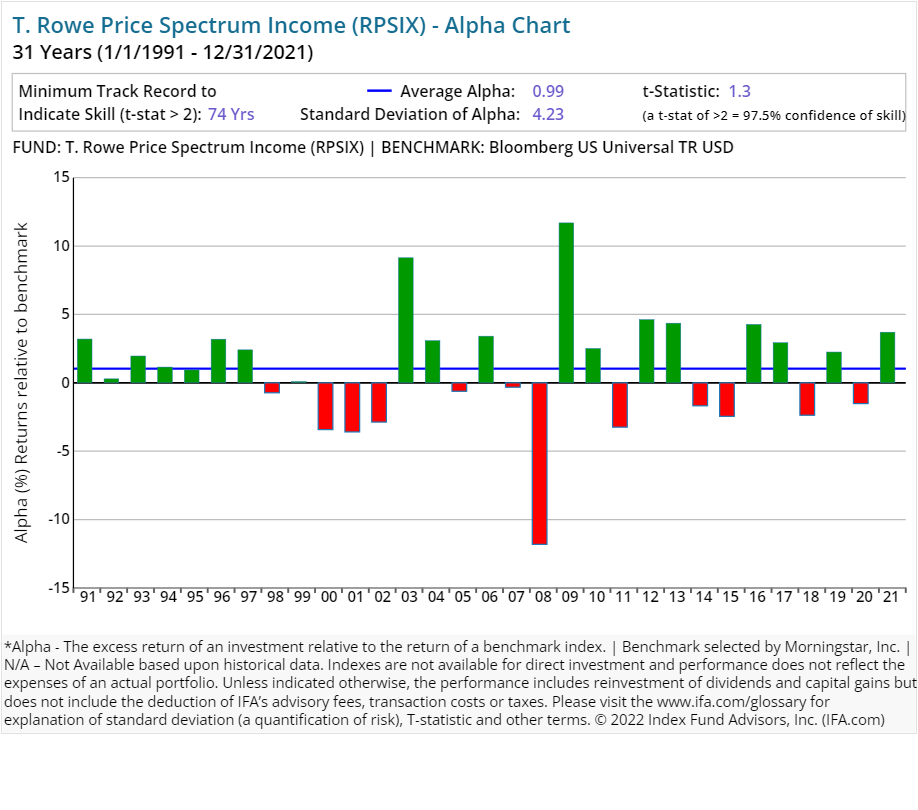
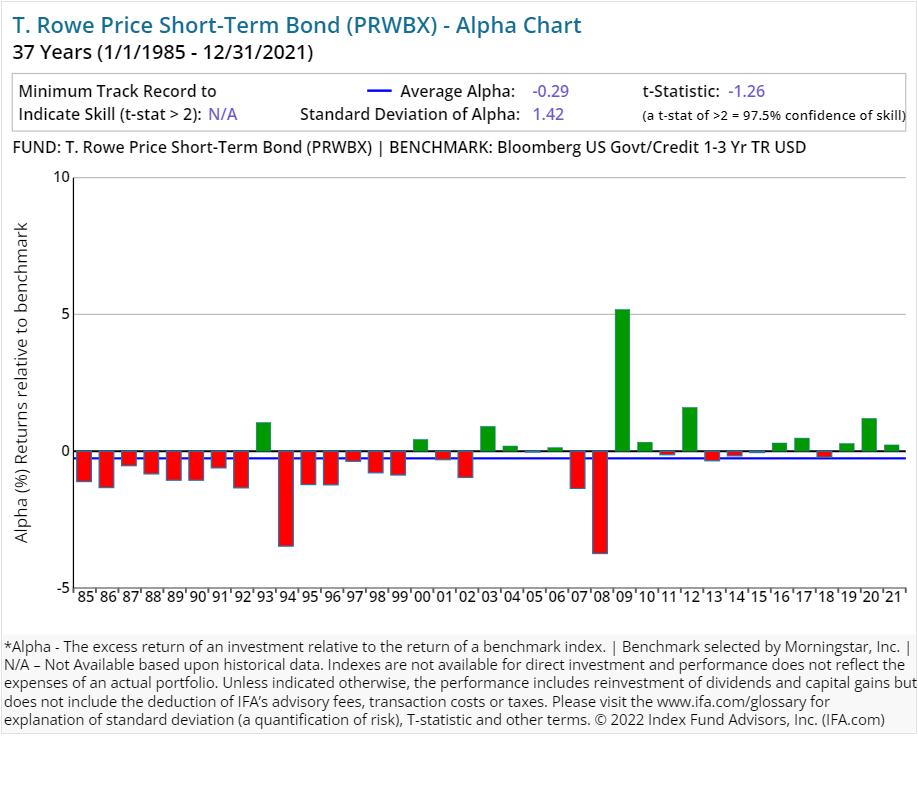
We have included alpha charts for each of their current strategies at the bottom of this article. Here is what we found:
-
61.67% (74 of 120 funds) have underperformed their respective benchmarks or did not survive the period since inception.
-
38.33% (46 of 120 funds) have outperformed their respective benchmarks since inception, having delivered a POSITIVE alpha.
Here's the real kicker, however:
- 3.33% (4 of 120 funds) have outperformed their respective benchmarks consistently enough since inception to provide 97.5% confidence that such outperformance will persist as opposed to being based on random outcomes.
As a result, this study shows that a majority of funds offered by T. Rowe Price have not outperformed their Morningstar-assigned benchmark. The inclusion of the statistical significance of alpha is key to this exercise, as it indicates which outcomes are due to a skill that is likely to repeat and those that are more likely due to a random-chance outcome.
Regression Analysis
How we define or choose a benchmark is extremely important. If we relied solely on commercial indexes assigned by Morningstar, then we may form a false conclusion that T. Rowe Price has the "secret sauce" as active managers.
Since Morningstar is limited in terms of trying to fit the best commercial benchmark with each fund in existence, there is of course going to be some error in terms of matching up proper characteristics such as average market capitalization or average price-to-earnings ratio.
A better way of controlling these possible discrepancies is to run multiple regressions where we account for the known dimensions (betas) of expected return in the U.S. (i.e., market, size, relative price, etc.).
For example, if we were to look at all of the U.S.-based strategies from T. Rowe Price that've been around for the past 10 years, we could run multiple regressions to see what each fund's alpha looks like once we control for the multiple betas that are being systematically priced into the overall market.
The chart below displays the average alpha and standard deviation of that alpha for the past 10 years through 2024. Screening criteria includes funds with holdings of 90% or greater in U.S. equities and uses the oldest available share classes.
As shown above, although 10 mutual funds had a positive excess return over the stated benchmarks, none produced a statistically significant level of alpha, based on a t-stat of 2.0 or greater. (For a review of how to calculate a fund's t-stat, see the section of this study that follows the individual Franklin Templeton alpha charts.)
Why is this important? Given the lower costs associated with index funds, we'd have greater confidence of experiencing a more desirable result using a passively managed portfolio of funds compared to one constructed around more expensive actively managed funds.
Conclusion
Like many of the other largest financial institutions, a deep analysis into the performance of T. Rowe Price has yielded a not so surprising result: Active management is likely to fail many investors. We believe this is due to market efficiency, costs and increased competition in the financial services sector.
As we always like to remind investors, a more reliable investment strategy for capturing the returns of global markets is to buy, hold and rebalance a globally diversified portfolio of index funds.
Below are the individual alpha charts for the existing T. Rowe Price actively managed mutual funds that have five years or more of a track record.
T-Stat Charts
Here is a calculator to determine the t-stat. Don't trust an alpha or average return without one.
The Figure below shows the formula to calculate the number of years needed for a t-stat of 2. We first determine the excess return over a benchmark (the alpha) then determine the regularity of the excess returns by calculating the standard deviation of those returns. Based on these two numbers, we can then calculate how many years we need (sample size) to support the manager's claim of skill.
Footnotes:
1.) Morningstar, analyst Greggory Warren, T. Rowe Price quarterly review, May 5, 2025.
2.) Morningstar, analyst Greggory Warren, T. Rowe Price quarterly review, Feb 5, 2025.
This is not to be construed as an offer, solicitation, recommendation, or endorsement of any particular security, product or service. There is no guarantee investment strategies will be successful. Investing involves risks, including possible loss of principal. Performance may contain both live and back-tested data. Data is provided for illustrative purposes only, it does not represent actual performance of any client portfolio or account and it should not be interpreted as an indication of such performance. IFA Index Portfolios are recommended based on time horizon and risk tolerance. Take the IFA Risk Capacity Survey (www.ifa.com/survey) to determine which portfolio captures the right mix of stock and bond funds best suited to you. For more information about Index Fund Advisors, Inc, please review our brochure at https://www.adviserinfo.sec.gov/ or visit www.ifa.com.

