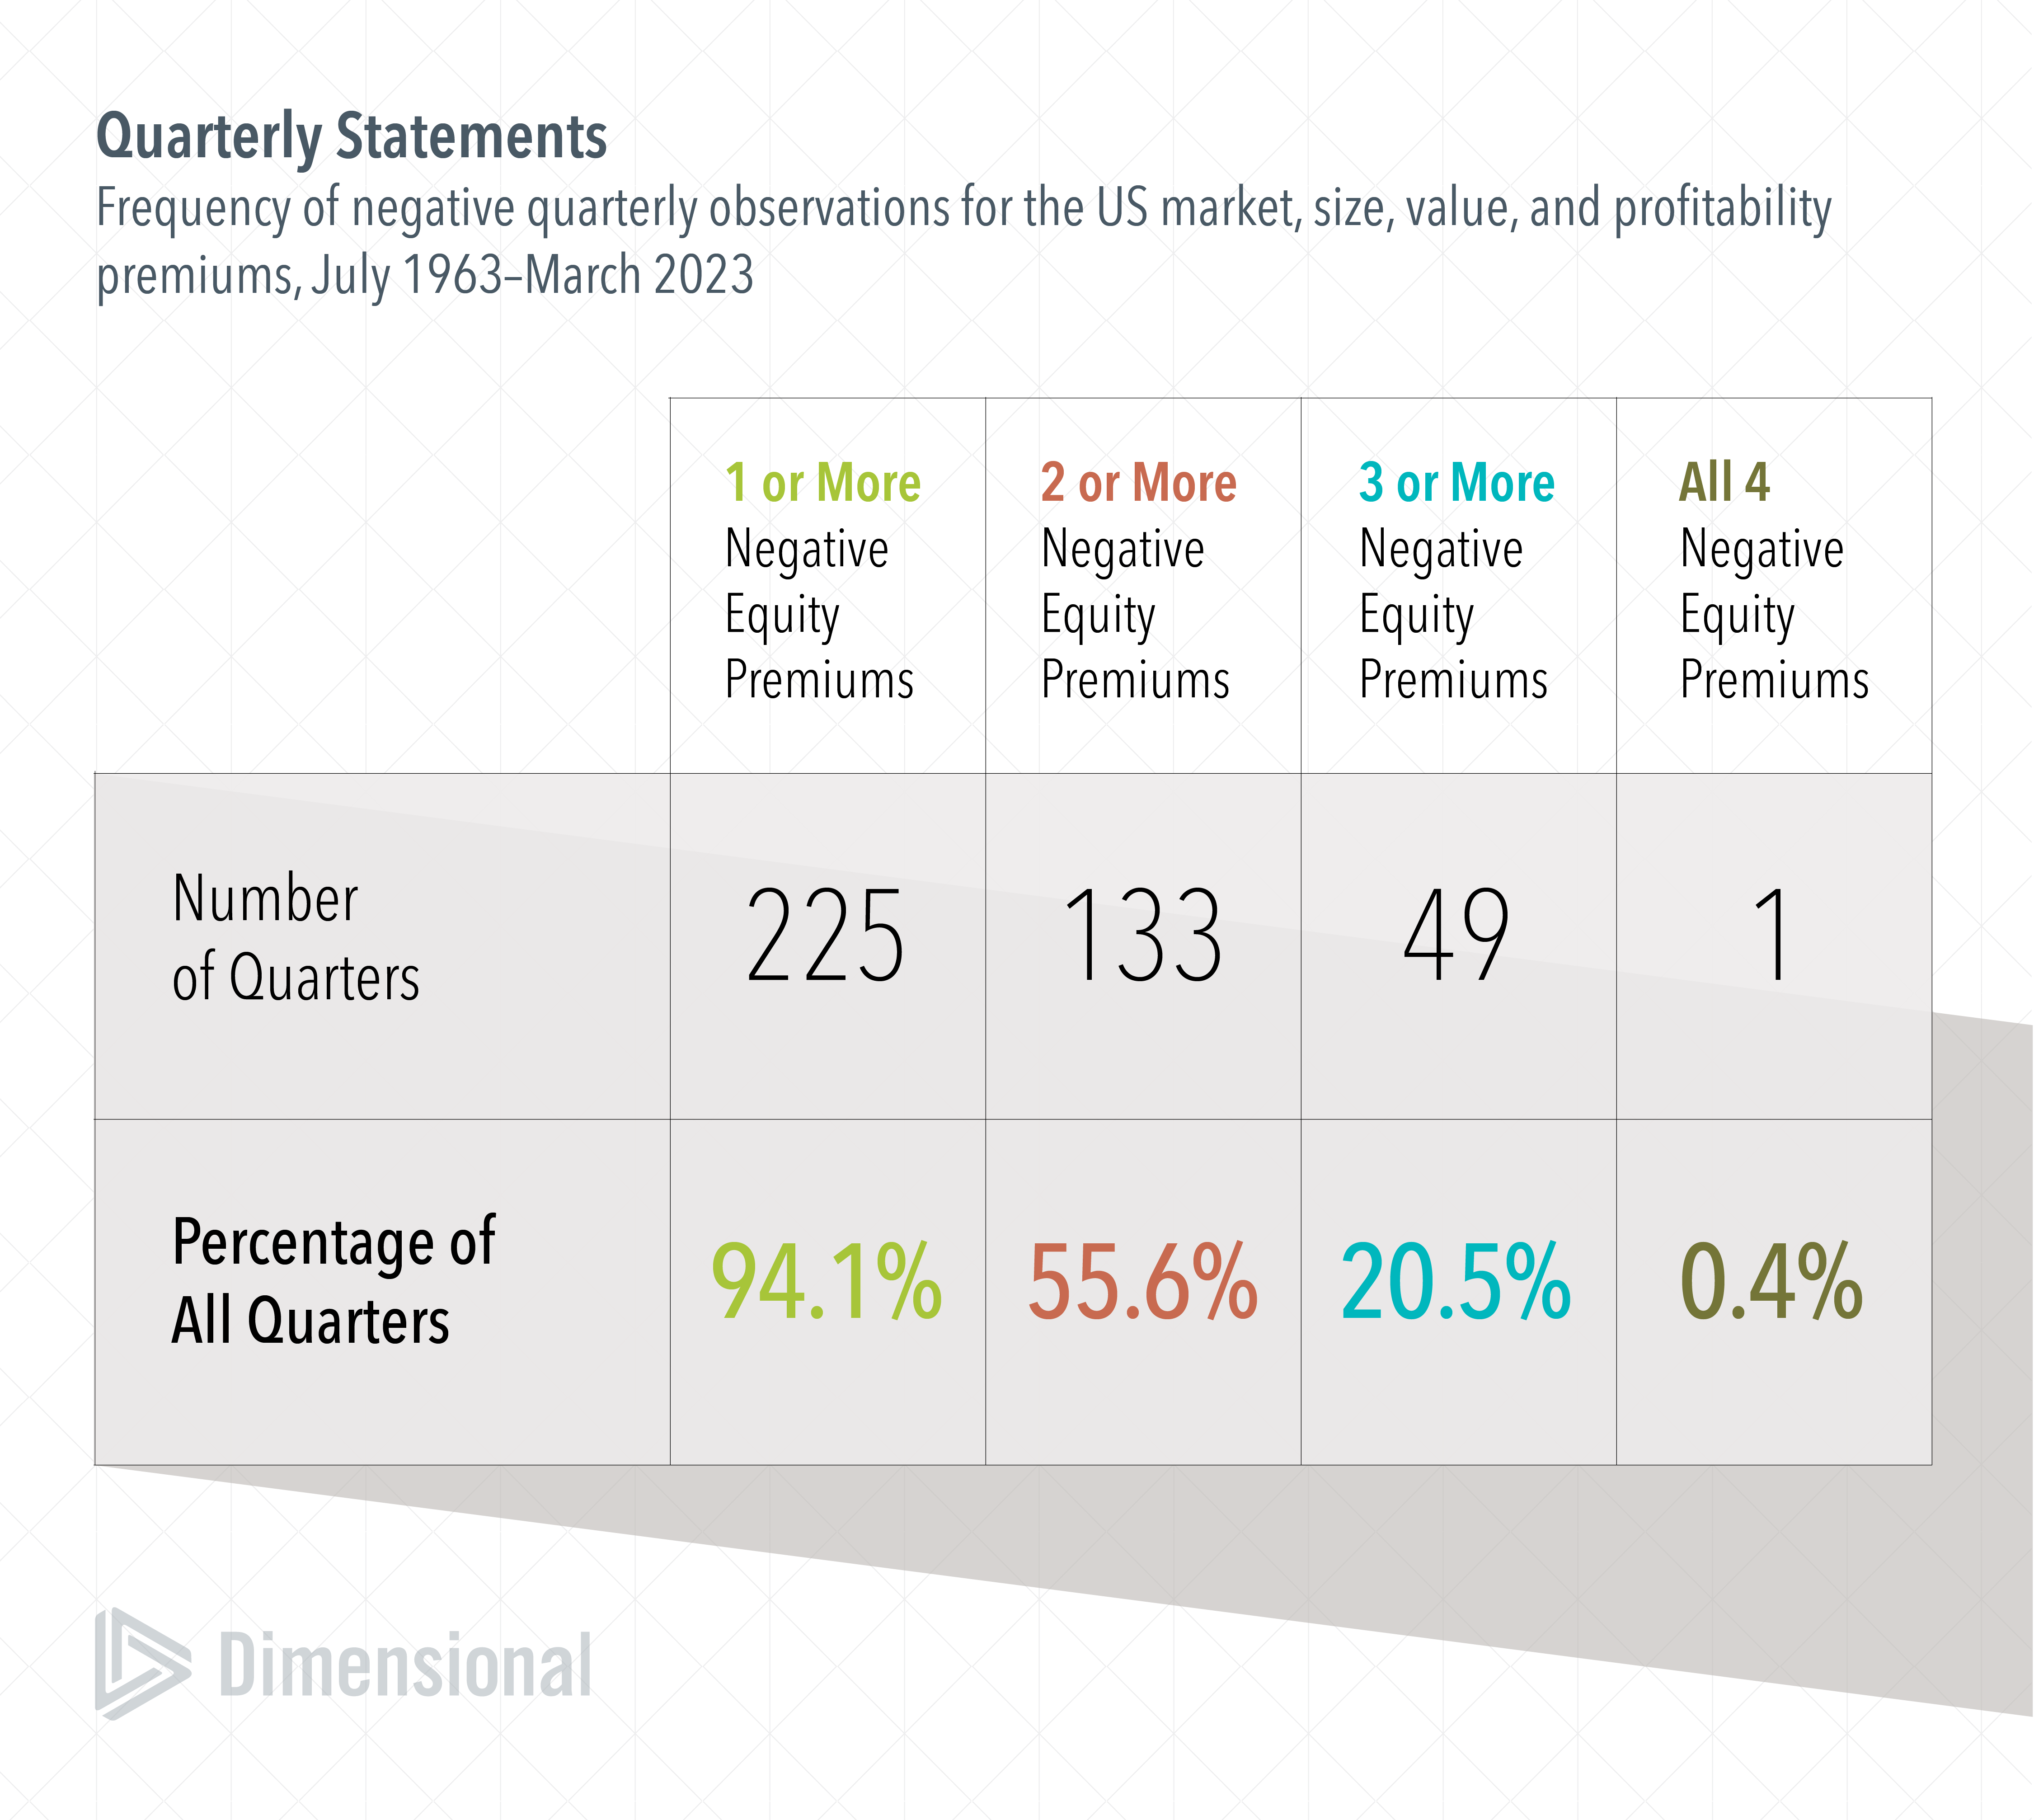
It appears the US stock market will conclude the second quarter with disappointing outcomes for three out of four equity premiums. The market premium (stocks over Treasury bills) is positive, but the size, value, and profitability premiums are all negative for the quarter. Three negative premiums in a quarter, though, isn't particularly rare. Over the 239 quarters dating back to July 1963, three or more of the premiums finished in the red 49 times, or 20.5%.
For me, the most interesting data point is that 94% of the quarters had at least one negative premium. There have been more US presidential elections since 1963 (15) than quarters in which all four equity premiums were positive (14). We expect positive premiums every day, but history tells us that unexpected returns tend to dominate quarterly performance.
Ignoring quarter-to-quarter uncertainty is important because premiums can turn around quickly. In the case of the 49 quarters with three or more negative premiums, only one of those premiums on average was negative for the subsequent 12 months. And over the long haul, tilting towards drivers of higher expected return increases the likelihood of meeting future financial goals.

Number and percentage of quarters where market, size, value and/or profitability premiums were negative are calculated using monthly return data from July 1963 to March 2023. Market: Fama/French Total US Market Research Index minus the one-month US Treasury bill. Size: Dimensional US Small Cap Index minus the S&P 500 Index. Value: Fama/French US Value Research Index minus the Fama/French US Growth Research Index. Profitability: Fama/French US High Profitability Index minus the Fama/French US Low Profitability Index. Profitability is measured as operating income before depreciation and amortization minus interest expense scaled by book. Eugene Fama and Ken French are members of the Board of Directors of the general partner of, and provide consulting services to, Dimensional Fund Advisors LP. The Dimensional and Fama/French Indices represent academic concepts that may be used in portfolio construction and are not available for direct investment or for use as a benchmark. Index returns are not representative of actual portfolios and do not reflect costs and fees associated with an actual investment. S&P data © 2023 S&P Dow Jones Indices LLC, a division of S&P Global.
Fama/French Total US Market Research Index: Fama/French Total US Market Research Factor One-Month US Treasury Bills. Source: Ken French website.
Dimensional US Small Cap Index: Created by Dimensional in March 2007 and compiled by Dimensional. Represents a market-capitalization-weighted index of securities of the smallest US companies whose market capitalization falls in the lowest 8% of the total market capitalization of the eligible market. The eligible market is composed of securities of US companies traded on the NYSE, NYSE MKT (formerly AMEX), and Nasdaq Global Market. Exclusions: non-US companies, REITs, UITs, and investment companies. From January 1975 to the present, the index excludes companies with the lowest profitability and highest relative price within the small cap universe. The index also excludes those companies with the highest asset growth within the small cap universe. Profitability is measured as operating income before depreciation and amortization minus interest expense scaled by book. Asset growth is defined as change in total assets from the prior fiscal year to current fiscal year. Source: CRSP and Compustat. The index monthly returns are computed as the simple average of the monthly returns of 12 subindices, each one reconstituted once a year at the end of a different month of the year. The calculation methodology for the Dimensional US Small Cap Index was amended on January 1, 2014, to include profitability as a factor in selecting securities for inclusion in the index.
Fama/French US Value Research Index: Provided by Fama/French from CRSP securities data. Includes the lower 30% in price-to-book of NYSE securities (plus NYSE Amex equivalents since July 1962 and Nasdaq equivalents since 1973).
Fama/French US Growth Research Index: Provided by Fama/French from CRSP securities data. Includes the higher 30% in price-to-book of NYSE securities (plus NYSE Amex equivalents since July 1962 and Nasdaq equivalents since 1973).
Fama/French US High Profitability Index: Provided by Fama/French from CRSP and Compustat securities data. Includes all stocks in the upper 30% operating profitability range of NYSE eligible firms; rebalanced annually in June. OP for June of year t is annual revenues minus cost of goods sold, interest expense, and selling, general, and administrative expenses divided by book equity for the last fiscal year end in t-1.
Fama/French US Low Profitability Index: Provided by Fama/French from CRSP and Compustat securities data. Includes all stocks in the lower 30% operating profitability range of NYSE eligible firms; rebalanced annually in June. OP for June of year t is annual revenues minus cost of goods sold, interest expense, and selling, general, and administrative expenses divided by book equity for the last fiscal year end in t-1.
The article on this page was republished here with permission of Dimensional Fund Advisors LP. No further republication or redistribution is permitted without the consent of Dimensional Fund Advisors LP.
Disclosures
All expressions of opinion are subject to change. This information is not meant to constitute investment advice, a recommendation of any securities product or investment strategy (including account type), or an offer of any services or products for sale, nor is it intended to provide a sufficient basis on which to make an investment decision. Investors should consult with a financial professional regarding their individual circumstances before making investment decisions. Diversification neither assures a profit nor guarantees against loss in a declining market.
Dimensional Fund Advisors LP is an investment advisor registered with the Securities and Exchange Commission.
Investment products: • Not FDIC Insured • Not Bank Guaranteed • May Lose Value
Dimensional Fund Advisors does not have any bank affiliates.


