Examples of Normal Distribution and Probability In Every Day Life
Click for Larger Image
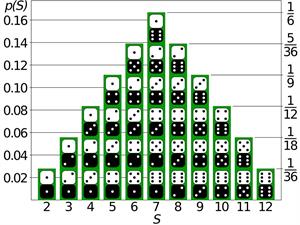
The Sum of the Rolls of Two Die
What makes the sum of two die a binomial distribution? Is it a binomial distribution?
Read Full Article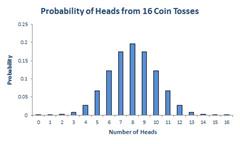
Click for Larger Image
Probability of Heads
This is a simulation of the probability you will get heads on a coin toss from one coin toss to 100.
Read Full Article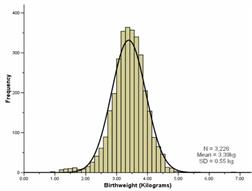
Click for Larger Image
Histogram of the Birthweight of New Born Babies
Shows the distribution of birth weight in 3,226 newborn babies.
Read Full Article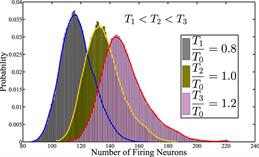
Click for Larger Image
Probability Distribution of the Number of Firing Neurons
Estimated probability distribution of the number of firing neurons under different temperatures.
Read Full Article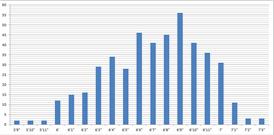
Click for Larger Image
Average Height of NBA Players
Utlizing stats from NBA.com the mean average height of an NBA player is 6'7.
Read Full Article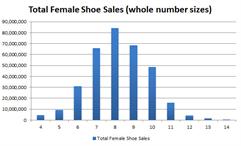
Click for Larger Image
Average Female Shoe Size
What is the average female shoe size based on total female shoe sales?
Read Full Article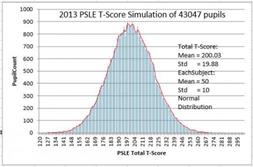
Click for Larger Image
2013 PSLE T-Score Simulation of 43047 Pupils
To determine the total T-score distribution, we need know the number of pupils, the average of total T-scores and the standard deviation std.
Read Full Article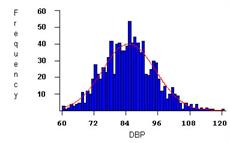
Click for Larger Image
Distribution of Blood Pressure
Distribution of blood pressure can be approximated as a normal distribution with mean 85 mm. and standard deviation 20 mm.
Read Full Article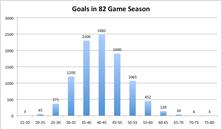
Click for Larger Image
Average Number of Goals
Average number of goals Alex Ovechkin scored over an 82 game season playing for the Capitals.
Read Full Article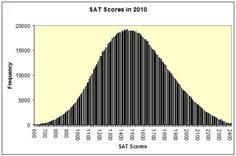
Click for Larger Image
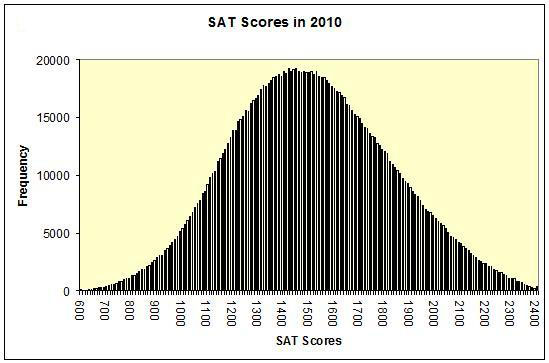
Average SAT Scores 2010
The distribution of combined scores for the Scholastic Aptitude Test (SAT) in 2010
Read Full Article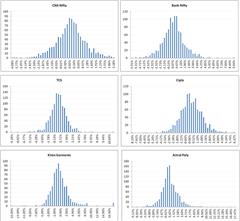
Click for Larger Image
Distribution of Daily Returns of Random Stocks
Daily returns of random stocks over a certain period shows normal distribution aka the bell curve.
Read Full Article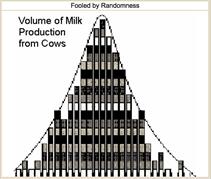
Click for Larger Image
Volume of Milk Production From Cows
Yes even the milk production in cows can have a normal distribution.
Click for Larger Image
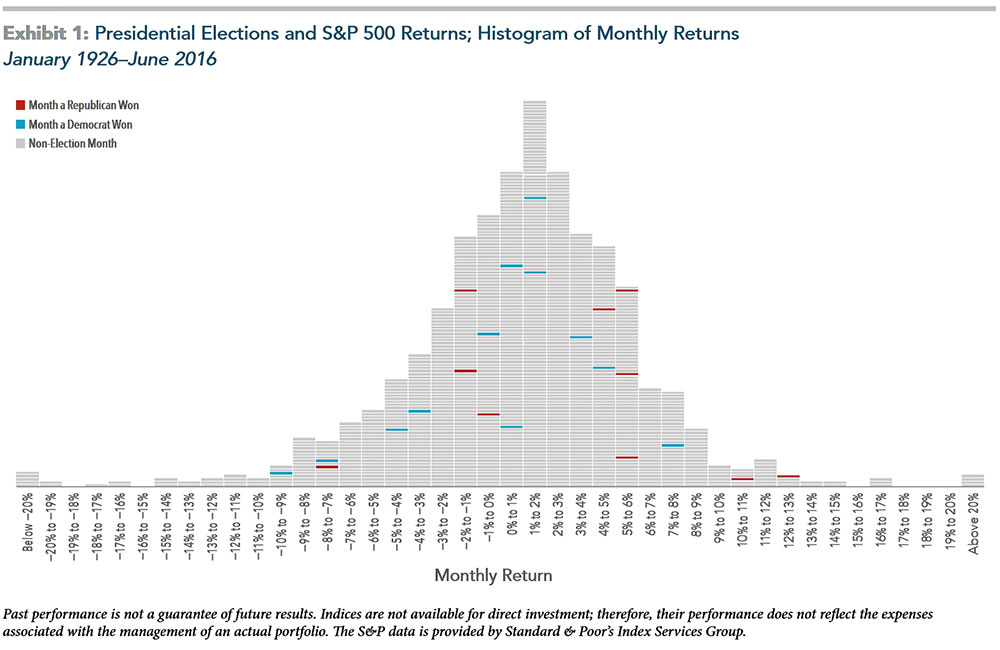
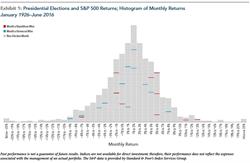
Presidential Elections and S&P 500 Returns
Average monthly returns after presidential election from 1926-2016. Republican vs Democrat vs non-election month.
Read Full Article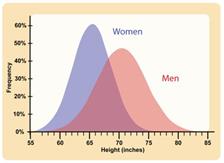
Click for Larger Image
Polygenic Characteristics of Men and Women
Polygenic characteristics of men and women such as skin color and height have a bell-shaped distribution.
Read Full Article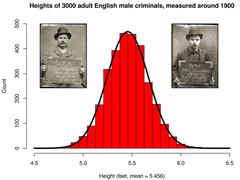
Click for Larger Image
Heights of Adult English Male Criminals
Do short men have a complex? This bell curve of the average height of criminals in the 1900s may answer that question.
Read Full Article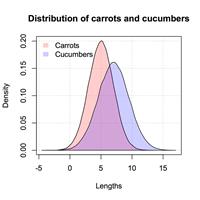
Click for Larger Image
Distribution of Carrots & Cucumbers
Plot of two histograms together in R. Shows a bell curve of the average height of carrots and cucumbers.
Read Full Article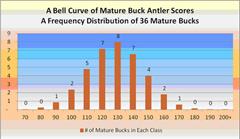
Click for Larger Image
The Bell Curve of Mature Buck Antler Scores
Calculates results of deer per acre of 5000 acres with percentage of mature bucks and percentage of antler scores.
Read Full Article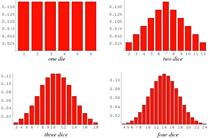
Click for Larger Image
Average Sum of Number of Dice Rolled
Shows the probability and bell curve of number of dice rolled, and what number you will roll most.
Read Full Article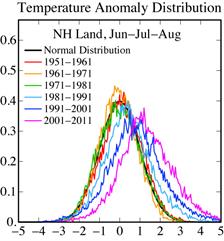
Click for Larger Image
Shifting Distribution of Summer Temperature
View shifting distributions of summer temperatures from 1951 thru 2011. Perception of climate change.
Read Full Article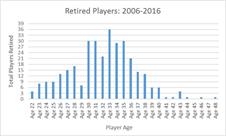
Click for Larger Image
Average NFL Player Retirement Age
Probability an NFL player will retire based on age over a 10 year period.
Read Full Article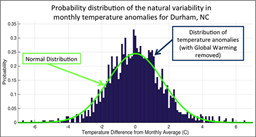
Click for Larger Image
Normal Distribution of Monthly Average Temperature Difference
Probability distribution of the natural variability in monthly temperature anomalies for Durham, North Carolina.
Read Full Article
Click for Larger Image
Probability Distributions
The article linked to below covers Francis Galton's Bean Machine and the probability of distributions.
Read Full Article


