IFA Index Calculator
Retirement Calculator
Target Date Calculator
Retirement Income
College Planning
T-Statistic Calculator
401(k) Calculator
Net Worth
Net Income
Roth IRA Conversion
Fee Calculator
Multi Funds Calculator
MarketCoins® function as an educational tool for investors, illustrating the inherent randomness and unpredictability of market return direction relative to the historical median. One side of the coin is labeled “Above the Median Return,” while the other reads “Below the Median Return.” Given the assumption of fair pricing in efficient markets, the future direction of returns is effectively unpredictable—akin to the outcome of a fair coin toss.


Can you predict which way the market will move tomorrow? Next month? Next year? Flip the IFA MarketCoin® and you’ll get the same honest answer the market itself gives: a 50/50 shot. One side reads “Above the Median Return,” the other “Below the Median Return” — because that’s exactly how historical returns divide, no matter the time horizon. The MarketCoin® is a tribute to Nobel Laureate Eugene Fama’s Efficient Market Hypothesis, which shows that today’s prices already reflect everything known about a company or the economy, leaving tomorrow’s direction genuinely up for grabs. The lesson? Don’t waste energy trying to call the flip. Stay invested, stay diversified, and let time — not timing — do the heavy lifting.


Most Aggressive: Generally intended for investors who have at least 15 years before needing approximately 20% of their investments and are willing to accept a very high degree of volatility in exchange for high portfolio growth potential.

Highly Aggressive: Generally intended for investors who have at least 15 years before needing approximately 20% of their investments and are willing to accept a very high degree of volatility in exchange for very high portfolio growth potential.


Highly Aggressive: Generally intended for investors who have at least 15 years before needing approximately 20% of their investments and are willing to accept a very high degree of volatility in exchange for very high portfolio growth potential.

Aggressive: Generally intended for investors who have at least 14 years before needing approximately 20% of their investments and are willing to accept a very high degree of volatility in exchange for very high portfolio growth potential.

Aggressive: Generally intended for investors who have at least 14 years before needing approximately 20% of their investments and are willing to accept a higher degree of volatility in order to achieve higher portfolio growth potential.

Moderately Aggressive: Generally intended for investors who have at least 13 years before needing approximately 20% of their investments and are willing to accept a higher degree of volatility in order to achieve higher portfolio growth potential.

Moderately Aggressive: Generally intended for investors who have at least 12 years before needing approximately 20% of their investments and are willing to accept a higher degree of volatility in order to achieve higher portfolio growth potential.


Moderately Aggressive:Generally intended for investors who have at least 11 years before needing approximately 20% of their investments and are willing to accept a moderate degree of volatility in order to achieve moderate portfolio growth potential.


Moderately Aggressive: Generally intended for investors who have at least 10 years before needing approximately 20% of their investments and are willing to accept a moderate degree of volatility in order to achieve moderate portfolio growth potential.

Moderately Aggressive: Generally intended for investors who have 9 years before needing approximately 20% of their investments and are willing to accept a moderate degree of volatility in order to achieve moderate portfolio growth potential.

Moderate: Generally intended for investors who have 8 years before needing approximately 20% of their investments and are willing to accept a moderate degree of volatility in order to achieve moderate portfolio growth potential.

Moderately Conservative: Generally intended for investors who have 7 years before needing approximately 20% of their investments and are willing to accept a moderate degree of volatility in order to achieve moderate portfolio growth potential.

Moderately Conservative: Generally intended for investors who have 7 years before needing approximately 20% of their investments and are willing to accept a moderate degree of volatility in order to achieve moderate portfolio growth potential.


Moderately Conservative: Generally intended for investors who have 6 years before needing approximately 20% of their investments and are willing to accept a moderately conservative degree of risk to achieve portfolio growth potential.


Moderately Conservative: Generally intended for investors who have 6 years before needing approximately 20% of their investments and are willing to accept a moderately conservative degree of risk to achieve moderately conservative portfolio growth potential with emphasis on capital preservation.


Conservative: Generally intended for investors who have 5 years before needing approximately 20% of their investments and are willing to accept a conservative degree of risk for incremental appreciation potential with emphasis on capital preservation.


Conservative: Generally intended for investors who have 5 years before needing approximately 20% of their investments and are willing to accept a conservative degree of risk for incremental appreciation potential with emphasis on capital preservation.


Conservative: Generally intended for investors who have 4 years before needing approximately 20% of their investments and are willing to accept a conservative degree of risk for incremental portfolio growth potential with an emphasis on capital preservation.


Highly Conservative: Generally intended for investors who have 4 years before needing approximately 20% of their investments and are comfortable with minimal risk to achieve incremental portfolio growth potential with an emphasis on capital preservation.


Most Conservative: Generally intended for investors who have 3 years before needing approximately 20% of their investments and are comfortable with minimal risk to achieve incremental portfolio growth potential with an emphasis on capital preservation.
These descriptions are provided for general informational purposes only and are not intended as individualized investment advice or a recommendation of any particular portfolio. All investments involve risk, including the potential loss of principal, and portfolio selection should be based on an investor’s individual circumstances.


The front coin portrays a vivid close-up of a frenzied speculator — wide-eyed and consumed by the intoxicating thrill of active trading. This dramatic portrait captures the psychological trap of active investing: the speculative impulse that leads investors to believe they can consistently beat the market. Active investors rely on speculation about short-term market movements, commonly picking stocks, timing the market, and chasing recent fund performance — while ignoring the lessons embedded in vast amounts of historical data. Research suggests that emotional trading can be detrimental, and that investors who pre-commit to a disciplined investment strategy have historically tended to experience better outcomes than those who act on impulse. Step 1 calls on investors to recognize and admit this behavior, modeled structurally after the first step in any twelve-step recovery program.
The reverse coin, Bear the Risk, depicts a serene meditating figure surrounded by market turbulence — bears, bulls, and chaotic financial imagery. It illustrates the essential lesson that risk cannot be avoided in investing; it must be acknowledged and accepted. Each investor carries a unique risk capacity, and the disciplined investor does not flee from risk but learns to understand, measure, and harness it in pursuit of long-term returns.


The front coin presents a solemn gathering of scholarly figures on the steps of a grand neoclassical building — an homage to the Nobel laureates and pioneering financial economists whose research forms the bedrock of index investing. Researchers including Markowitz, Sharpe, Miller, Fama, and Samuelson demonstrated through rigorous study that very few active managers have shown a persistent edge over passive strategies after costs. In the twelve-step framework, Nobel laureates serve as the higher power for investors — providing hundreds of peer-reviewed papers that collectively discredit the myth that active investors can consistently beat the markets, and supporting a globally diversified, low-cost approach instead.
The reverse coin, Wisdom of the Market, depicts a large scale surrounded by the swirling energy of global market forces. It illustrates market efficiency — the idea that millions of participants worldwide collectively set prices representing the best available estimate of value, and that very few, if any, individual investors are expected to have a greater wisdom than the collective wisdom of the crowds. Together, these two coins frame the essential choice of Step 2: trust the science or trust the salesmen.
The front coin, Who Should You Trust?, depicts a tug-of-war between a slick Wall Street salesman and a calm academic scholar, with a bewildered investor caught between them. This painting captures the central dilemma every investor faces: trust the polished, incentive-driven advice of product salespeople, or the unbiased research emerging from the ivory tower — Nobel laureates and pioneering economists whose only allegiance is to the data, and who have nothing to sell? The investors in the painting are caught in the middle, torn between the forces of salesmanship and empirical evidence.
The reverse coin, A Devastating Conclusion, brings to life one of the most famous and provocative images in all of investing literature — the blindfolded monkey throwing darts at the stock pages of the Wall Street Journal. Drawn from Burton Malkiel’s landmark book A Random Walk Down Wall Street, the image makes a point that is as humbling as it is liberating: that a dart-throwing monkey selecting stocks at random has performed as well as — and often better than — the highly paid experts on Wall Street. For the active investor who has staked their faith in manager skill, research, and analysis, this is nothing short of a devastating conclusion. Together these two coins frame the essential choice of Step 2: trust the salesman or trust the science.


The front coin immerses us in the chaos of a trading floor where hands reach across a roulette-style board covered in stock tickers. This painting illustrates how stock picking shares many characteristics with speculative gambling — randomness dressed in the costume of analysis. Decades of academic research confirm that the vast majority of active stock pickers have failed to beat a comparable index fund over time, after accounting for costs. A landmark study of 2,076 mutual fund managers over thirty-two years found that 99.4 percent showed no evidence of genuine stock-picking skill — what little outperformance existed was statistically indistinguishable from luck. The better solution is to trust the collective wisdom of the market, buy the entire haystack, and maintain risk-appropriate exposures in low-cost, globally diversified index portfolios.
The reverse coin, The Big Casino, depicts a grandiose casino hall filled with investors placing bets at various tables. Costs and trading frictions create a persistent headwind for active investors, much as the house edge does in a casino. Every commission, fee, and tax paid is a drag that the market index never faces. Step 3 challenges investors to weigh that headwind honestly when evaluating active strategies.
The front coin, Baked in the Cake, shows a bustling marketplace where traders are embedded within an enormous cake — a visual metaphor for how all publicly available information is already “baked into” market prices. As the Efficient Market Hypothesis suggests, very few traders have demonstrated a persistent edge after costs, because prices already incorporate available information by the time most individuals can act. John Bogle famously described stock picking as “looking for a needle in a haystack” — and research confirms it: of the original S&P 500 companies from 1957, only twelve outperformed the index over the following forty-one years. The solution is straightforward: own the entire haystack through a broad index fund.
The reverse coin, Needle in the Haystack, depicts a lone figure searching desperately through a vast haystack — symbolizing the near-impossible task of reliably identifying an outperforming investment before the fact. This painting reinforces the challenge of finding market-beating investments through research alone, pointing investors toward a more practical solution: owning the entire haystack through a broad index fund rather than exhausting time, energy, and money on a search that the data says is almost certain to fail.


The front coin features a figure tossed by the unpredictable wheel of market timing. Time pickers believe they can predict when to enter and exit the market, but research shows that missing just a handful of the market’s best days — often clustered near its worst — can significantly erode long-term returns. A University of Michigan study found that just ninety days generated 95 percent of all market gains over a thirty-one-year period — an average of only three days per year. Nobel laureate William Sharpe demonstrated that a market timer must be accurate at least 74 percent of the time simply to break even against a passive strategy, a bar no tracked guru has consistently cleared. Step 4 examines why consistent market timing has proven so difficult to execute successfully.
The reverse coin, Piranhas, was inspired by Robert C. Higgins: “The arrival of new information is like a lamb chop thrown to flesh-eating piranhas — within seconds it is devoured.” Available information is rapidly reflected in market prices. Research from 1969 showed that it took as little as five minutes for prices to fully absorb new information — and today, in the era of instant global news, that window is even shorter. By the time most timing signals reach a retail investor, the market has already adjusted.
The front coin depicts Roman Goddess Fortuna lavishing gifts upon eager investors while tossing others aside with her spinning wheel. This allegorical image illustrates that short-term gains attributed to market timing are more often the product of luck than repeatable skill. Fortuna is famously fickle, and those who believe they have mastered her wheel frequently find themselves on its downward arc. A CXO Advisory Group study tracked 4,629 forecasts from twenty-eight well-known market timing gurus from 2000 to 2012, and found that not one achieved the 74 percent accuracy threshold Sharpe identified as the minimum needed to beat a passive portfolio — making market timing as unreliable as it is alluring.
The reverse coin, Market Forces, presents a diagram showing how risk and expected return interact through market prices — yielding the distribution of realized returns over time. This disciplined visualization contrasts with Fortuna’s chaos, showing that the long-term relationship between risk and expected return follows a measurable pattern that has rewarded patient, index-based investors. Where Fortuna offers randomness, market forces offer structure — and it is that structure, not lucky timing, that the disciplined investor chooses to harness.


The front coin presents a lineup of virtually identical fund managers in suits — a wry commentary on the difficulty of manager selection. Investors spend enormous effort trying to identify the next great fund manager based on past performance, yet research consistently shows that past performance does not reliably predict future results. A Morningstar study tracking the top 100 fund managers over fifteen years found that, on average, only 7.3 percent repeated their top performance the following year. The variations in outcomes are best explained by luck and the random rotation of investment styles, not skill. When subjected to a statistical t-test, the alpha of even celebrated managers almost universally fails to reach the threshold required to distinguish skill from chance.
The reverse coin, The Alpha Myth, depicts mythical creatures — a unicorn, Bigfoot, and the Loch Ness Monster — illustrating that a manager who consistently generates true alpha is exceedingly rare and difficult to identify in advance. As Nobel laureate Eugene Fama noted, even over a twenty-year period, the past performance of an actively managed fund contains so much random noise that distinguishing luck from skill is nearly impossible. Step 5 suggests redirecting that search toward a factor-based index strategy designed to capture systematic, reliable sources of return.


The front coin depicts a fund manager literally leaping between investment styles, untethered and adrift against a swirling sky — chasing whatever sector or category has performed best recently, leaving their original mandate far behind. This image captures the essence of style drift: when a manager strays from their declared strategy, they undermine the carefully structured asset allocation the investor has established, often exposing them to unintended risks. Data shows that only about 41% of all domestic funds maintained style consistency over a twenty-year period — meaning the majority of active managers failed to stay true to their stated objective. Just as consumers rightfully expect a box of Corn Flakes to contain corn flakes, investors deserve funds whose contents match their labels. Step 6 teaches that disciplined style consistency is not optional — it is the foundation upon which sound portfolio construction depends.
The reverse coin, The Siren Songs, draws from Homer’s Odyssey — sailors lured toward rocky shores by irresistible Sirens. Just as Odysseus had himself tied to the mast so he could hear the Sirens without being destroyed, investors benefit from committing to their long-term plan and resisting the siren songs of hot tips and short-term speculation. This is among the most iconic coins in the series.


The front coin evokes the spirit of The Feast — a lavish spread laid out before an unseen gathering of silent partners: taxes, fees, inflation, trading commissions, and fund expenses. Before the investor ever takes a bite, these uninvited guests have already helped themselves to a generous portion of the returns. IFA research found that over a fifteen-year period, investors in actively managed equity funds kept only 65 percent of the growth of a $10,000 investment, compared to 95 percent in an index fund — a difference of more than $15,000 drained by silent partners. Active mutual funds also carry expense ratios more than three times higher than a comparable index portfolio, while their higher turnover generates additional tax liabilities that compound the damage year after year.
The reverse coin, Sad Uncle Sam, portrays a somber, dejected Uncle Sam sitting with hat in hand — and with good reason. As more investors abandon active trading in favor of low-cost index funds, they trade less, realize fewer taxable gains, and generate less tax revenue for the government. Sam’s sorrow is the index investor’s gain: every dollar saved in taxes and fees is a dollar that stays in the portfolio, compounding quietly over time.


The front coin plunges us into the exhilarating — and terrifying — world of market risk, depicted as a roller coaster hurtling through dramatic peaks and valleys. That roller coaster is standard deviation in motion: the measurable dispersion of returns around their long-term average. About 68 percent of monthly returns fall within one standard deviation of the mean, 95 percent within two, and 99.7 percent within three. Step 8 teaches the language of “riskese” — the statistical vocabulary of investing. Applied to markets, probability theory reveals that what appears as short-term chaos accumulates close to the orderly shape of a bell curve. Every investment carries an estimated expected return and a standard deviation — together they define that curve and set the framework for every rational portfolio decision.
The reverse coin, Market Factor, illustrates the first factor of the Fama-French five-factor model — market, size, value, profitability, and investment — the systematic, measurable premiums explaining roughly 96 percent of diversified portfolio returns. The mathematical heritage behind these ideas traces to the Pioneers of Probability — Gauss, Pascal, Galton, and others — whose companion coin series from IFA celebrates the statistical foundations that make disciplined, evidence-based investing possible.


The front coin features a century of financial data, from a ticker tape to a computer. Step 9 teaches that nearly a century of stock market history provides investors with one of the most powerful tools available for constructing portfolios — far more informative than short-term performance data or the predictions of any single analyst. Long-term historical data enables investors to better characterize risks and returns, build portfolios matching their risk capacity, and stay the course when markets are turbulent. Historically, a globally diversified portfolio of stock indexes has delivered an annualized return of approximately 10 percent over the period studied, which would have resulted in money doubling roughly every seven years, before fees and taxes.
The reverse coin, The Great Mirror of Folly, is inspired by the famous Dutch book of engravings published in 1720, depicting the simultaneous eruption of speculative manias across Europe — the Mississippi Company, the South Sea Company, and many more. All collapsed in the same frenzy of greed and delusion. This haunting mirror of human folly reminds us that speculative bubbles are not a modern invention — they are a permanent feature of human nature. Two rare copies of this extraordinary book reside in IFA’s library, a testament to the conviction that those who study financial history are better equipped to avoid repeating it.


The front coin depicts a dramatic bull-riding scene — a wild bull bucking while a rider clings on. This vivid image captures the essence of risk capacity: just as a bull rider must be matched to a bull they can handle, each investor benefits from being matched to a portfolio whose volatility they can sustain without abandoning their plan during downturns. Risk capacity is measured across five dimensions: time horizon, attitude toward risk, investments, income, and investment knowledge. Investors who properly identify their risk capacity and commit to a matching portfolio are better positioned to stay the course — a discipline that research shows can add significantly to long-term outcomes compared to emotionally driven portfolio changes.
The reverse coin, Knowledge, portrays a contemplative scholar in a vast library surrounded by illuminated manuscripts — symbolizing the power of financial education. Step 10 emphasizes that an accurate risk capacity assessment requires genuine self-knowledge: understanding how markets work, how risk and return are related, and how behavioral biases can lead even well-intentioned investors astray. A well-informed investor is far better equipped to select and maintain an appropriate long-term portfolio through the inevitable peaks and valleys of a lifetime of investing.
The front coin, The Golden Nest Egg, features a giant golden egg carefully tended in an ornate nest — surrounded by cautious, watchful figures who understand its extraordinary value. This painting communicates the importance of protecting and growing the investor’s most precious asset: their long-term portfolio, accumulated over decades through the power of compounding returns in a disciplined, low-cost index strategy. The nest egg is one of the five dimensions of risk capacity — the greater the value of existing investments, the greater the investor’s capacity to take on risk.
The reverse coin, Income, depicts a vibrant scene of prosperity — figures receiving flowing streams of earnings and wealth. This painting illustrates another dimension of risk capacity: annual income. A higher income means a larger share of earnings is discretionary and available for investing. It also bolsters the ability to weather emergencies without being forced to liquidate investments at the wrong time — because having to sell a declining portfolio to cover expenses can cause irreparable harm to long-term returns. The more stable and substantial an investor’s income, the higher their capacity for risk.


The front coin presents an artist carefully blending colors at a working bench — a rich metaphor for the art and science of asset allocation. Just as a master painter blends pigments to create a harmonious composition, the index investor blends risk factors — equities, bonds, international, small-cap, value — in precise proportions matching their risk capacity. Harry Markowitz’s Nobel Prize-winning research established that portfolios of non-correlated assets can reduce overall risk without proportionally sacrificing expected return. About 90% to 95% of the variation in diversified equity portfolio returns is explained by exposure to the Fama-French factors of market, size, and value — meaning that asset allocation, not manager selection, is the most important investment decision an individual can make.
The reverse coin, Diversification, depicts a colorful collection of baskets, each holding a different set of eggs representing different asset classes — carefully arranged and balanced so that no single basket holds them all. This vivid image brings to life Markowitz’s insight that a portfolio of imperfectly correlated assets reduces concentrated risk while preserving expected return. By spreading eggs across many baskets, the investor is protected when any one basket is dropped. As Nobel Laureate Merton Miller declared: “Diversification is your buddy” — and this coin captures that enduring truth in vivid art.


The front coin depicts index investors reclining peacefully by the seaside — unhurried, at ease, their gaze drifting across the gentle horizon as the market does what markets do. This is the reward promised in Step 12: Invest and Relax. Having built a globally diversified, risk-appropriate index portfolio and committed to a disciplined long-term plan, these investors have stepped back from the noise of the market and the anxiety of speculation. A passive advisor serves as a fiduciary partner in this journey — helping clients stay invested through downturns, rebalance systematically, and avoid the emotionally driven mistakes that can cost investors several percentage points of annual return relative to a buy-and-hold broad market index fund.
The reverse coin, Tax Loss Harvester, portrays workers harvesting wheat against a stormy market landscape — a vivid analogy for strategically realizing eligible capital losses to offset taxable gains and improve after-tax returns. Even in declining markets, disciplined investors can find opportunity: by harvesting losses, immediately reinvesting in a substantially different fund, then returning to the original fund thirty days later. Those losses carry forward to offset future gains, so investors retain more of what the market gives them. This coin reminds us that the final step involves not just investing wisely but thoughtfully optimizing every dimension of the financial plan.
The front coin, The Rebalancing Act, features a tightrope walker balancing high above a dramatic chasm — arms outstretched, navigating with focused precision. This elegant painting captures the discipline of portfolio rebalancing: the systematic practice of returning a portfolio to its target allocation after market movements cause it to drift. Rebalancing sells what has appreciated beyond its target weight and buys what has lagged — a counterintuitive process that functions as a form of volatility capture, potentially enhancing long-term returns while maintaining the appropriate level of risk. Research suggests that rebalanced portfolios can grow faster than the average growth of their individual components, making discipline itself a source of return.
The reverse coin, Glidepath, depicts a joyful scene of investors gliding smoothly down a colorful arc — the risk scale — surrounded by the balloons of their grandchildren. As investors age and approach retirement, a systematic one-percent-per-year reduction in equity allocation smoothly transitions the portfolio from growth-oriented to capital-preserving. The grandchildren’s balloons floating nearby remind us of the ultimate purpose of this journey — not just personal financial security, but the legacy and peace of mind passed on to the next generation. This beautiful final coin embodies the complete arc of the twelve-step journey: from active speculator to enlightened, patient index investor, gliding serenely toward the finish.

Leonardo of Pisa, known as Fibonacci, was born in Italy and educated largely in North Africa, where his father worked as a customs official for Pisan merchants. Exposure to Hindu-Arabic numerals — far superior to the Roman numerals then used in Europe — convinced him that the Western world needed a mathematical revolution. His 1202 book Liber Abaci introduced Hindu-Arabic arithmetic to Europe and transformed commerce, accounting, and science.
Fibonacci is celebrated for the sequence bearing his name — 1, 1, 2, 3, 5, 8, 13, 21... — in which each number is the sum of the two preceding it. What makes this sequence remarkable in the context of probability is its hidden presence within Pascal's Triangle: summing the shallow diagonals of the triangle reveals the Fibonacci sequence exactly. Since Pascal's Triangle is the foundation of the binomial distribution — and the Galton Board is a physical demonstration of that distribution — Fibonacci's sequence is woven into the very mathematics of chance. His work stands at the beginning of a 750-year chain of mathematical discovery that leads directly to modern probability theory and evidence-based investing.
Girolamo Cardano was born in Pavia, Italy, and led one of the most turbulent lives in the history of mathematics. A physician, astrologer, gambler, and prolific author, he achieved fame across Europe for his medical skill and his groundbreaking algebra — his Ars Magna (1545) introduced complex numbers and solved cubic equations. His personal life was marked by tragedy: one son was executed for murder (1560), another was a thief, and Cardano himself was imprisoned by the Inquisition (1570) late in life.
It was his compulsive gambling that, paradoxically, drove Cardano to write Liber de Ludo Aleae — the Book on Games of Chance — the first systematic treatment of probability in history. Written c. 1564 but not published until 1663, nearly a century after his death, the book analyzed dice games with mathematical rigor, introducing the concept of sample space and calculating odds for the first time. Cardano understood that the house always wins in the long run — a lesson as relevant to active fund managers today as it was to Renaissance gamblers.
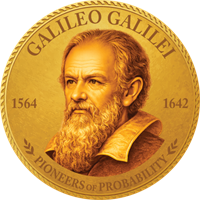
Galileo Galilei was born in Pisa, Italy, into a family with deep musical and intellectual traditions. He studied medicine at the University of Pisa (1581–1585) before turning to mathematics and natural philosophy, eventually becoming professor of mathematics at the University of Padua (1592–1610). His telescopic observations (1609–1610), support for the Copernican heliocentric model, and conflict with the Catholic Church — culminating in his trial and house arrest (1633) — made him one of history's most celebrated and persecuted scientists. He is widely regarded as the father of modern observational science.
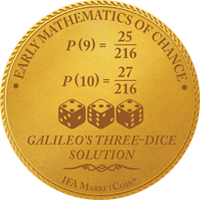
Among his lesser-known contributions is a careful analysis of dice probability written c. 1620 at the request of his patron Cosimo II de' Medici, published posthumously in his Opere (1718). Galileo's solution to why the sum of 10 appears more frequently than 9 when rolling three dice — shown on his coin as P(9) = 25/216 and P(10) = 27/216 — was a landmark early application of combinatorial probability. By systematically counting all possible outcomes, Galileo demonstrated that mathematical reasoning could explain what intuition could not, establishing a template for probabilistic analysis that Pascal and Fermat would later develop into a full theory in their celebrated correspondence of 1654.
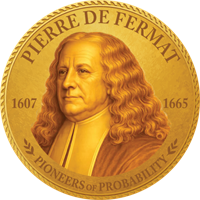
Pierre de Fermat was born in southern France and spent his professional life as a lawyer and magistrate — mathematics was, officially, his hobby. Yet this amateur produced work of such profound originality that he is remembered as one of the greatest mathematicians who ever lived. He made foundational contributions to number theory, analytic geometry (c. 1629), calculus (c. 1629), and optics, often scribbling results in margins without bothering to write full proofs.
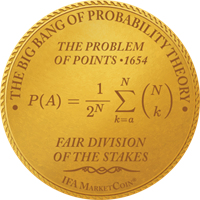
Fermat's most consequential contribution to probability came through his 1654 correspondence with Blaise Pascal about the Problem of Points — how to fairly divide the stakes of an interrupted game of chance. Fermat's approach was purely combinatorial: he counted the number of ways each player could win the remaining rounds, dividing the stakes proportionally. This seemingly simple insight — that probability is a matter of counting favorable outcomes — was the spark that ignited the entire field of probability theory. That exchange of letters between two brilliant Frenchmen in 1654 is rightly called the Big Bang of Probability Theory.
Blaise Pascal was born in Clermont-Ferrand, France, and displayed extraordinary intellectual gifts from childhood. By his early teens he had written an original treatise on conic sections (1639) that astonished professional mathematicians. His father, a tax collector, inadvertently sparked Pascal's interest in calculation by struggling with arithmetic — leading the young Pascal to build one of the world's first mechanical calculators at age 18 (1641).
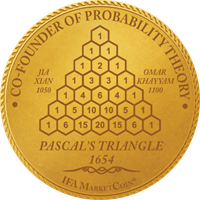
Pascal is best known in probability for his famous correspondence with Pierre de Fermat in 1654, which together established the mathematical foundations of the field. His Traité du triangle arithmétique (1654, published posthumously 1665) formalized Pascal's Triangle — a structure encoding combinatorial relationships that had been studied in China, India and Persia centuries earlier, but which Pascal systematically applied to probability for the first time. Tragically, Pascal died at 39 after a profound religious conversion led him to abandon mathematics almost entirely. What he left behind in just a few productive years permanently shaped how humanity reasons about uncertainty.

Christiaan Huygens was born in The Hague, Netherlands, into a prominent and well-connected family — his father Constantijn was secretary to the Prince of Orange and a friend of Descartes. Exceptionally gifted from childhood, Huygens went on to invent the pendulum clock (1656), discover Saturn's rings (1655) and its moon Titan (1655), develop the wave theory of light (1678), and make fundamental contributions to mechanics. He was one of the founding members of the French Académie des Sciences (1666).
Christiaan Huygens was born in The Hague, Netherlands, into a prominent and well-connected family — his father Constantijn was secretary to the Prince of Orange and a friend of Descartes. Exceptionally gifted from childhood, Huygens went on to invent the pendulum clock (1656), discover Saturn's rings (1655) and its moon Titan (1655), develop the wave theory of light (1678), and make fundamental contributions to mechanics. He was one of the founding members of the French Académie des Sciences (1666).


Gottfried Wilhelm Leibniz was born in Leipzig, Germany, and displayed extraordinary intellectual range from childhood. Trained in law, philosophy, and mathematics, he became one of the most versatile thinkers of the 17th century. He is perhaps best known as the co-inventor of calculus — independently of Newton (c. 1666–1675), sparking one of history's most bitter priority disputes that consumed both men's later years. He served as a diplomat, librarian, and advisor to European royalty throughout his career.
Leibniz made foundational contributions to combinatorics through his early work Dissertatio de Arte Combinatoria (1666), exploring how complex ideas could be built from simple combinations. His legal writings of the 1660s and 1670s introduced the concept of graduated degrees of proof and probability — arguing that evidence could be quantified on a scale from impossibility to certainty. His notation for calculus, introduced in his landmark publication of 1684, became the standard used by mathematicians worldwide to this day. This probabilistic approach to legal reasoning anticipates modern Bayesian thinking and represents one of the earliest attempts to apply mathematical probability to human judgment and decision-making.<.p>
Jacob Bernoulli was born in Basel, Switzerland, into a mathematical dynasty that would produce at least eight distinguished mathematicians across three generations. Trained initially in theology at his father's insistence, he taught himself the new mathematics of Leibniz (c. 1687) and became one of its foremost practitioners. He feuded bitterly with his younger brother Johann — a rivalry that, while personally painful, drove both men to extraordinary mathematical achievements.
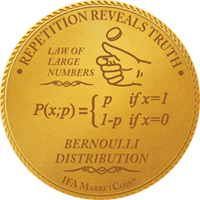
Bernoulli's masterwork, Ars Conjectandi (written c. 1689–1705, published posthumously 1713), was the first systematic textbook of probability theory. It introduced the Law of Large Numbers — the profound insight that as a sample grows larger, its average converges with increasing reliability toward the true underlying probability. This principle, which Bernoulli called his "golden theorem," is the mathematical foundation of index investing: given enough time and diversification, the returns of the market reveal themselves with remarkable consistency. Randomness in the short run yields order in the long run.
Abraham de Moivre was born in Vitry-le-François, France, but spent most of his adult life in London after fleeing religious persecution as a Protestant following the revocation of the Edict of Nantes (1685). Despite his brilliance — he was a friend of Newton and a Fellow of the Royal Society (elected 1697) — he was never able to secure a university position as a foreigner, and supported himself throughout his life as a private mathematics tutor and consultant to gamblers and insurance underwriters.
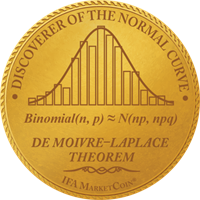
De Moivre is the unsung hero of the normal distribution. In 1733 — more than seventy years before Gauss — he derived the bell curve as an approximation to the binomial distribution for large numbers of trials, a result first circulated as a private pamphlet (1733) and later incorporated into the second edition of his masterwork The Doctrine of Chances (1st edition 1718, 2nd edition 1738, 3rd edition 1756). The theorem connecting the binomial and normal distributions bears the names of de Moivre and Laplace — a rare acknowledgment of priority that Gauss, who receives most of the credit for the normal curve, arguably does not fully deserve.
Daniel Bernoulli was born in Groningen, Netherlands, into one of history's most distinguished mathematical families. His father Johann (1667–1748) and uncle Jacob (1655–1705) were both celebrated mathematicians, creating both extraordinary opportunity and intense rivalry throughout his career. He studied medicine and mathematics simultaneously, eventually becoming a professor at the St. Petersburg Academy of Sciences (1725–1733) before returning to Basel, Switzerland.
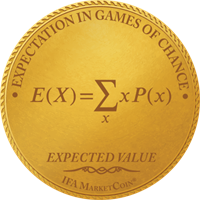
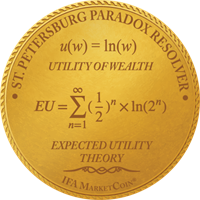
Bernoulli's most celebrated contribution to probability was his resolution of the St. Petersburg Paradox — a famous puzzle first posed by his cousin Nicolaus Bernoulli (1713) about a coin-flipping game with infinite expected value yet limited practical worth. His solution, published in the Commentarii Academiae Scientiarum Imperialis Petropolitanae (1738), introduced the concept of expected utility, arguing that the value of money is logarithmic rather than linear. This insight — that people do not value outcomes purely by their mathematical expectation — laid the foundation for modern behavioral economics, decision theory, and risk analysis. His work directly anticipates how investors should think about risk and return rather than simply chasing maximum expected gains.
Thomas Bayes was born in England and lived quietly as a Presbyterian minister in Tunbridge Wells, publishing very little during his lifetime — his most notable earlier work being a defense of Newton's calculus (1736). Almost nothing is known about his personal life, and — in a delicious irony for a man whose theorem concerns the updating of beliefs based on evidence — no verified portrait of him exists. The image on his coin, like virtually every representation of Bayes, is an artistic invention.
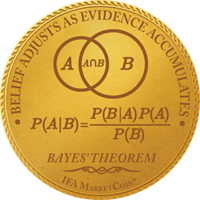
What Bayes left behind was a single manuscript, discovered after his death and published by his friend Richard Price in 1763 as "An Essay towards solving a Problem in the Doctrine of Chances" in the Philosophical Transactions of the Royal Society. It contained a theorem of extraordinary power: that prior beliefs, updated by new evidence, yield posterior probabilities that reflect both what we knew before and what we have learned. Bayes' theorem — P(A|B) = P(B|A)·P(A)/P(B) — is today the foundation of machine learning, artificial intelligence, medical diagnosis, and spam filtering. Its core message resonates deeply with evidence-based investing: rational beliefs should update continuously as new evidence accumulates, rather than clinging to prior convictions in the face of contradicting data.
Pierre-Simon Laplace was born in Normandy, France, to a modest farming family, and rose entirely by intellectual merit to become one of the towering figures of Enlightenment science. He navigated the French Revolution (1789–1799), the Napoleonic era, and the Restoration with remarkable political dexterity, serving in government while maintaining extraordinary scientific productivity throughout. Napoleon once complained that Laplace brought "the spirit of the infinitely small" into administration.
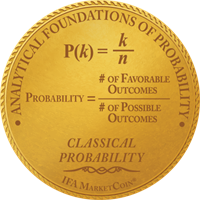
Laplace made transformative contributions to probability theory, codifying the classical definition of probability as favorable outcomes divided by total outcomes and pioneering Bayesian inference before Bayes's work was widely known. His five-volume Mécanique Céleste (1799–1825) applied probability and mathematics to the motions of the solar system, while his Théorie analytique des probabilités (1812) unified the field into a coherent mathematical discipline. Together with de Moivre, he proved the Central Limit Theorem — one of the most important results in all of mathematics, now known as the De Moivre-Laplace theorem (c. 1738–1812) — establishing why the normal distribution appears so universally in nature and in markets.
Adrien-Marie Legendre was born in Paris in 1752 and became one of France’s leading mathematicians during a period of profound political upheaval, including the French Revolution and Napoleonic era. He worked extensively in geometry, number theory, and celestial mechanics. Though quieter and less politically connected than some contemporaries, Legendre produced enduring contributions that shaped mathematical physics and analysis.
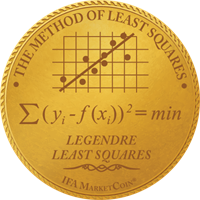
Legendre independently developed and published the method of least squares around 1805, a fundamental statistical estimation technique later refined by Gauss. In probability and analysis, he introduced special functions now known as Legendre functions (sometimes historically referred to as “Legendre’s chi function” in analytic contexts), which play a role in orthogonal expansions and solutions to differential equations. These functions contribute to modern statistical physics and approximation theory. His least squares work became central to regression analysis, linking him conceptually to Gauss and, later, Galton.
Carl Friedrich Gauss was born in Brunswick, Germany, to working-class parents who could barely afford his education. His mathematical gifts were so extraordinary that a local duke sponsored his studies, allowing one of history's greatest minds to flourish. By 19 he had proven the constructibility of the 17-sided regular polygon (1796), a problem unsolved for 2,000 years. He is known as the "Prince of Mathematicians."
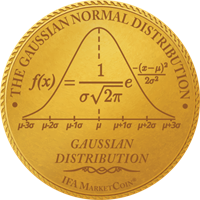
Gauss made enduring contributions to statistics, number theory, astronomy, and physics. His formalization of the normal distribution — depicting how measurement errors cluster around a true value — appeared in his Theoria Motus Corporum Coelestium (1809) and became the standard framework for uncertainty in every scientific discipline. It is worth noting that Abraham de Moivre described the normal curve in 1733, decades before Gauss, and Legendre published the method of least squares in 1805 before him as well — making Gauss one of history's most celebrated, if occasionally overcredited, mathematicians. His ideas nonetheless shaped statistics, physics, and econometrics in ways that remain indispensable today.
Siméon Denis Poisson was born in Pithiviers, France, the son of a local government official. Initially directed toward medicine, he discovered a passion for mathematics that led him to the prestigious École Polytechnique in Paris (entering 1798), where he studied under Lagrange and Laplace — two of the greatest mathematicians of the age. He eventually became a professor there himself (1802), producing an extraordinary volume of mathematical work across mechanics, physics, and probability throughout his career.
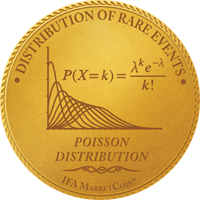
Poisson's most lasting contribution to probability theory is the distribution that bears his name, introduced in his Recherches sur la probabilité des jugements en matière criminelle et en matière civile (1837). The Poisson distribution — P(X=k) = λᵏe⁻λ/k! — describes the probability of a given number of rare, independent events occurring in a fixed interval of time or space. It applies wherever events happen randomly but at a predictable average rate: radioactive decay, customer arrivals, insurance claims, market price jumps, and equipment failures all follow Poisson distributions. His rim title "Distribution of Rare Events" captures perfectly why his work remains indispensable to modern risk analysis and actuarial science more than 185 years after its publication.
Adolphe Quetelet was born in Ghent, in what is now Belgium, and trained as both a mathematician and astronomer before turning his quantitative skills toward an entirely new subject: human beings. Working in Brussels, he became the first person to systematically apply statistical methods to social phenomena — measuring populations, tracking crime rates, and studying physical characteristics across thousands of people.
Quetelet's most celebrated work involved measuring the chest circumferences of 5,738 Scottish soldiers (1817), demonstrating that human physical traits follow the normal distribution with remarkable precision. This discovery of the homme moyen — the "average man" — was introduced in his landmark work Sur l'homme et le développement de ses facultés (1835) and was revolutionary: it showed that the same mathematical laws governing errors in astronomical measurement also governed the variation of the human body. His later work Letters on the Theory of Probabilities (1846) further developed these ideas. Quetelet founded the science of social statistics and showed that what appears to be individual unpredictability resolves, across large populations, into beautiful and predictable patterns.
Francis Galton was born in Birmingham, England, into a wealthy and intellectually prominent family — a cousin of Charles Darwin. Restless and insatiably curious, he explored Africa, pioneered weather mapping, invented fingerprint identification, and founded the science of psychometrics, all before turning his most enduring attention to statistics and heredity.
Galton was fascinated by the hidden order within apparent randomness. His greatest invention — the Galton Board (1873) — demonstrated how thousands of random events, each unpredictable alone, produce a beautiful and predictable bell curve in aggregate. He described this phenomenon as "order in apparent chaos," a phrase that captures something profound about both nature and markets: individual outcomes are uncertain, but distributions are remarkably stable. His work laid the groundwork for regression to the mean, correlation, and modern statistical analysis — concepts formalized in his landmark book Natural Inheritance (1889) — that remain foundational to evidence-based investing today.
Andrey Markov was born in Ryazan, Russia, and spent most of his academic career at St. Petersburg University, where he was known for intellectual rigor, fierce independence, and a willingness to engage in public controversy — including a celebrated dispute with the Russian Orthodox Church (1912). He was a devoted student of Chebyshev and extended his teacher's work on probability in fundamental new directions.
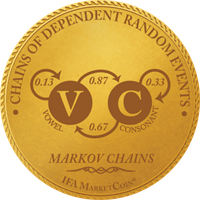
Markov's greatest contribution was the mathematical framework now bearing his name: Markov chains, first introduced in his landmark paper of 1906, describe systems that transition between states based solely on the current state, with no memory of prior history. His famous analysis of vowel and consonant alternation in Pushkin's Eugene Onegin (1913) was the first real-world application — demonstrating that even literary language follows probabilistic rules. The insight that tomorrow's outcome depends only on today's state, not on yesterday's, has profound implications for markets: past price movements contain no information about future direction. This principle — formalized by Markov (1906), confirmed by decades of empirical research — is the mathematical backbone of the efficient market hypothesis.

Tune Out the Noise is a documentary directed by Errol Morris in collaboration with Dimensional Fund Advisors that explores a major shift in the world of investing. The film focuses on a group of University of Chicago academics in the 1960s whose research challenged traditional Wall Street practices. Their work laid the foundation for a new approach to investing based on rules, diversification, and lower costs. This approach contrasted sharply with stock picking, market timing and manager selection, which had dominated the industry.
The documentary shows how these ideas led to the creation of passive investing and the first index funds. These innovations helped make investing more accessible and efficient for a broader range of people. Morris presents the story through interviews with influential economists and financial leaders. Featured figures include Nobel Prize winners Eugene Fama, Robert Merton, and Myron Scholes, among others.
Through its storytelling, the film highlights the importance of questioning conventional wisdom and embracing new ideas. It portrays the financial revolution as a result of innovation, persistence, and the application of academic research. Ultimately, Tune Out the Noise emphasizes that a smarter, evidence-based approach to investing can benefit everyone.

When he sold shoes on commission as a teenager in Lawrence, Kansas, David Booth refused to shade the truth just to make a sale. Booth eventually built a global investment firm based on the reality of market pricing instead of the mirage of stock picking. “It’s not about being big,” says the Founder and Chairman of Dimensional Fund Advisors. “It’s about doing things the right way.
Gene Fama, “a poor kid from Malden,” a working-class town in eastern Massachusetts, at first majored in French when he enrolled at Tufts, his local university, in the 1950s. But he soon discovered economics and fell in love with it. Fama, a 2013 Nobel laureate, is regarded as the father of the efficient market hypothesis.
While studying finance as a PhD student at the University of Rochester in the early 1980s, Ken French realized that the names of most mutual funds told investors almost nothing about their underlying investments. A decade later, trailblazing research by Eugene Fama and French on factors that explain stock and bond returns forever changed the mutual fund landscape and the fundamentals of portfolio management.
At 10 years old, Robert Merton bought his first stock (General Motors). In the next two decades, painstaking work by researchers who studied stock price data revolutionized finance into a science—and Merton’s own scientific work in dynamic portfolio theory and the pricing of derivatives paved the way for industry-leading advances in risk management.
A ruptured aorta took his dad’s life in 1950, when Rex Sinquefield was 5 years old. He grew up in a St. Louis orphanage and was drafted into the military before landing in the legendary Merton Miller’s class at the University of Chicago, where he first learned about efficient markets. Sinquefield and fellow UChicago PhD student David Booth would go on to found Dimensional in 1981.

A farm boy from Sandwich, Illinois, John “Mac” McQuown grew up understanding that agriculture was a numbers game. His dedication to data analysis eventually led to a position created just for him at Wells Fargo Bank in 1964. A decade later, McQuown and Booth created one of the first S&P 500 index funds. When Booth launched Dimensional, McQuown became a founding board member.
At age 16, when most teens are just thinking about college, Ireland native Gerard O’Reilly was studying for a BA in theoretical physics at Trinity College Dublin. An MS in high-performance computing followed, then a PhD in aeronautics from Caltech in 2004. The next milestone for this rocket scientist: researcher at Dimensional, where he would later rise to Chief Investment Officer. In 2017, O’Reilly became the firm’s Co-CEO and is also Co-CIO.
Following a decorated college basketball career at the University of California, Berkeley, and a few years as a pro, Dave Butler joined a big Wall Street firm. He would soon lose a significant amount of his net worth on a stock (Boston Chicken) recommended by his broker. It was one of several “aha” moments that led Butler, now Co-CEO of Dimensional, to become a champion of “holistic wealth management.”
Paul Samuelson was an American economist who was awarded the Nobel Prize in Economic Sciences in 1970 for his fundamental contributions to nearly all branches of economic theory. Samuelson was educated at the University of Chicago (B.A., 1935) and at Harvard University (Ph.D., 1941). He became a professor of economics at the Massachusetts Institute of Technology (MIT) in 1940. He also served as an economic adviser to the United States government.
Robert Novy-Marx is the Lori and Alan S. Zekelman Distinguished Professor of Finance at the Simon Business School in the University of Rochester. His research focuses on asset pricing, both theoretical and empirical, as well as industrial organization, public finance, and real estate. His seminal work on the government pensions crisis established him as a leading national voice on the issue, while his work on profitability is foundational for asset managers.
Not “mechanically inclined,” Roger Ibbotson knew he wasn’t cut out for his family’s HVAC business. So he went to the University of Chicago to study economics. Ibbotson and another UChicago alum, Rex Sinquefield, transformed voluminous data generated by the Center for Research in Security Prices (CRSP) into Stocks, Bonds, Bills, and Inflation, their influential 1977 study of major US asset class returns.
Dimensional needed to hire somebody to manage trading when the firm began. At the time, Rex Sinquefield’s wife, Jeanne, who had a PhD and an MBA from the University of Chicago, was designing options for the Chicago Board of Trade. A self-described “data freak,” Jeanne took the job at Dimensional, where she ended up wearing numerous hats, including training all traders and portfolio managers. She served as Executive Vice President and Head of Trading until retiring in 2005.
Born in Bulgaria, a communist country at the time, Savina Rizova came to Dartmouth College to study finance and became a research assistant for Professor Ken French. Now Co-CIO and Global Head of Research at Dimensional, Rizova was named one of Barron’s “100 Most Influential Women in US Finance” in 2022, 2023, and 2024.

Dan Wheeler founded Dimensional Fund Advisors Financial Advisor Services group, and has been instrumental in bringing modern portfolio theory to the community of fee-only financial advisors. Throughout his career, Dan has helped build the advisor community and change investment advice in retail markets. Prior to Dimensional, Dan worked at Arthur Anderson & Co., was the controller of Triad International Marketing and owned a fee-only investment advisory firm.

After big success in the pharmaceutical industry, Mark Hebner retired at age 32. Then a cold-calling broker persuaded him to buy a bunch of individual municipal bonds and stocks. Compared to investing in a portfolio of passively managed funds, that sales pitch led to his missing out on millions in potential gains. To help other investors avoid his error, Hebner created one of the first web-based advisory firms, Index Fund Advisors.
A co-founder of Forum Financial Management, Norm Mindel is a renowned financial advisor, attorney, CPA, CFP, author, and public speaker. Working with Dimensional changed his professional career and helped his clients and family achieve their financial goals through a long-term, disciplined investment approach.

A financial advisor once told former US Senator Bill Bradley, “Not many people have access to something so intimate as people’s dreams. That’s what I have.” The lesson, Bradley says, is that achieving any dream—a vacation home, a beautiful painting, sending children to college—depends on how people invest. Bradley, a two-time NBA champion with the New York Knicks, is a consultant to Dimensional.

Errol Morris is the Director of Tune Out the Noise. His films have won many awards, including an Oscar for The Fog of War, the Grand Jury Prize at the Sundance Film Festival for A Brief History of Time, the Silver Bear at the Berlin International Film Festival for Standard Operating Procedure, and the Edgar from the Mystery Writers of America for The Thin Blue Line. His films have been honored by the National Society of Film Critics and the National Board of Review.


 X
X