He's now regarded as one of the most influential mathematicians of all time, but it was his interest in astronomy that inspired Pierre-Simon Laplace to produce his most famous work.
Laplace was fascinated by the movements of planets and stars. He initially shared the scientific consensus at the time that celestial mechanics could be described deterministically. That view was based on the work of Isaac Newton, which suggested that, given the required information, it was possible to predict the future positions of celestial bodies with accuracy.
But Laplace gradually changed his mind. Uncertainty and lack of information, he realised, made it very hard to make precise predictions with any consistency. The movement of celestial bodies, he argued, was best understood in terms of probabilities. It was that realisation which led Laplace to lay the groundwork for modern probability theory in his work Theorie Analytique des Probabilities, first published in 1812.
The financial markets are highly complex
Now you may be wondering, what have celestial mechanics and probability theory got to do with investing? In fact, there are significant parallels.
The investing universe, just like the actual universe, is hugely complex. It's very difficult to explain why, on a daily basis, the prices of individual assets move up and down as they do. But that doesn't stop financial professionals and commentators making market forecasts. Rather like astronomers in the 17th and 18th centuries who thought there were fundamental laws that governed the movements of planets and stars, there's a whole industry of experts who think there are systematic ways of telling, in advance, which assets to buy and sell, and when to do it.
Unfortunately, the overwhelming evidence is that those experts are misguided. As another French mathematician, Louis Bachelier, demonstrated in his 1900 thesis Theorie de la Speculation, that the price of a stock or bond follows a random path, influenced by countless tiny, unpredictable factors. What this means for investors is that speculating as to which assets will perform best in the future is a waste of effort, time and money. The best thing to do is diversify across different asset classes, countries, economic sectors, and simply stay invested.
In other words, successful investing is not about trying to predict the future at all; it's about understanding probabilities and giving yourself the best possible chance of a successful outcome. This requires you to focus not on past returns, or possible returns, but on expected returns.
How can we measure expected returns?
"Every investment carries an expected return," writes Mark Hebner in his award-winning book, Index Funds: The 12-Step Recovery Program for Active Investors. "Of course, few investors know, or agree on, what that expected return is. There are so many ways to determine the expected return that I like to say ‘pick your poison.' My preference is to use the average of the last 600 months."
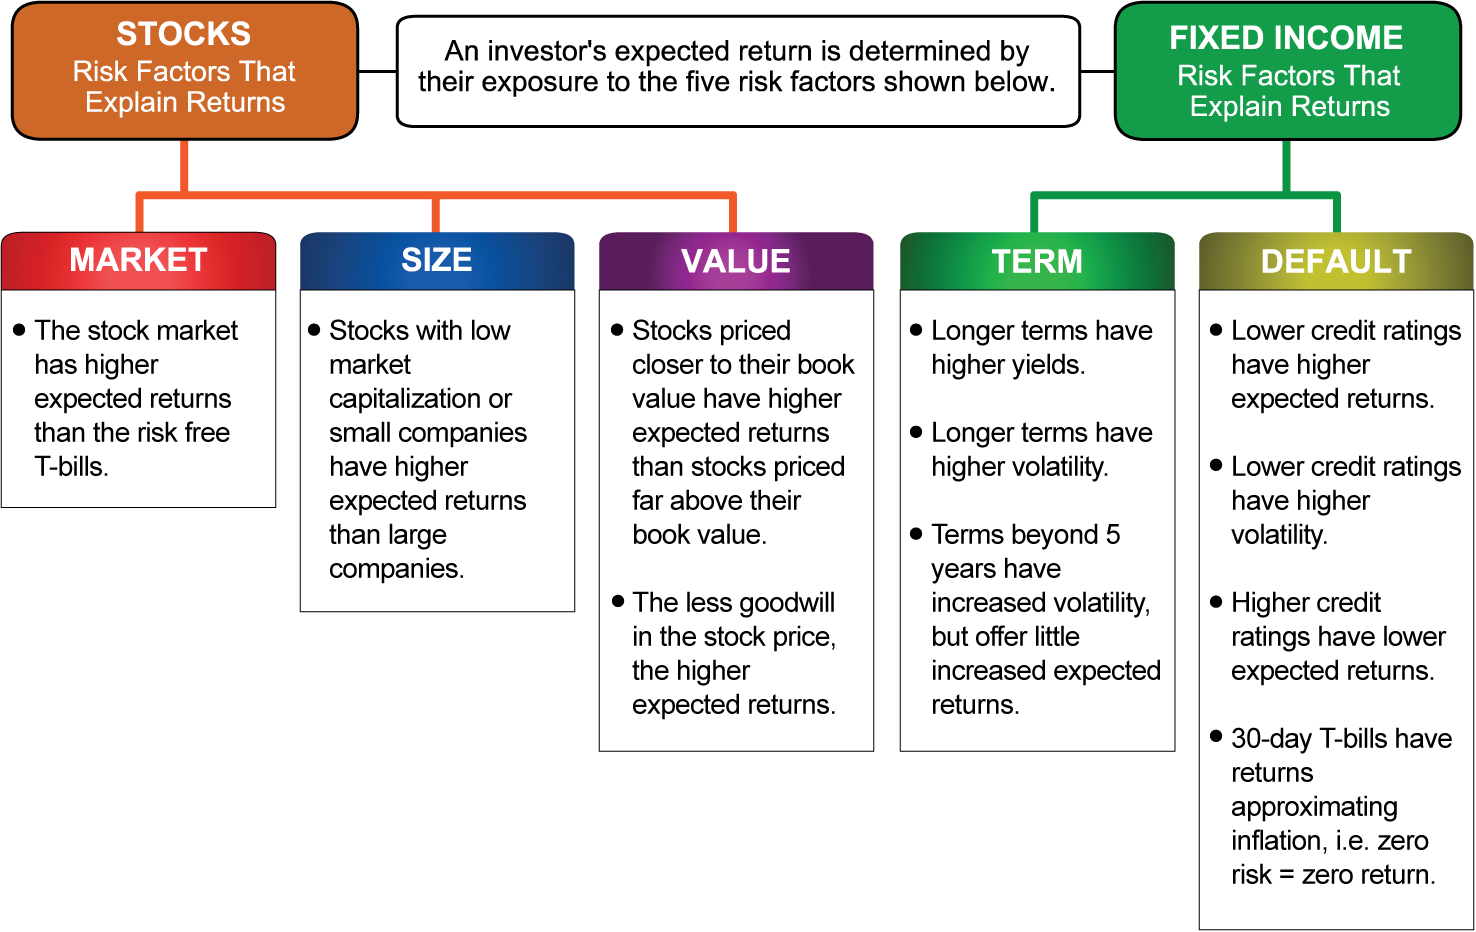
What, then, do investment returns of the last 50 years and more tell us? As you can see from the chart below, stocks have significantly outperformed cash and government bonds historically. But there are certain types of stocks that, over long periods, have delivered higher returns — principally small-cap stocks and value stocks. As for bonds, those with longer terms and lower credit ratings have higher expected returns.
The most logical strategy, then, for most investors, is to invest primarily in stocks. Specifically, those should be the types of stocks that, historically, have delivered higher returns than the broader market.
Remember, investing this way is not risk-free. But it does put the odds of a good outcome firmly in your favor.
Think of risk as uncertainty
So how should we view investment risk? Perhaps the best way is to think of risk is as uncertainty. It's the chance that an investment's actual return will differ from the expected return.
The problem, then, that investors face is how to measure the degree of certainty of a particular outcome. As Pierre-Simon Laplace famously wrote, "the most important questions of life are, for the most part, really only problems of probability."
A useful tool to help you visualize the probability of different outcomes — and not just in investing — is the bell-shaped curve below. The chart shows what statisticians call a normal distribution.
Investment risk can be quantified as the degree to which the returns of the portfolio deviate from the average return during specific periods of time. That deviation can be best described as the standard deviation.
The bell-shaped curve represents a set of outcomes — let's say, the monthly returns of a portfolio. The yellow area covers plus or minus one standard deviation from the average in both directions, and it accounts for approximately 68 percent of the outcomes. The yellow and green areas cover plus or minus two standard deviations from the average, and they account for approximately 95 percent of the outcomes.
The higher an investment's standard deviation the greater the chance that future returns will lie further away from the average return.
Good news and bad news
The good news for investors is that if you invest for a long period of time, there will be some months when your returns are so positive that they fall within the right "tail" of the graph — in other words, three standard deviations or more from the average. The bad news is, there will also be months when the returns are strongly negative and fall within the left tail. You should, however, expect the bulk of your returns to cluster around the middle of the chart.
Of course, if we knew, ahead of time, exactly when the best and worst months are going to be, investing would be much easier. But nobody knows that. As Gary Belsky and Thomas Gilovich explain in their excellent book Why Smart People Make Big Money Mistakes, investors should invest as if they were planning a winter vacation in Minnesota.
"There are occasional warm, sunny days in Minnesota during February," they write, "but good luck trying to predict them much in advance. If unusual, meteorological indicators point to a stretch of warm weather, then fine, you might go ahead and send your winter coat to the dry cleaners. In the absence of such conditions, however, it's best to keep the coat nearby."
In short, be prepared for those bad months and just ride them out. Stay invested for the long term and, crucially, focus on probabilities. You can, of course, hope for the best and prepare for the worst, but what you actually get is likely to be somewhere in between.
In investing, as in life, as Aristotle once put it, the probable is what usually happens.
Robin Powell is the Creative Director at Index Fund Advisors (IFA). He is also a financial journalist and the editor of The Evidence-Based Investor. This article reflects IFA's investment philosophy and is intended for informational purposes only.
This article is intended for informational purposes only and reflects the perspective of Index Fund Advisors (IFA), with which the author is affiliated. It should not be interpreted as an offer, solicitation, recommendation, or endorsement of any specific security, product, or service. Readers are encouraged to consult with a qualified Investment Advisor for personalized guidance. Please note that there are no guarantees that any investment strategies will be successful, and all investing involves risks, including the potential loss of principal. Quotes and images included are for illustrative purposes only and should not be considered as endorsements, recommendations, or guarantees of any particular financial product, service, or advisor. IFA does not endorse or guarantee the accuracy of third-party content. For additional information about Index Fund Advisors, Inc., please review our brochure at https://www.adviserinfo.sec.gov/ or visit our website at www.ifa.com.


