It's human nature to strive to decipher ambiguity and complexity. For our early ancestors, recognizing patterns and making sense of the world around them was crucial for survival, and we retain those instincts today. The financial markets are a prime example. We want to understand what's going on, and, crucially, predict what's going to happen. But anyone who's ever watched CNBC during periods of market volatility will know, even the so-called experts struggle to do it.
In fact, over the centuries, some of the brightest minds have tried and failed. Even Isaac Newton managed to lose around a third of his wealth in the South Sea Bubble in 1720. "I can calculate the motion of heavenly bodies," he is reported to have said, "but not the madness of people."
It wasn't until 1900 that Louis Bachelier, a much lesser-known mathematician than Newton, published a thesis that helped to shape our understanding of how markets work. Even then, his contribution wasn't even recognised until the 1950s.
Short-term Market Movements are Random
It was while studying at the Sorbonne in Paris that Bachelier's interest in the markets developed. Bachelier spent time closely observing proceedings at the Bourse in the Palais Brongniart and was struck by how prices seemed to move in a random manner. This observation led him to question whether there could be a mathematical framework to describe these erratic fluctuations.
The key concept Bachelier grasped was that markets are competitive, with a buyer and seller for every trade. When more people want to buy, the price goes up; when more people want to sell, it goes down. The problem is, there are all sorts of factors that affect investor sentiment — the economy, for example, wars, elections, technological changes and even the weather.
Bachelier realized that accurately predicting these different factors and their impact on the market was all but impossible. The best investors can do is to assume, at any point in time, that the price is as likely to go up as it is to go down.
"There is no useful information contained in historical price movements of securities," he wrote, and, therefore, "the mathematical expectation of the speculator is zero. Thus, the market, from the point of view of a speculator, has no ‘preference' or ‘bias.' This implies that fluctuations in stock prices are independent and normally distributed."
Price Fluctuations are Normally Distributed
So what exactly did Bachelier mean by saying that the expected future price of a stock is described by a normal distribution?
Well, normal distribution is a concept that is largely credited to the early 19th century German mathematician Carl Friedrich Gauss. It's a way to describe how any set of outcomes is spread out.
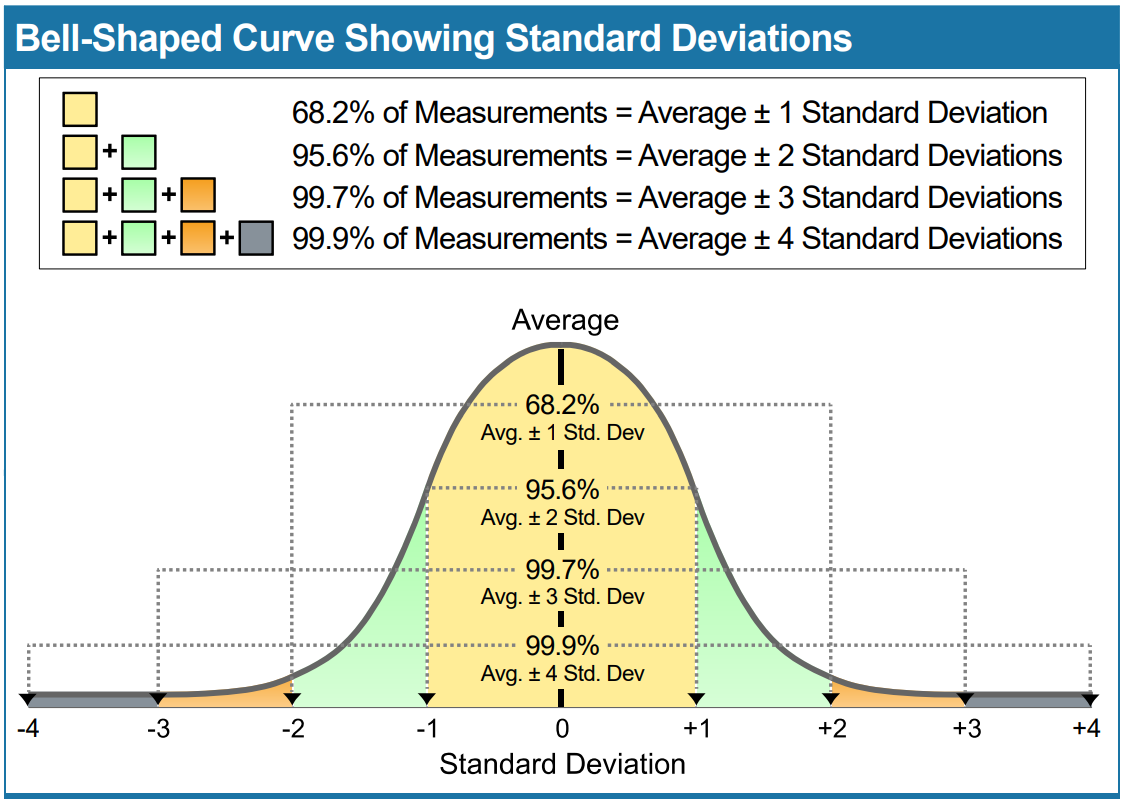
The bell-shaped curve in the graph below represents a normal distribution. Let's say, in this case, the outcomes are the monthly returns of an investment. Most of the data points are clustered around the middle, forming a high peak, and fewer data points are at the ends, making the curve drop down smoothly on both sides. The so-called standard deviations on the horizontal access show how much bigger or smaller the returns are compared to the average.

The higher an investment's standard deviation, the greater the chance that future returns will lie further away from the average return.
The key lesson is that although, on a daily basis, stock prices move up and down in a random fashion, over much longer periods of time, all of these movements, in aggregate, result in a predictable pattern.
Introducing the Galton Board
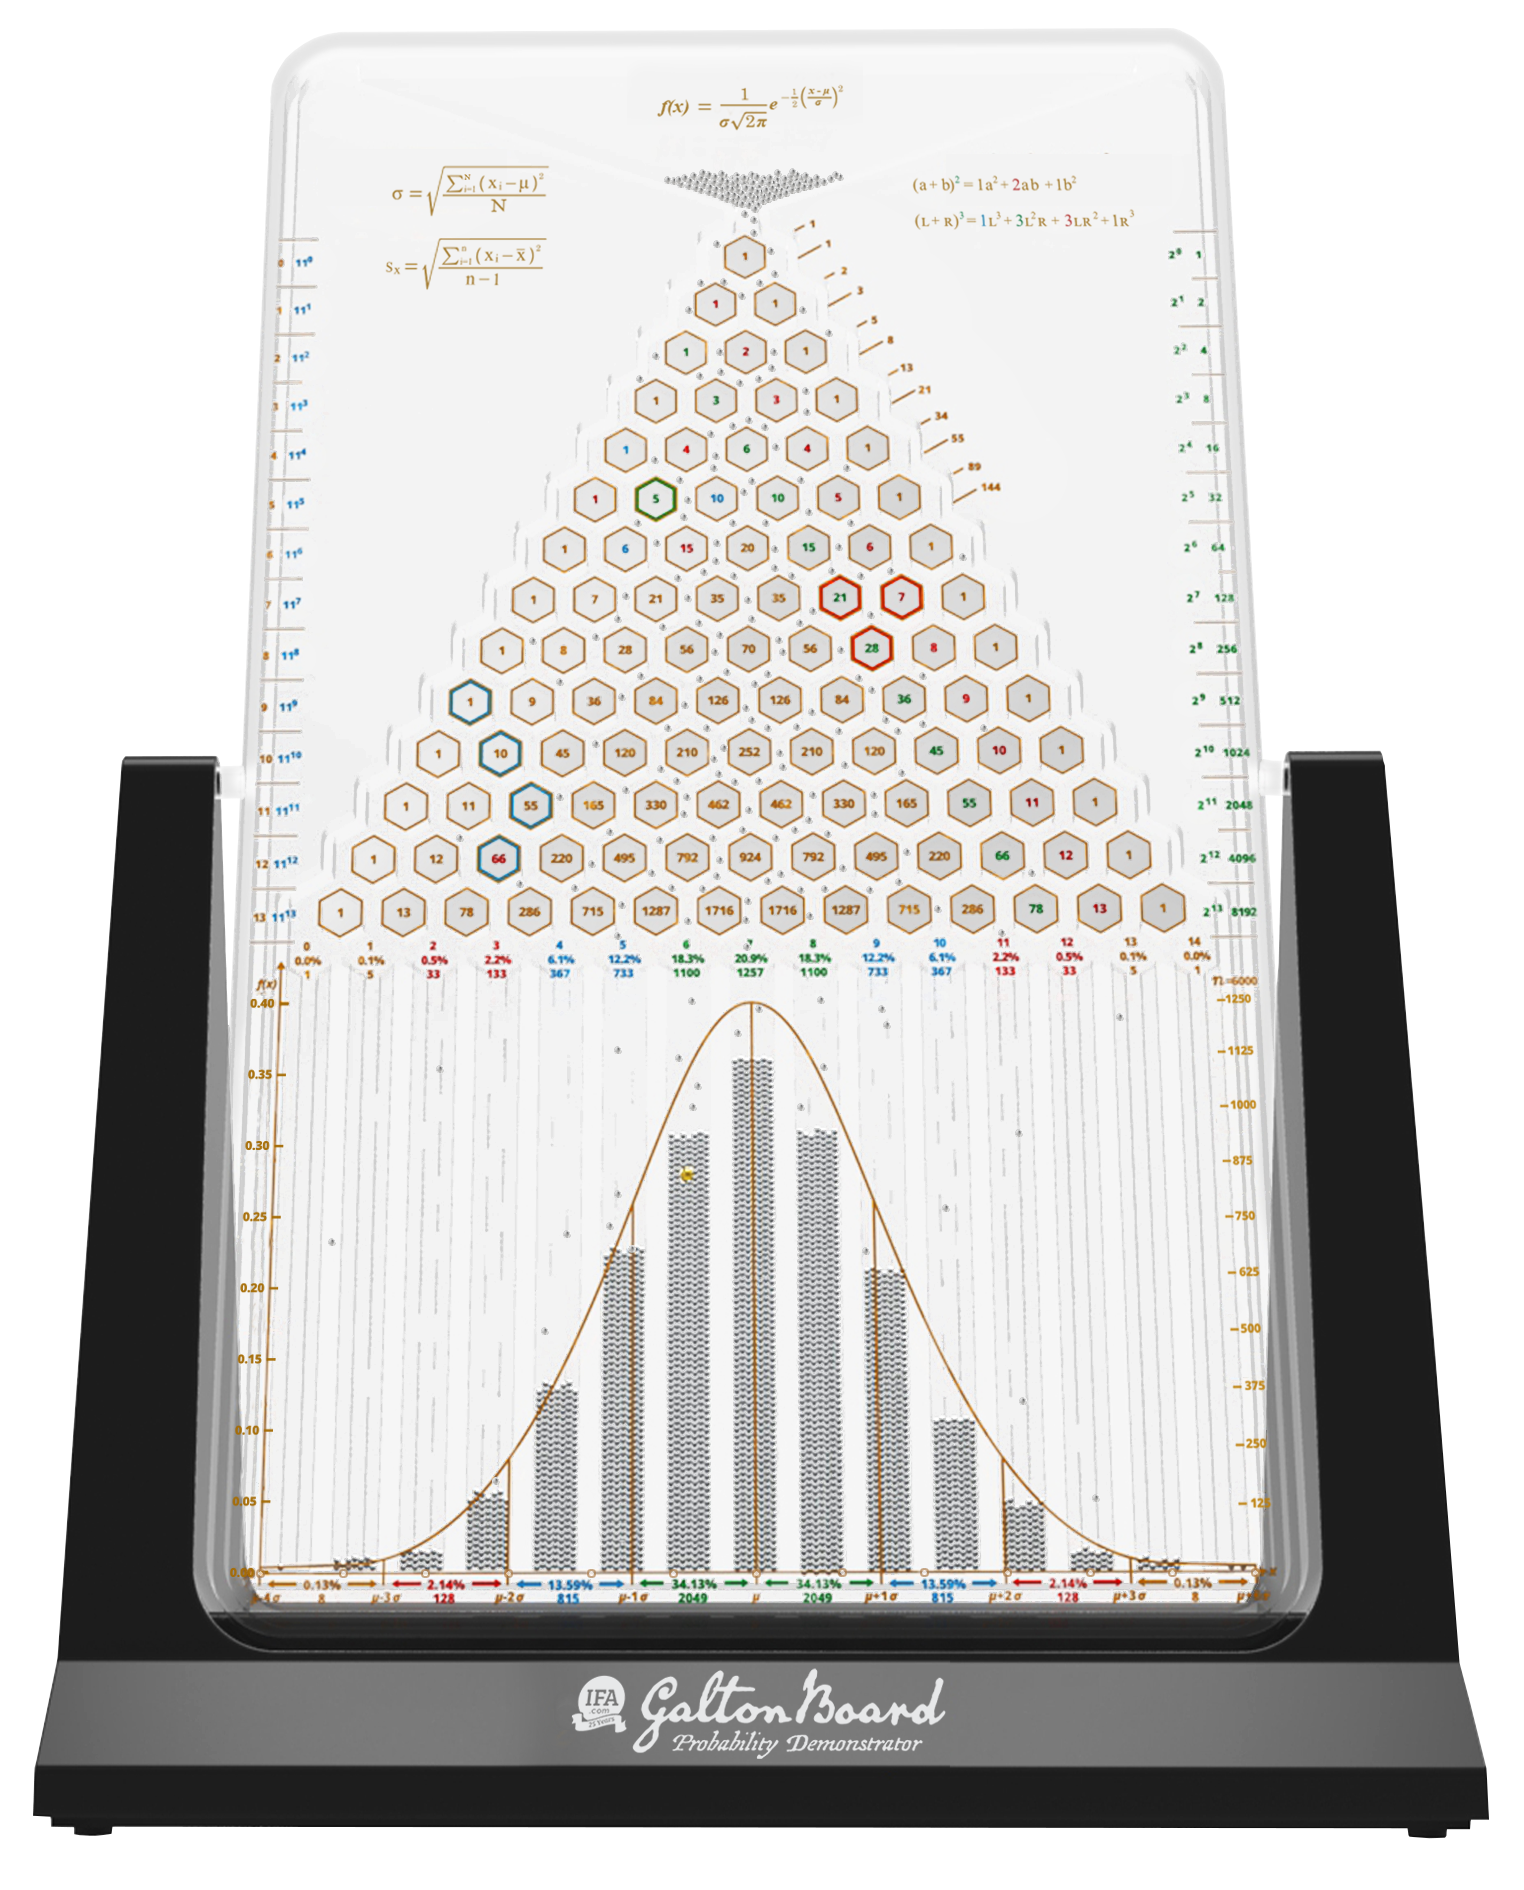
A simple yet powerful way of visualizing a normal distribution of investment returns is to look at a Galton Board. Also known as a quincunx, a Galton Board is a device invented by the British polymath Sir Francis Galton in the 1870s. It's a vertical board with a series of pegs arranged in a triangular grid. Below the pegs are bins to catch balls that fall through the pegs.
When you drop a ball from the top of the board, it bounces off the pegs as it falls. Each time it hits a peg, it can bounce either left or right with equal probability. After many balls have been dropped, they accumulate in the bins at the bottom. The pattern of the balls in the bins forms a shape that looks like a bell curve or a normal distribution.

Long-term Prices Have an Upward Bias
Reassuring though it is to see that very long-term investment returns form a predictable pattern, some people may be put off investing in equities by Bachelier's assertion that, on any particular day, stock prices are just as likely to go down as they are to go up. You might be thinking, "If that really is the case, why should I invest at all?"
Well, the reason why it's definitely worth investing in equities is that, in the long run, the expected return from stocks is positive. Financial academics refer to this as "drift"— the underlying, expected average rate of return of a stock or the stock market as a whole over time. This drift represents the trend component in stock price movements, reflecting the overall growth trajectory of the asset's value.
Historically, stock prices have risen on approximately 54% of trading days. In other words, prices have a very slight upward bias which is more or less imperceptible over short periods, but, over time, makes a huge difference to investor outcomes.
Risk and Return
Of course, there are no guarantees in investing. As Mark Hebner explains in Step 8 of his book, Index Funds: The 12-Step Recovery Program for Active Investors, few investors agree on what that expected return of any particular investment is.
"There are so many ways to determine the expected return that I like to say ‘pick your poison,' Mark writes. "My preference is to use the average of the last 600 months."
"(You can) think of risk as an uncertainty of the expected return. That uncertainty is quantified by the degree to which the returns of the investment deviate from the average return during specific periods of time.
"Higher-risk investments carry a wider range of short-term outcomes but also carry higher expected returns, intended to compensate investors for withstanding short-term volatility, which is an indication of the uncertainty of the expected return.
"In contrast, investments that have had a narrow range of outcomes over long periods of time are expected to provide more consistent returns with the trade-off of lower returns."
Takeaways for Investors
The work of Louis Bachelier and other academics who have built on his 1900 thesis, Théorie de la Spéculation, has huge implications for investors.
The most important thing it teaches us is not to speculate. Ignore the day-to-day noise surrounding the financial markets: it's completely irrelevant.
Focus instead on your long-term goals. Invest in a highly diversified portfolio that reflects your personal capacity for risk and stay invested. Over time, patient investors have been amply rewarded, and there's no reason why they shouldn't be in the future.
You really can find order in the financial markets if you look beyond the chaos.
HOW CAN WE HELP YOU?
Do you have any questions about this subject, or any other issue related to investing? If you do, we would love to address them in future content.
Simply email your question to [email protected] with your name and where you live and we'll do our best to answer it.
Robin Powell is the Creative Director at Index Fund Advisors (IFA). He is also a financial journalist and the editor of The Evidence-Based Investor. This article reflects IFA's investment philosophy and is intended for informational purposes only.
This article is intended for informational purposes only and reflects the perspective of Index Fund Advisors (IFA), with which the author is affiliated. It should not be interpreted as an offer, solicitation, recommendation, or endorsement of any specific security, product, or service. Readers are encouraged to consult with a qualified Investment Advisor for personalized guidance. Please note that there are no guarantees that any investment strategies will be successful, and all investing involves risks, including the potential loss of principal. Quotes and images included are for illustrative purposes only and should not be considered as endorsements, recommendations, or guarantees of any particular financial product, service, or advisor. IFA does not endorse or guarantee the accuracy of third-party content. For additional information about Index Fund Advisors, Inc., please review our brochure at https://www.adviserinfo.sec.gov/ or visit our website at www.ifa.com.


