In addition to the wonders of the holiday season, December brings with it year-end mutual fund dividend and capital gains distributions. At Index Fund Advisors, our portfolio management and research team follows an established strategy to tailor how client portfolios are handled during this time of year.
The gist of such efforts is to avoid buying into a taxable event (i.e., dividend and capital gains distributions) and creating an even bigger tax liability for our clients. So, we thought it might be worthwhile to provide a deeper dive into IFA's basic operating procedure in terms of handling these distributions and how that can change individual client account values over this period.
Below is a table listing mutual funds used in many IFA client portfolos from Dimensional Fund Advisors, which is our preferred funds provider. This table includes the record date, ex-dividend date and payable date for each of these funds. Also, the remainder of this article explains the mechanics of these distributions -- including the effects such activities have on the daily price of these funds.
| Strategy | Ticker | Record Date | December Ex-Div Date | Payable Date |
| Five-Year Global Portfolio (I) | DFGBX | 12/13/2019 | 12/16/2019 | 12/17/2019 |
| Global Real Estate Securities Portfolio | DFGEX | 12/16/2019 | 12/17/2019 | 12/18/2019 |
| Two-Year Global Portfolio (I) | DFGFX | 12/13/2019 | 12/16/2019 | 12/17/2019 |
| Global Allocation 25/75 Portfolio (I) | DGTSX | 12/16/2019 | 12/17/2019 | 12/18/2019 |
| Intl Small Co Portfolio (I) | DFISX | 12/16/2019 | 12/17/2019 | 12/18/2019 |
| Social Fixed Income | DSFIX | 12/13/2019 | 12/16/2019 | 12/17/2019 |
| Intl Small Cap Value Portfolio (I) | DISVX | 12/13/2019 | 12/16/2019 | 12/17/2019 |
| US Vector Equity Portfolio (I) | DFVEX | 12/16/2019 | 12/17/2019 | 12/18/2019 |
| Global Allocation 60/40 Portfolio (I) | DGSIX | 12/16/2019 | 12/17/2019 | 12/18/2019 |
| US Social Core Equity 2 Portfolio | DFUEX | 12/16/2019 | 12/17/2019 | 12/18/2019 |
| One-Year Portfolio (I)* | DFIHX | 12/13/2019 | 12/16/2019 | 12/17/2019 |
| Emerging Small Cap Portfolio (I) | DEMSX | 12/16/2019 | 12/17/2019 | 12/18/2019 |
| Intl. Vector Equity Portfolio | DFVQX | 12/13/2019 | 12/16/2019 | 12/17/2019 |
| TM US Targeted Value Portfolio | DTMVX | 12/16/2019 | 12/17/2019 | 12/18/2019 |
| TM US Small Cap Portfolio | DFTSX | 12/16/2019 | 12/17/2019 | 12/18/2019 |
| Intl Core Equity Portfolio (I) | DFIEX | 12/13/2019 | 12/16/2019 | 12/17/2019 |
| Short-Term Govt Portfolio (I) | DFFGX | 12/13/2019 | 12/16/2019 | 12/17/2019 |
| TA US Core Equity 2 Portfolio | DFTCX | 12/16/2019 | 12/17/2019 | 12/18/2019 |
| TM US Mktwd Value Portfolio | DTMMX | 12/16/2019 | 12/17/2019 | 12/18/2019 |
| Emerging Markets Value Portfolio (I) | DFEVX | 12/16/2019 | 12/17/2019 | 12/18/2019 |
| US Sustainability Core 1 Portfolio | DFSIX | 12/16/2019 | 12/17/2019 | 12/18/2019 |
| Emerging Mkts Core Equity Portfolio (I) | DFCEX | 12/13/2019 | 12/16/2019 | 12/17/2019 |
| Global Equity Portfolio (I) | DGEIX | 12/16/2019 | 12/17/2019 | 12/18/2019 |
| International Social Core Equity Portfolio | DSCLX | 12/16/2019 | 12/17/2019 | 12/18/2019 |
| Emerging Mkts Social Core Eq Portfolio | DFESX | 12/16/2019 | 12/17/2019 | 12/18/2019 |
| Emerging Markets Portfolio (I) | DFEMX | 12/16/2019 | 12/17/2019 | 12/18/2019 |
| TM US Equity Portfolio | DTMEX | 12/16/2019 | 12/17/2019 | 12/18/2019 |
| Intl. Sustainability Core 1 Portfolio | DFSPX | 12/16/2019 | 12/17/2019 | 12/18/2019 |
| TM Intl Value Portfolio | DTMIX | 12/16/2019 | 12/17/2019 | 12/18/2019 |
At the end of each quarter, investors should expect dividend and/or capital gain distributions from their mutual funds. The mechanics may confuse some investors, however. As a result, we wanted to take an opportunity to review this process.
To keep our explanation simple, we'll stick to just reviewing dividend distributions -- not repeating each time how long- and short-term capital gains distributions are handled in the same fashion.
Also, we're only going to consider the case where investors have elected to have their dividends automatically reinvested. (Another important point: while the screen captures shown below are of a Charles Schwab account, the presentation should be similar for Fidelity and TD Ameritrade accounts.)
The Basics
Equity mutual funds are made up of individual stocks. When these stocks pay a dividend, it's passed through to investors just before the calendar quarter-end.
When a mutual fund pays a dividend, there are three dates that are particularly important to investors: the "Record Date," the "Ex-Dividend Date" and the "Payable Date."
The "Record Date" is the official date in which we must be a shareholder of the fund to receive the dividend.
The "Ex-Dividend Date" is the date in which the dividend is scheduled and we see a price reduction of the fund equal to the amount of the dividend and any market price change. For example, if a mutual fund pays a $0.25 dividend and the change in market price is a negative $0.10, investors will see the price of the fund decline by $0.35. This total change in the price of the fund is the reason for this article, because the dollar value of that dividend and the change in the number of mutual fund shares in the account generally don't show up until the next morning and it appears to investors that they lost more money on this ex-dividend date than the $0.10 market decline.
The "Payable Date" is the date in which the dividend is reinvested in more shares (with no transaction fee) and recorded as a transaction in the History & Statements tab of investors account. Generally, the cash dividend will be reinvested in more shares as of the closing price on the "Ex-Dividend Date," resulting in more shares than the investor had on the "Ex-Dividend Date" (the day before). This brings the account back to its record date value, except for market price changes. The only difference for taxable accounts is that the dividend created a tax liability for the investor.
Many IFA clients don't watch their accounts on a daily basis, so they might not notice these changes we're going to discuss. However, some clients do watch their accounts more closely, so we wanted to explain what happens in accounts during this time of dividend distribution and reinvestment. A common question we are asked is: "Why did the price of this fund go down when a comparable index was up or why did my fund go down more than the comparable index?" In short, it has to do with the dividend payment and the overnight lag in the reinvestment of those dividends.
Here are a series of screen captures and descriptions to explain the process of dividend payment and reinvestment.
The Date of Record
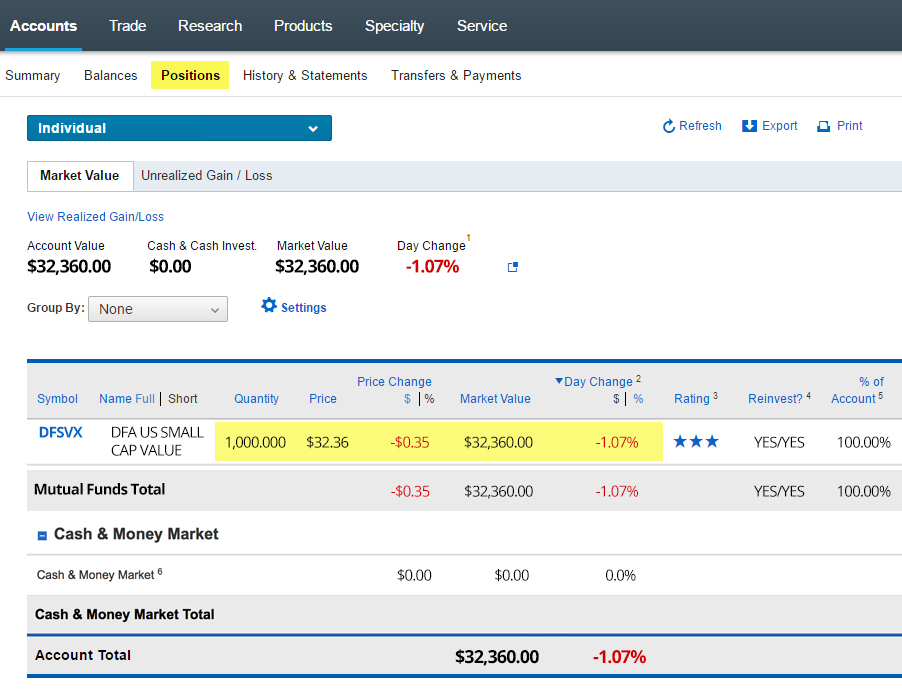
As an example of how this all plays out, let's look at the "Date of Record" for the DFA U.S. Small Cap Value Fund (DFSVX), which was Sept. 26, 2019. The image below shows a typical "Positions" page for a client whose assets are held at Charles Schwab. (Since each client can set up their own displays to view such information, your screen view might appear a bit differently.)
In looking at the DFSVX position, we see a closing price of $32.36. With a "Quantity" of 1,000 shares, the total "Market Value" is shown as $32,360.00
The price change is minus $0.35 because the price is $0.35 less than it was at the close of the market the day before. In terms of a percentage, this equates to a 1.07% decrease in the value of DFSVX.
Sept. 26th Screen Capture
The Ex-Dividend Date
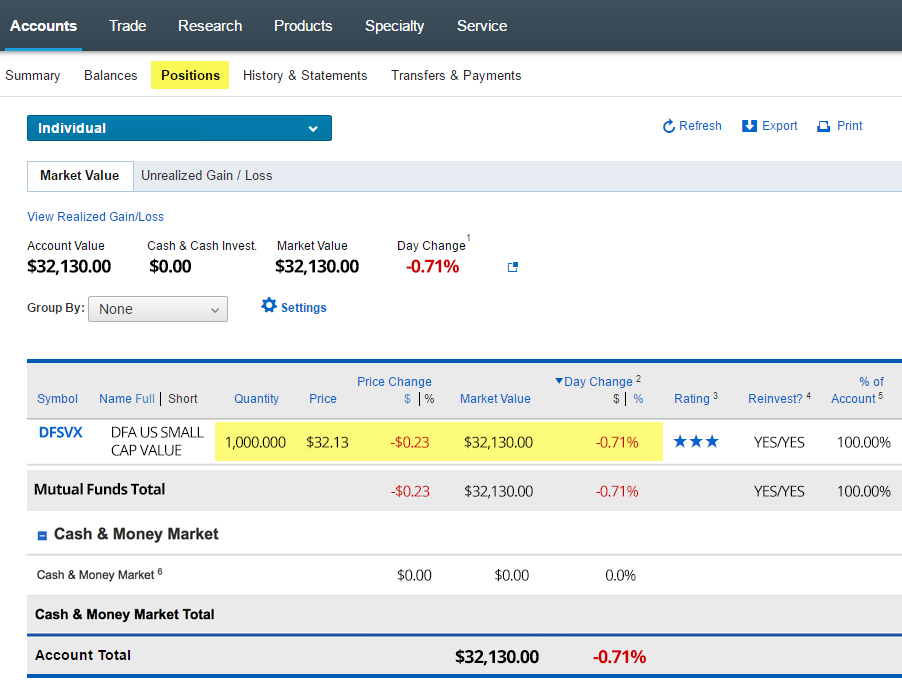
The next day, Sept. 27th, was the "Ex-Dividend Date" for DFSVX shareholders of record. DFSVX closed at $32.13 per share, which was $0.23 less than the day before. This decrease of $0.23 was made up of the subtraction of $0.106 for the dividend payment and a $0.12409 market price decrease from the day before.
A dividend of $0.106 per share was scheduled, but the cash or reinvested dividends were not visible in this evening screen shot. As you will see in a minute, the reinvested dividend is not visible until the next morning. With 1,000 shares of DFSVX, we should be expecting to receive approximately $1.06 in total dividends. Given today's closing price of $32.13/share, we should get 3.296 additional shares on the morning of Sept. 30, 2019 (the next day in which the market was open).
The image below shows the same "Positions" page as of the evening of the market close on Sept. 27, 2019 (Ex-Dividend Date).
Sept. 27th (evening) Screen Capture
The Payable Date (Morning)
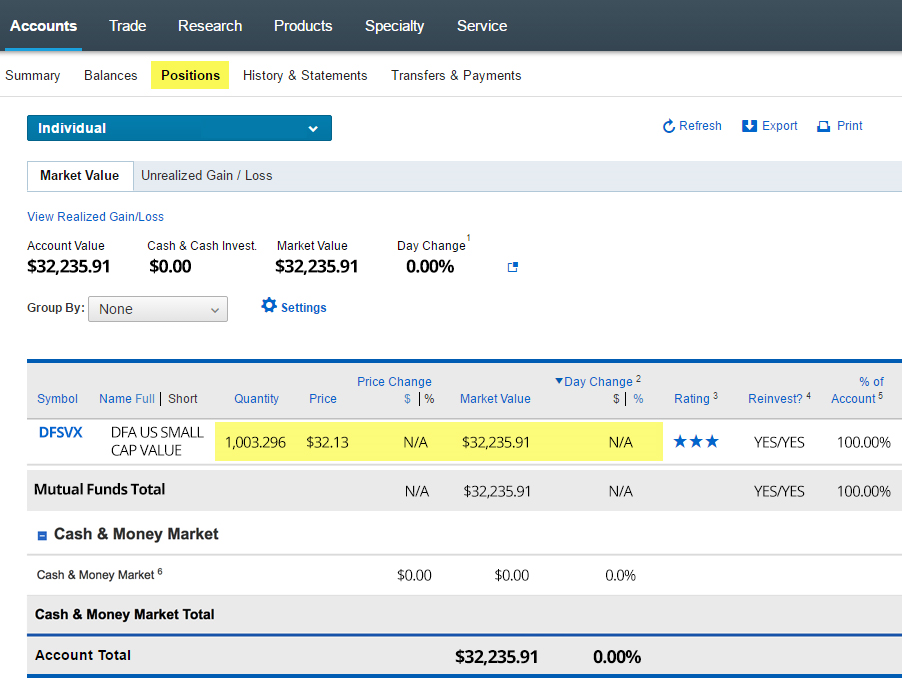
The image below shows the same "Positions" page on the morning of Sept. 30, 2019 (e.g., the "Payable Date"). Overnight, Schwab completed the transaction to the purchase of more shares of DFSVX from the cash dividend. The $1.06 in dividend payments on Sept. 30th was reinvested at the Sept. 30th closing price of $32.20, so the new quantity of shares increased by 3.296 ($1.06 of cash divided by the $32.20 per share). As a result, the "Quantity" of shares increased from 1,000.000 to 1,003.296. At that point in time, the pre-dividend and post-dividend "Market Values" are the same, except for the market price change.
If you take the $32,235.91 "Market Value" from the morning of Sept. 30th and add back the market decline of Sept. 27th (-$0.12409 times 1,000 shares = -$124.09), you get the exact same value of $32,235.91, which was the closing "Market Value" of Sept. 26. So the dividend payment did not add anything to the investor's "Market Value." However, if you held this fund in a taxable account, a dividend payment results in an overall negative event because you ended up with a tax liability for the dividend. Most investors think they are getting something extra for their dividend, but they are not and for taxable investors, it actually has a negative impact after we account for taxes. Our total market value has now increased to $32,235.91.
Sept. 30th (morning) Screen Capture
The Payable Date (Market Close)
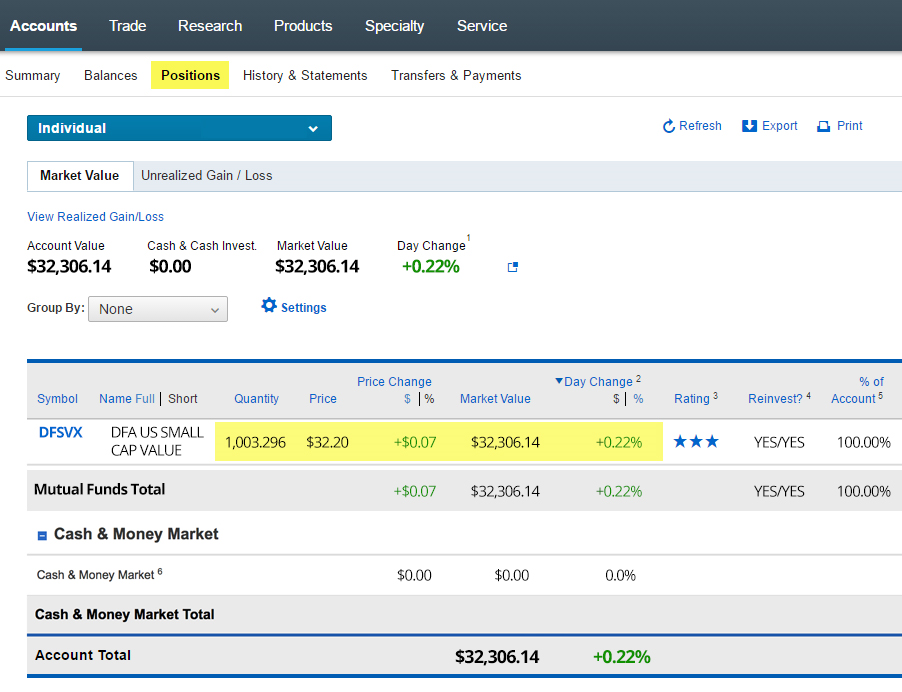
The image below shows the same "Positions" page as of the market close on Sept. 30, 2019 ("Payable Date").
If we look at the DFSVX position we see a closing price of $32.20, which is $0.07 higher than it was the day before due to a market price change. With 1,003.296 shares, our total "Market Value" now comes out to $32,306.14. In terms of a percentage, this equates to a 0.22% increase in the value of DFSVX.
Sept. 30th (market close) Screen Capture
Our dividend payment and reinvestment process is now complete from "Date of Record" to "Ex-Dividend Date" and finally to the morning and evening of the "Payable Date."
Capital Gains Distributions
As we mentioned in the introduction, the same process can be applied to long term and short term capital gains distributions. Throughout the year, fund managers buy and sell securities. They earn distributable capital gains when the gains exceed losses, which accumulate and add to the price of the fund until they are distributed. Once they are distributed, the price of the fund will decrease by the amount of the capital gains.
Most capital gains are distributed at the year-end and when dividends are added, this creates a much larger total distribution versus other quarters. Similar to dividends, investors do not lose or gain any money in the process. But there are tax liabilities created by both distributions, which is one good reason to take advantage of tax loss harvesting opportunities when they exist.
If you have further questions regarding dividends and capital gains distributions and their effect on the price of a fund, please contact your IFA wealth advisor at 888-643-3133.
This is not to be construed as an offer, solicitation, recommendation, or endorsement of any particular security, product or service. There is no guarantee investment strategies will be successful. Investing involves risks, including possible loss of principal. Performance may contain both live and back-tested data. Data is provided for illustrative purposes only, it does not represent actual performance of any client portfolio or account and it should not be interpreted as an indication of such performance. IFA Index Portfolios are recommended based on time horizon and risk tolerance. Take the IFA Risk Capacity Survey (www.ifa.com/survey) to determine which portfolio captures the right mix of stock and bond funds best suited to you. For more information about Index Fund Advisors, Inc, please review our brochure at https://www.adviserinfo.sec.gov/ or visit www.ifa.com.

