The Matrix Book: A Dimensional Tradition
"Data! Data! Data!" he cried impatiently, "I cannot make bricks without clay!"
— The Adventures of Sherlock Holmes, The Adventure of the Copper Beeches - Sir Arthur Conan Doyle, 1892
Call us data geeks. At Index Fund Advisors, one of the things we look forward to every year is the latest release of the Matrix Book by Dimensional Fund Advisors. That's especially true in the 2021 version, which marks the 40th annual edition of the book.
For those who are not familiar with it, this compendium of returns data goes back as far as 1926 and covers more than 60 different indexes and asset classes. Also included are allocation breakdowns among the different benchmarks used in a dozen of Dimensional's index wealth model allocations. Like the IFA Index Portfolios, these models track more than 13,000 stocks across 40-plus countries.
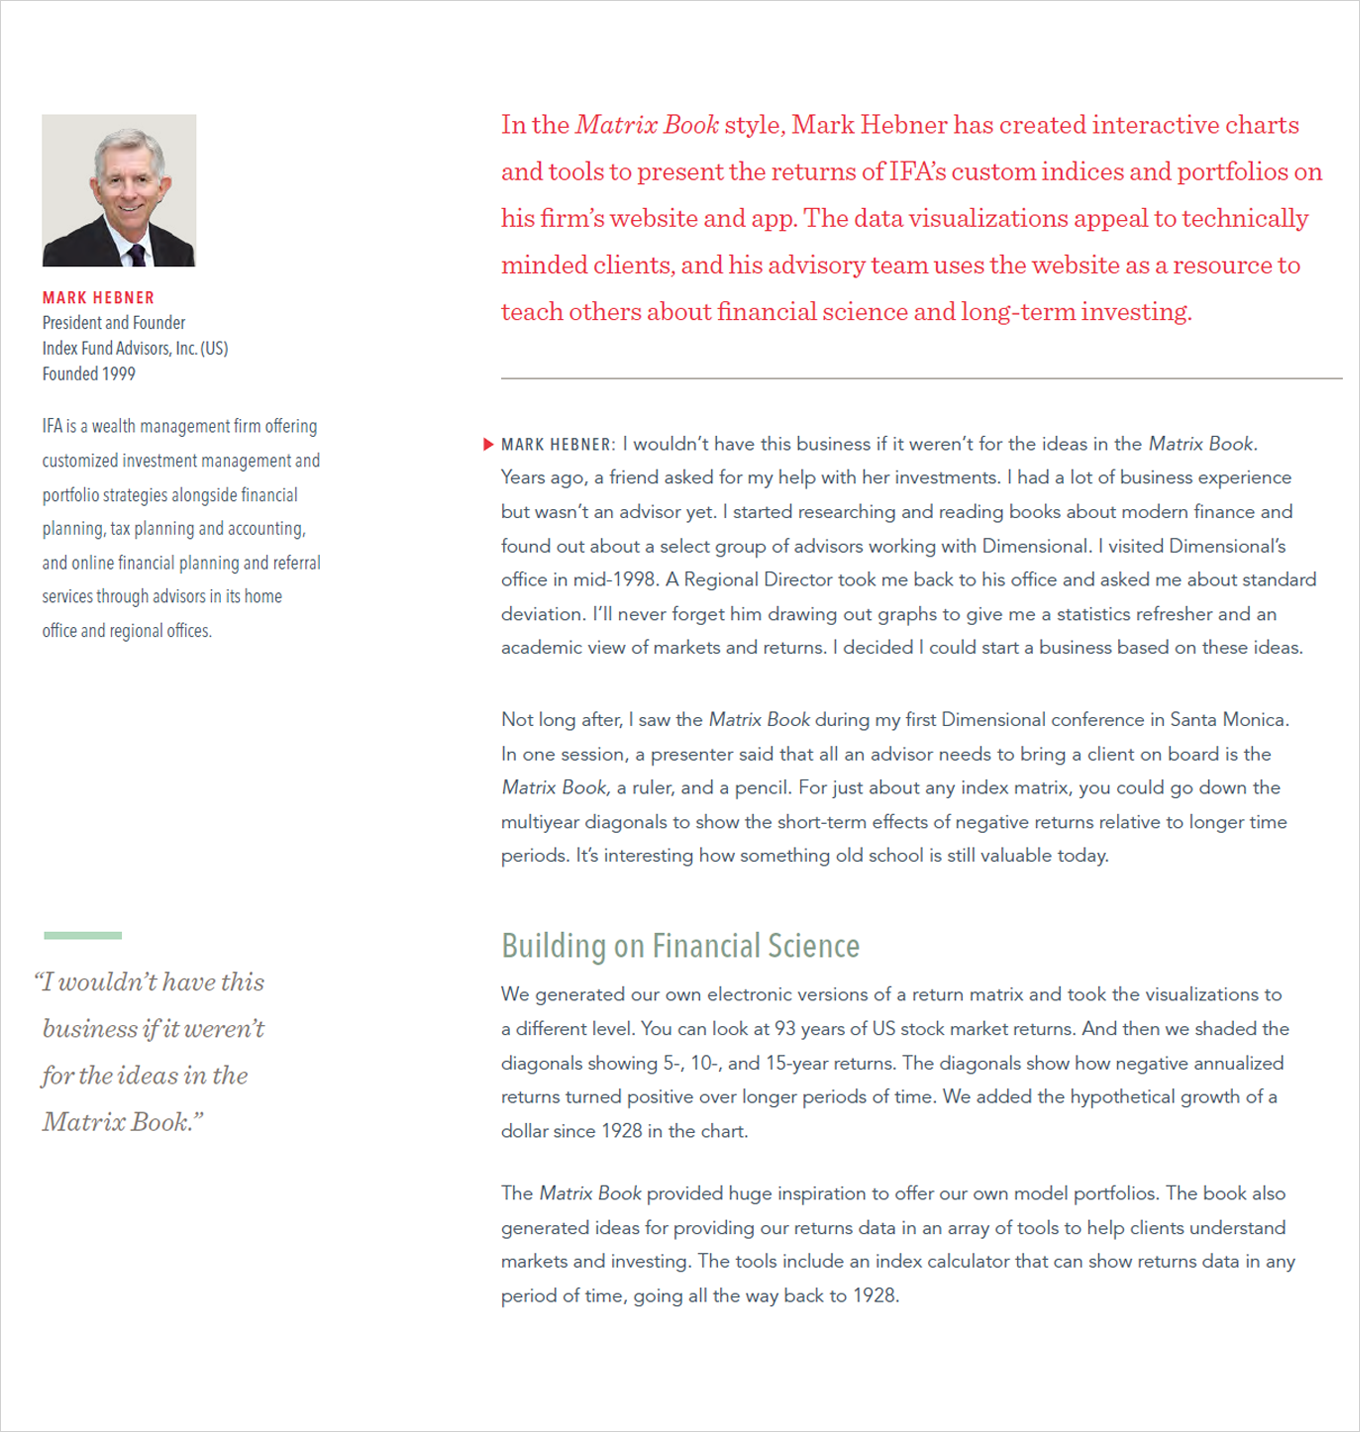
Besides such a plethora of historical information, this year's edition features three industry luminaries — one of which is Mark Hebner, Founder and President of Index Fund Advisors.
In this piece, he describes how important of a resource the Matrix Book has become over the years in his studies of financial markets. It also relates how exposure to Dimensional's academic view of investing helped influence his decision to start IFA, which opened in March of 1999. He wrote:
"I visited Dimensional's office in mid-1998. A Regional Director took me back to his office and asked me about stantard deviation. I'll never forget him drawing out graphs to give me a statistics refresher and an academic view of markets and return."
A little while later, Hebner came across the Matrix Book during an investments conference at Dimensional. "For just about any index matrix, you could go down the multiyear diagonals to show the short-term effects of negative returns relative to longer time periods," he noted. "It's interesting how something old school is still valuable today." See below the first of his two pages that are featured in the book.
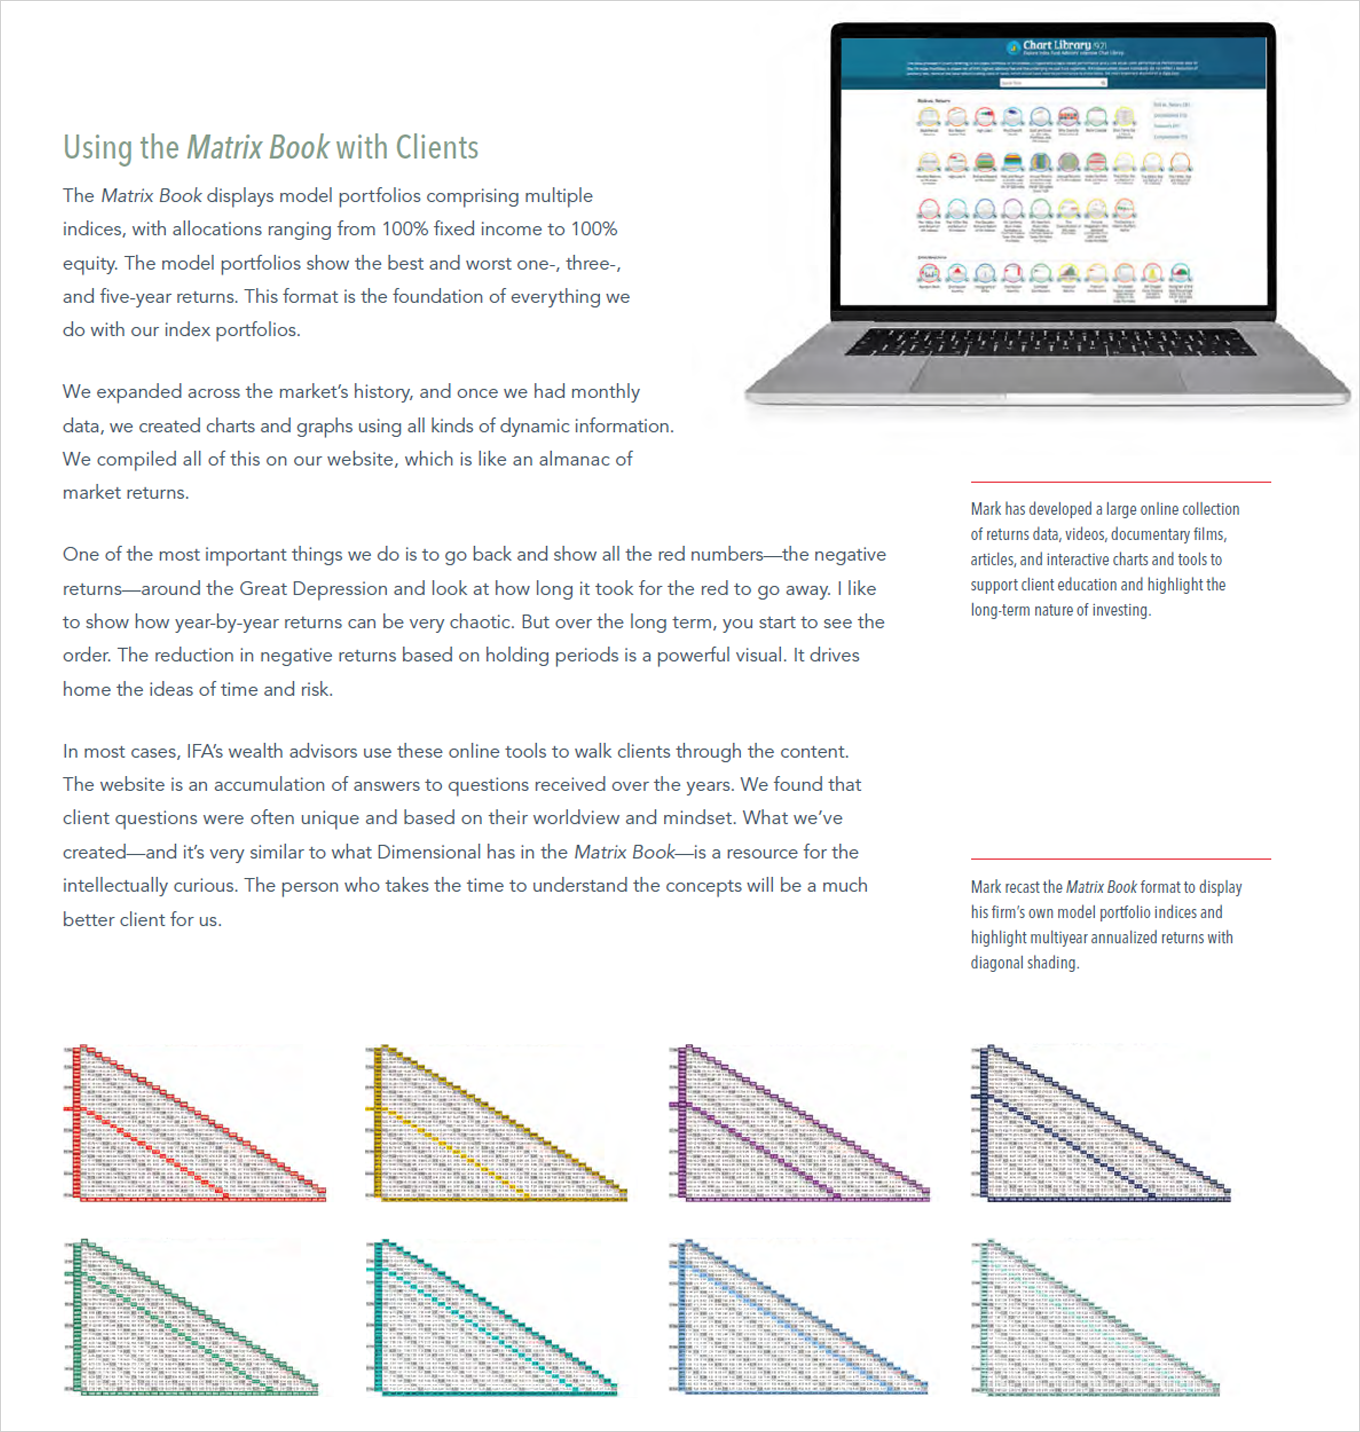
On the second page, Hebner explains how the book's basic outline has been adapted and expanded through new software technologies to provide IFA.com's readers with the latest financial news and information.
"This format," Hebner wrote, "is the foundation of everything we do with our index portfolios."
Starting from an index's initial full-calendar year worth of returns, the book is organized into triangular matrices, which enables investors to quickly find the historical annualized average rate of return.
For example, we can determine that the S&P 500 Index had an annualized return of 10.7% from 1970 through 2020 by simply looking along the triangle's top row marking the first year, then going down that column to the end date.
With such a clever layout, we find the Matrix Book even easier to track returns over longer periods than working off a standard returns spreadsheet generated by Excel or some other financial program.
Still, one may ask: "Why in this age of ubiquitous computers, would we need a book of returns calculations?"
Good question. The answer is simply that this book allows us to see the returns from a holistic point of view — i.e., one we just can't get from a computer screen, especially not from a smartphone screen. For instance, it's possible to quickly determine that no matter how bad of a slump took place in the S&P 500, an investor's perception of such a period's aftereffects on a portfolio were probably worse than the real results.
Using the matrix of the S&P 500 Index Inflation Adjusted, we can immediately find 1929's S&P 500 negative return 0f -8.9% marked in red. By glancing down at the string of red returns, which goes unbroken until 1936, it quickly becomes apparent that the Great Depression lingered through 1942, where the compounded return for that period was -0.2% (adjusted for inflation).
Another neat feature is that if you just want to look at a few years, you can cross-reference returns using each chart's bottom axis, then go up to the corresponding vertical axis to find a particular year's returns. Also, charts for every index on the upper right-hand side graphically display the growth of $1 from the first year considered through the last calendar period compared.
The Matrix Book was first published in 1982, which was a year after Dimensional's launch. Its guiding vision came from one of the fund company's two original founders, David Booth. Besides a treasure trove of data, each matrix book has its own cover picture and introduction. All of these covers are shown below. For more details of each of these editions, search Matrix book in IFA's Book Library.
Click on image for in-depth details of each Matrix book.
In the 2021 edition, Hebner examines different ways such detailed market data as supplied by the Matrix Book can be used to help educate investors of all types — from novices to more experienced ones.
As he related in his piece, IFA has taken advantage of computerized access to monthly data to "create charts and graphs using all kinds of dynamic information." This has all been compiled on IFA.com to serve much like "an almanac of market returns," Hebner added.
Along these lines, he likes to show investors "how year-by-year returns can be very chaotic." Through use of online charts, tables and other graphics, Hebner pointed out that "over the long term, you start to see the order." As he put it: "The reduction in negative returns based on holding periods is a powerful visual. It drives home the ideas of time and risk."
In particular, IFA has used the Matrix Book as a basis to build an even wider range of data for our benchmarks and Index Portfolios. In this example for IFA Index Portfolio 70, among other things, investors can view monthly rolling risk-and-return data going back more than 93 years. You can see our web-based version of a matrix for Index Portfolio 70 here. We've also built charts to measure different Simulated Passive Investor Experiences (SPIEs), including the ability for investors to customize periods studied.
In our view, these latest computer-based tools don't take away from the enduring value of The Matrix Book. Such an 'old-school' presentation of returns data is an enduring concept in finance that will never become obsolete. IFA is looking forward to many more years of reading such a work and utilizing it to help our clients to reach their overarching wealth-building goals.
To better understand the intellectual and academic origins that's made Dimensional our preferred funds provider, we've compiled a number of video interviews between Booth and Hebner. You can view this series by clicking here.
This is not to be construed as an offer, solicitation, recommendation, or endorsement of any particular security, product or service. There is no guarantee investment strategies will be successful. Investing involves risks, including possible loss of principal. Performance may contain both live and back-tested data. Data is provided for illustrative purposes only, it does not represent actual performance of any client portfolio or account and it should not be interpreted as an indication of such performance. IFA Index Portfolios are recommended based on time horizon and risk tolerance. Take the IFA Risk Capacity Survey (www.ifa.com/survey) to determine which portfolio captures the right mix of stock and bond funds best suited to you. For more information about Index Fund Advisors, Inc, please review our brochure at https://www.adviserinfo.sec.gov/ or visit www.ifa.com.


