As advocates for passive investing, a common question we hear is:
Why do IFA Index Portfolios prefer mutual funds and exchange-traded funds managed by Dimensional Fund Advisors instead of those of Vanguard?
By assets managed, it's certainly true that Vanguard stands as the industry's largest provider of index funds. Although we appreciate Vanguard's contributions to the field of indexing, our investment committee doesn't try to design globally diversified portfolios based soley on size and name recognition. Rather, our investment recommendations are made after studying a fund's risk-adjusted performance characteristics over the longer haul.
In fact, we do offer an all-Vanguard version of the IFA Index Portfolio. In many cases our wealth advisors have — in consultation with their clients and based on individual goals and preferences— recommended implementations built mainly around Dimensional funds, although Vanguard funds remain a viable option for certain investors.
Along these lines, let's take a deep dive into how Dimensional has been able to deliver a track record that has stood out to us over time, both in terms of execution and design.
First, let's review the Fama/French 3 Factor Model, which was introduced in 1992 in their groundbreaking research paper, "The Cross-Section of Expected Returns."
Examining U.S. equity returns from 1962 to 1989, professors Eugene Fama and Kenneth French found three key factors that explained much of the variation in historical stock returns. Those were the market, size and relative-price (value) premiums. Later, they expanded the three-factor model to include term and default factors identified in bonds. In fact, such findings led to an industry-wide expansion from large-cap focused passively managed funds to those designed around small-cap stock indexes.
When trying to understand these risk factors, it's important to become familiar with the terminology used in explaining how these factors work. At IFA, we refer to this sort of investment langague as "Riskese." (See graphic below.)
From an investment advisory standpoint, guiding investors to build globally diversified portfolios of index funds structured around these factors have generally yielded better results over the longer-term. For example, let's extend the original period covered by the Fama/French research paper. From 1962 through 2024, the all-stock and globally diversified IFA Index Portfolio 100 produced a premium of .76% on an annualized total return basis (net of advisory fees) over the IFA SP 500 Index (11.94% vs. 11.19%). In terms of the growth of $1,000 during this timeframe, the IFA Index Portfolio 100 would've returned $425,460.33 more than the large-cap focused domestic stock index, counting dividends. (The preceeding was based on hypothical back-tested performance to evaluate long-term outcomes and was not the result of actual client outcomes. See disclosure below.)
When we examine which types of funds we would like to include in our portfolios, we want to be able to gain a general understanding of how much exposure each fund has towards these three factors. We are able to do this through the use of multiple regression analysis.
A multiple regression measures correlations between a dependent variable and multiple independent variables. The question we are asking is, "how well do the independent variables explain the variation of the dependent variable?" To give a practical example, if we were looking at the Vanguard Value Index Fund, we want to know how much of the variation of the fund is explained by the market, size and relative-price factors — independently. The diagram below illustrates a multiple regression equation used in quantifying the Fama/French 5 Factor Model.

If we can gain an understanding of how much a fund is exposed to these various factors, then we can start to evaluate expectations for its future returns. For instance, let's compare the performance of the Vanguard Value Index Fund (VIVAX) versus the DFA U.S. Large Cap Portfolio (DFLVX) from Oct. 1, 1999 to Dec. 31, 2024 — the longest full-year period in which performance for both is available.
As you can see, DFLVX outperformed VIVAX by 1.04% per year. Aren't they both large-cap value funds? Yes they are, but don't let the names fool you. The ability for a fund management company to capture premiums in the market varies greatly between fund providers. In other words, there is very little argument about whether or not these premiums exist. How a fund company goes about capturing such premiums, however, is a completely different story. (Notice that Dimensional outperformed Vanguard across the U.S. Small Cap and U.S. Small Cap Value asset classes as well.)
Along with our own studies of these funds, a wealth of academic research leads us to conclude that DFA's outperformance must be coming from this fund family's ability to provide significant exposure — i.e., greater sensitivity — to the market, size and relative price premiums. This can be seen in the individual regressions for DFLVX and VIVAX. While DFA has demonstrated stronger factor tilts in this analysis, Vanguard funds offer cost-effective solutions with different attributes that may better align with the goals of other investors. Fund selection depends on multiple factors, including fees, accessibility, and investor preferences.
Let's first explain the variables:
- Alpha (α): the excess return of the fund compared to its risk-adjusted (β) benchmark
- MKT-Rf: measures the fund's sensitivity to the market factor. A numerical value greater than 1 indicates the fund is more volatile than the overall market and vice versa
- SmB: measures the fund's sensitivity to the size factor. A positive number indicates an overall exposure that tilts towards small-cap stocks while a negative number indicates a tilt towards large-cap stocks
- HML: measured the fund's sensitivity to the relative-price (value) factor. A positive number indicates an overall exposure that tilts towards value stocks while a negative number indicates a tilt towards growth stocks.
- Adjusted R2: measures how well the overall model explains the variation of the fund, adjusting for the amount of independent variables. You can read the number as a percent
- T-Statistic: indicates the level of statistical significance of the estimate in the model. A level of 2 or greater indicates a high level (97.5%) of statistical significance, making the estimates highly reliable.
We can use the same analysis when comparing DFA and Vanguard in the U.S. Small-Cap and U.S. Small Cap Value segments of the market. (See chart below.)
In reviewing such data, one thing you should notice is that neither fund has a statistically significant alpha, which is what we would expect when the funds are designed to capture the market's returns (minus the fund's management fee).
Lastly, if we look at the individual risk premiums we see that DFLVX has greater exposure to the market, size and relative-price factors — meaning that the overall portfolio is slightly smaller in terms of market capitalization and has a greater tilt towards value stocks compared to that of VIVAX. Also keep in mind with a t-stat greater than two, these estimates can be considered to be highly reliable on a statistical basis.
Greater exposure to these factors is generally associated with higher expected returns over time, though this is not guaranteed and past performance is not indicative of future results. This exposure may help explain the historical outperformance of the DFA funds over the Vanguard index funds compared in this study. Past performance is not indicative of future results, and no investment decision should rely solely on historical comparisons
It's important to note that higher expected returns are not free. In properly functioning capital markets, higher returns must be associated with higher risks. If we utilize standard deviation as a measure of risk, we can see there are higher levels of risk associated with the strategies from DFA. As a result, we'd expect to see more variability in the returns of the DFA strategies, emphasizing the importance of taking a disciplined approach to investing when you're pursuing risk premiums. IFA's wealth advisors strive to assist investors in maintaining that discipline in capturing the benefits of capital markets over time.
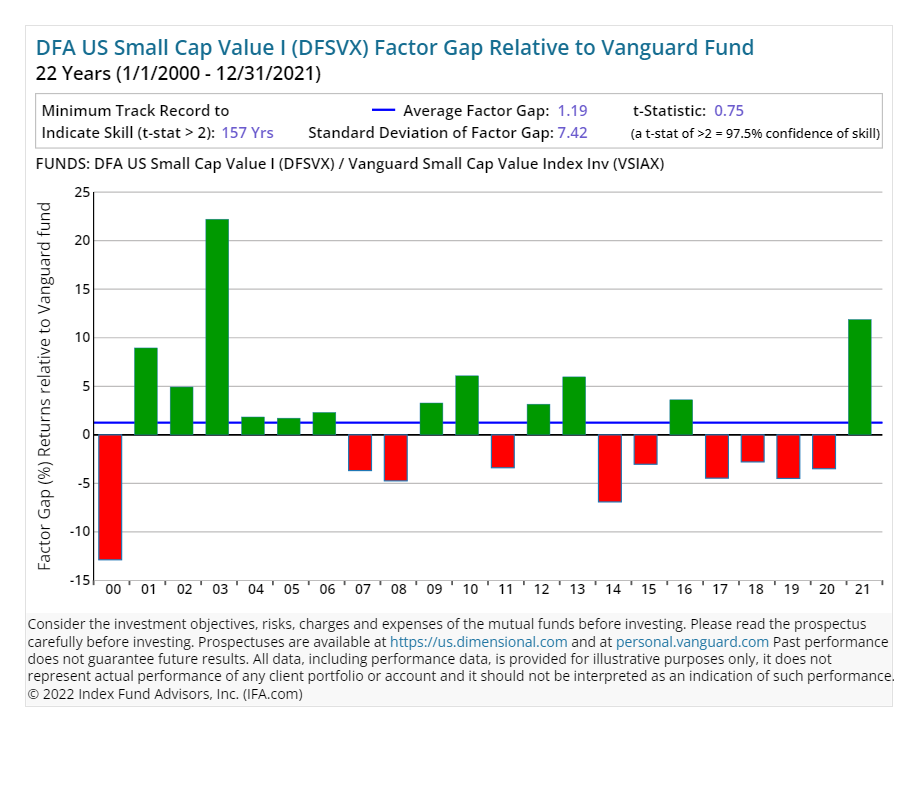
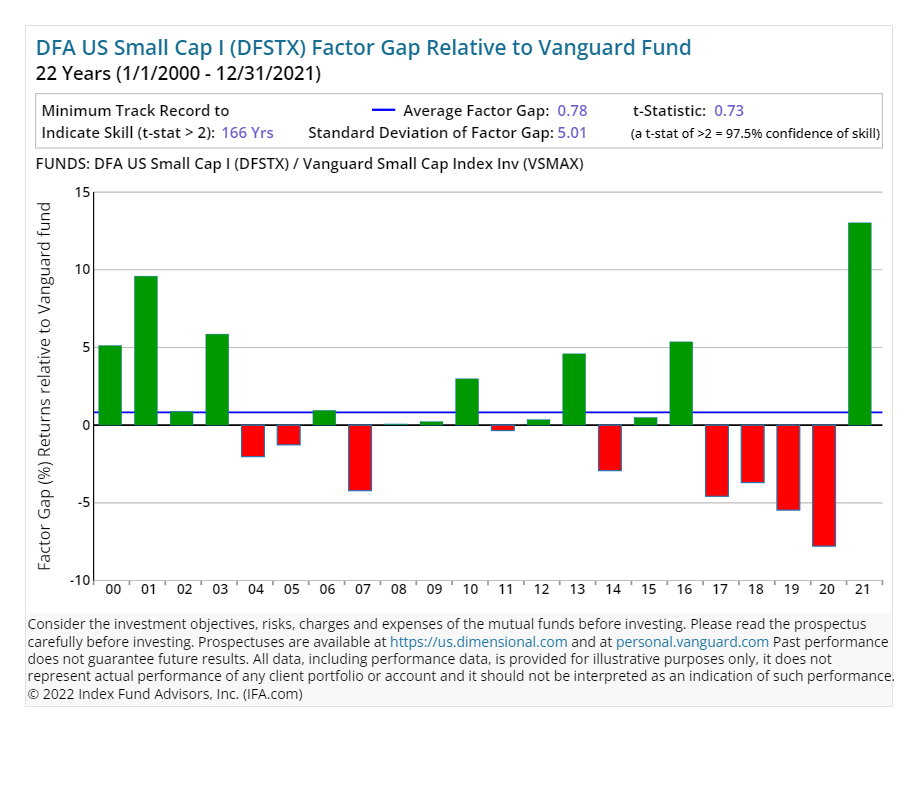
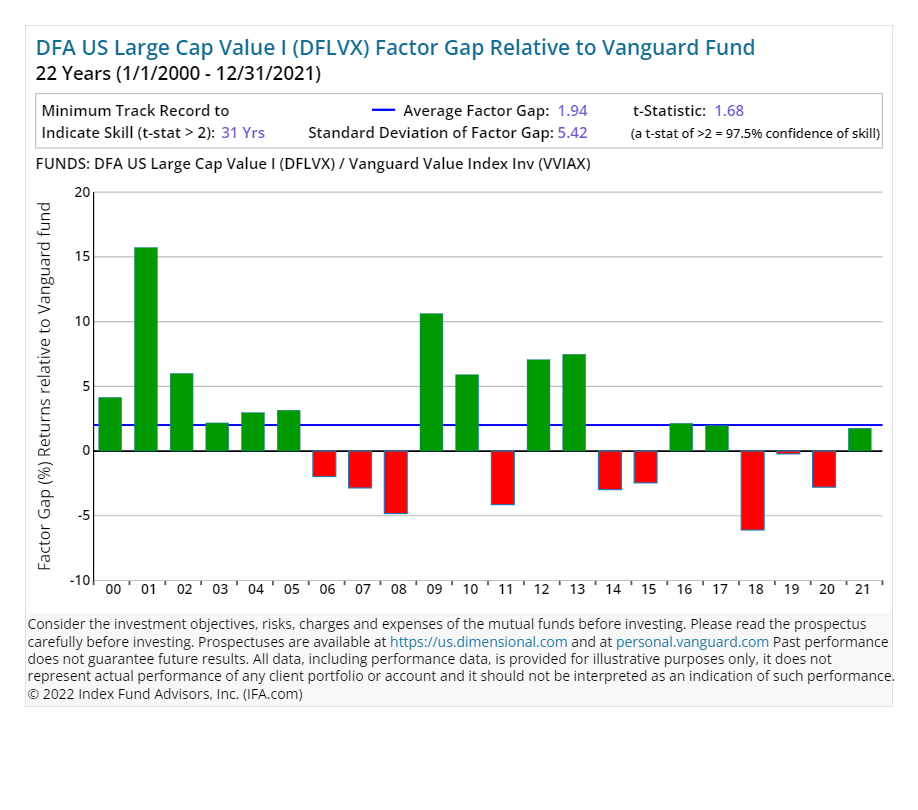
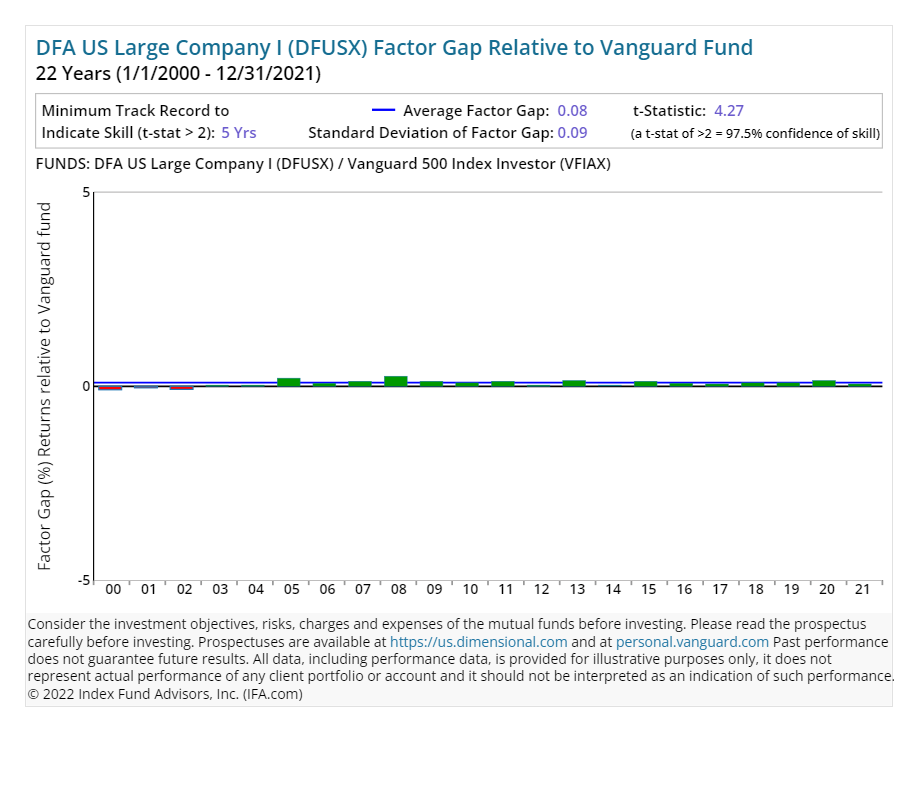
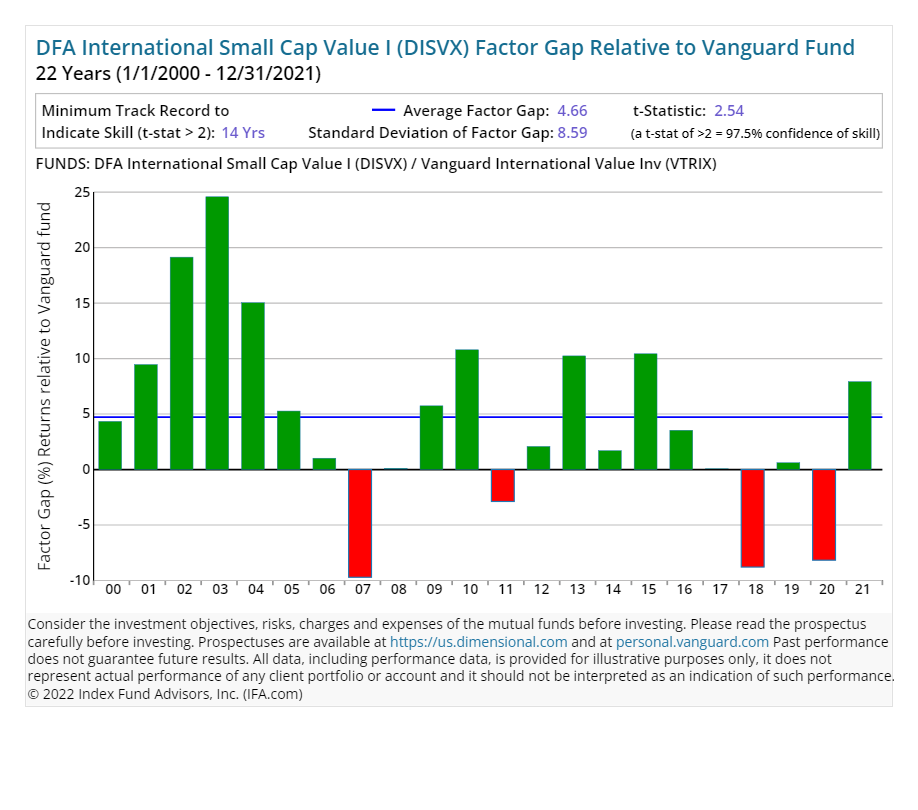
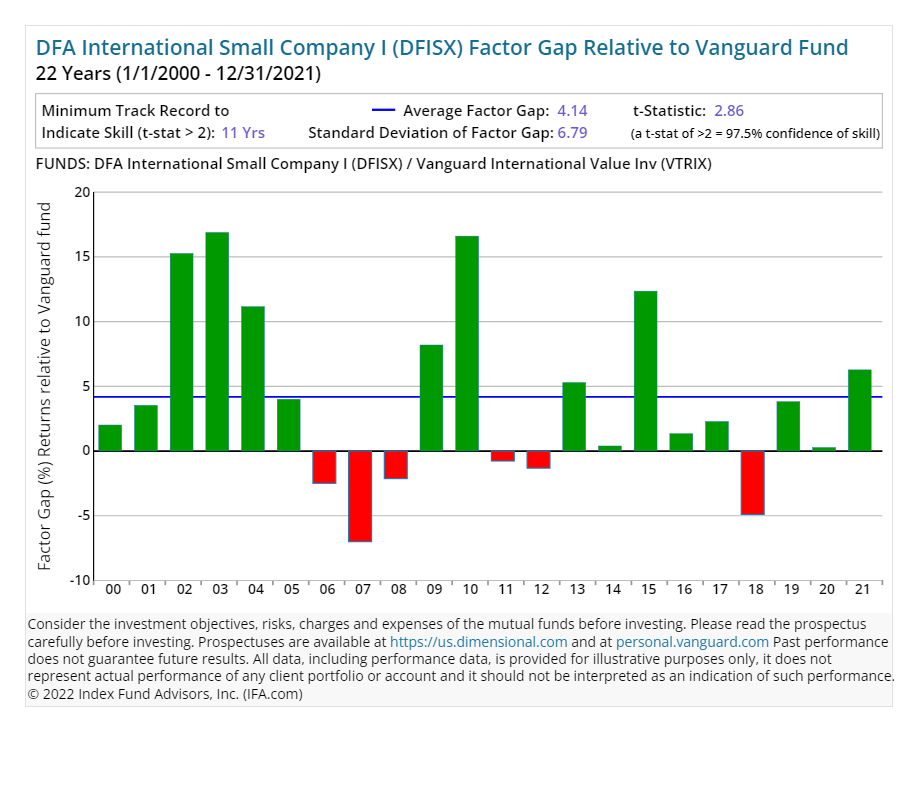
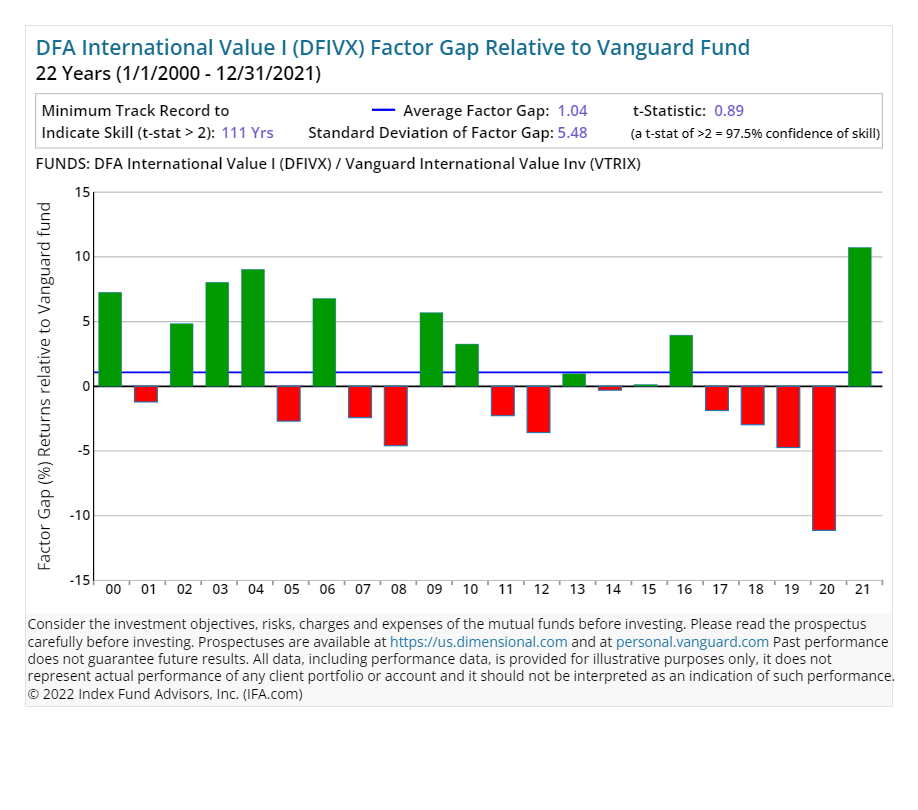
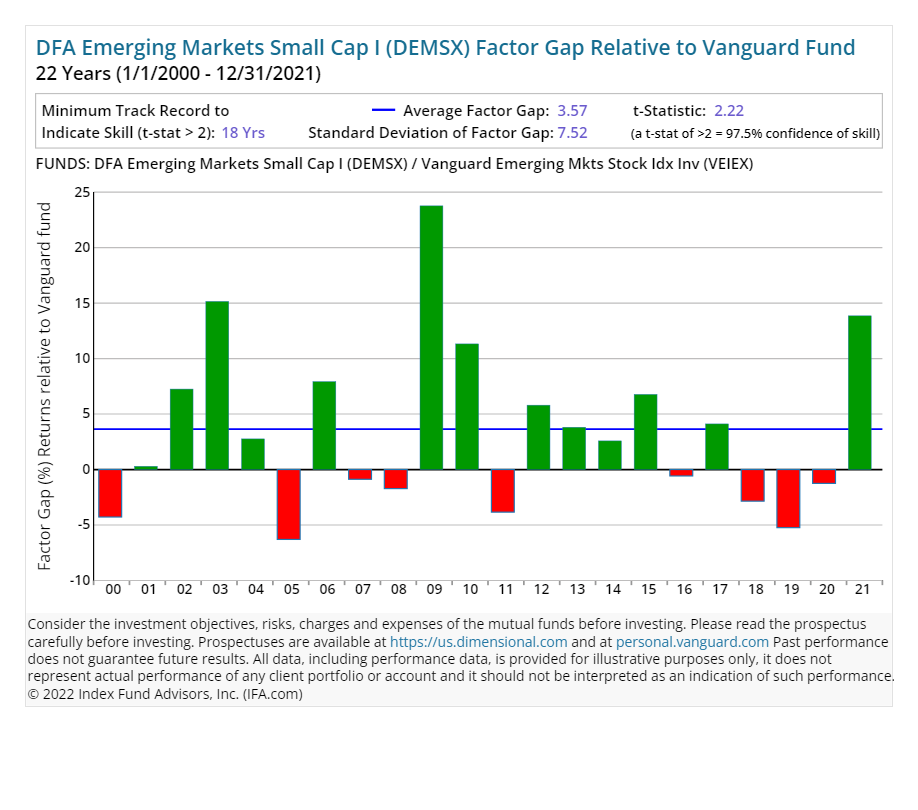
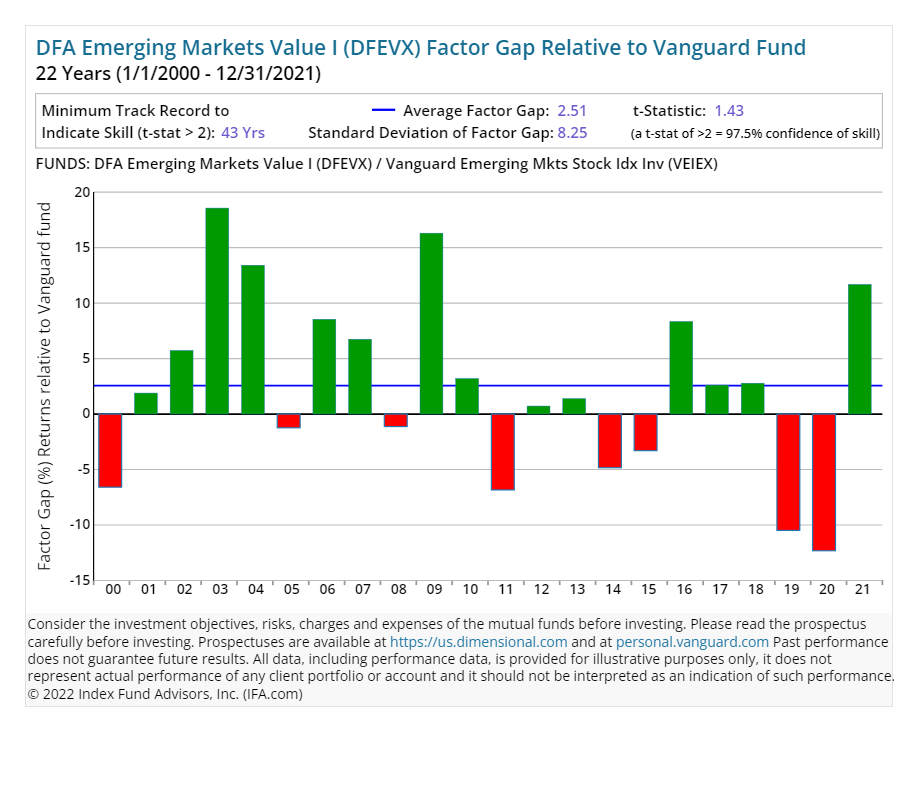
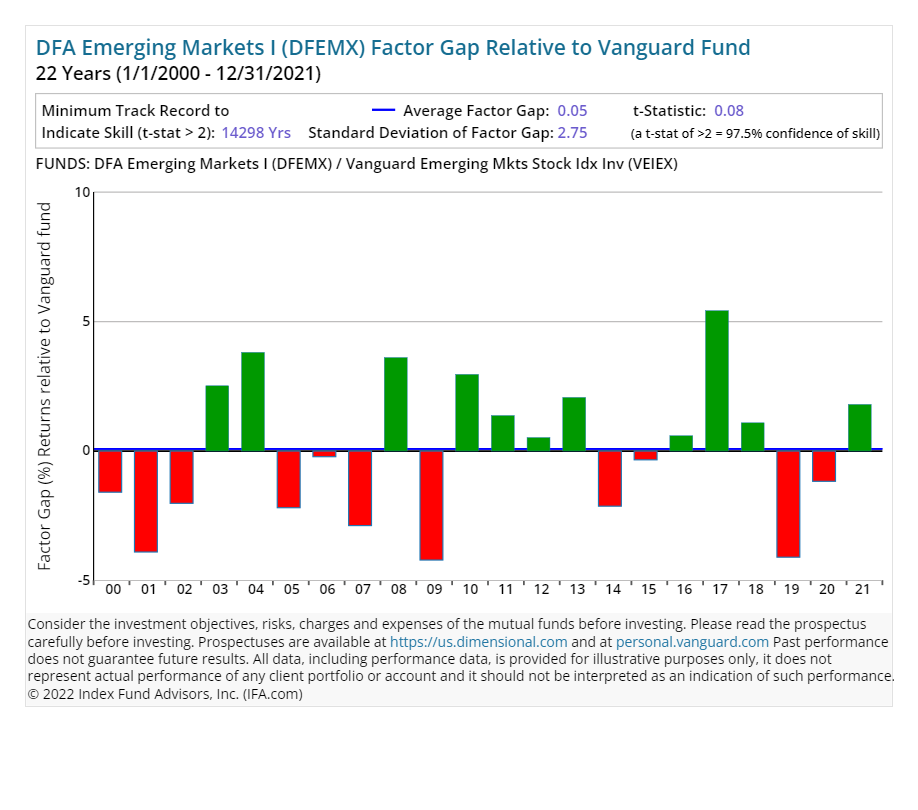
So, now let us look at the year-by-year Factor Gaps — i.e., the different exposures to the dimensions of returns — of DFA's funds recommended by IFA versus the closest Vanguard alternative passive fund, which we refer to as the "BENCHMARK" in the following charts.
The green bars illustrate years when Dimensional's factor tilts and implementation strategies had higher returns than the Vanguard alternative and the red bars illustrate when Vanguard Funds had higher returns with standard indexes. Generally speaking, Vanguard indexes have lower tilts to small and value factors. A t-stat of 2 or greater indicates statistical significance of the factor gap difference. For the calculation of t-stats and very long term factor premium charts, see this article.
As a fiduciary, it is IFA's responsibility to provide investment recommendations that align with each client's best interests. While Vanguard is widely recognized in the industry, our analysis has identified Dimensional's approach as offering stronger factor tilts, which historically have been associated with higher expected returns for the risks taken. It is important to note that expected returns are not guaranteed, and the selection of funds depends on individual client preferences, costs, and other considerations. Additionally, portions of this article rely on hypothetical or back-tested data, which is presented solely for illustrative purposes and may not reflect actual client portfolios or future results. Our research seeks to guide IFA clients in capturing risk premiums through disciplined and diversified strategies.
This is not to be construed as an offer, solicitation, recommendation, or endorsement of any particular security, product or service. There are no guarantee investment strategies will be successful. Investing involves risks, including possible loss of principal. IFA Index Portfolios are recommended based on an investor's risk capacity, which considers their time horizon, attitude towards risk, net worth, income, and investment knowledge. Take the IFA Risk Capacity Survey to determine which index portfolio matches your risk capacity. For detailed information on the hypothetical back-tested performance data shown in this article, including sources, updates and important disclosures, see https://www.ifabt.com Consider the investment objectives, risks, charges and expenses of the mutual funds carefully before investing. Please read the prospectus carefully before investing. IFA utilizes "standard deviation" as a quantification of risk, see the definition of "standard deviation" in the IFA Glossary.

