Active fund managers tout how much "alpha" they can deliver for investors. Besides representing a Greek letter, this terminology in finance represents how much "excess" return a fund makes relative to a comparative index.
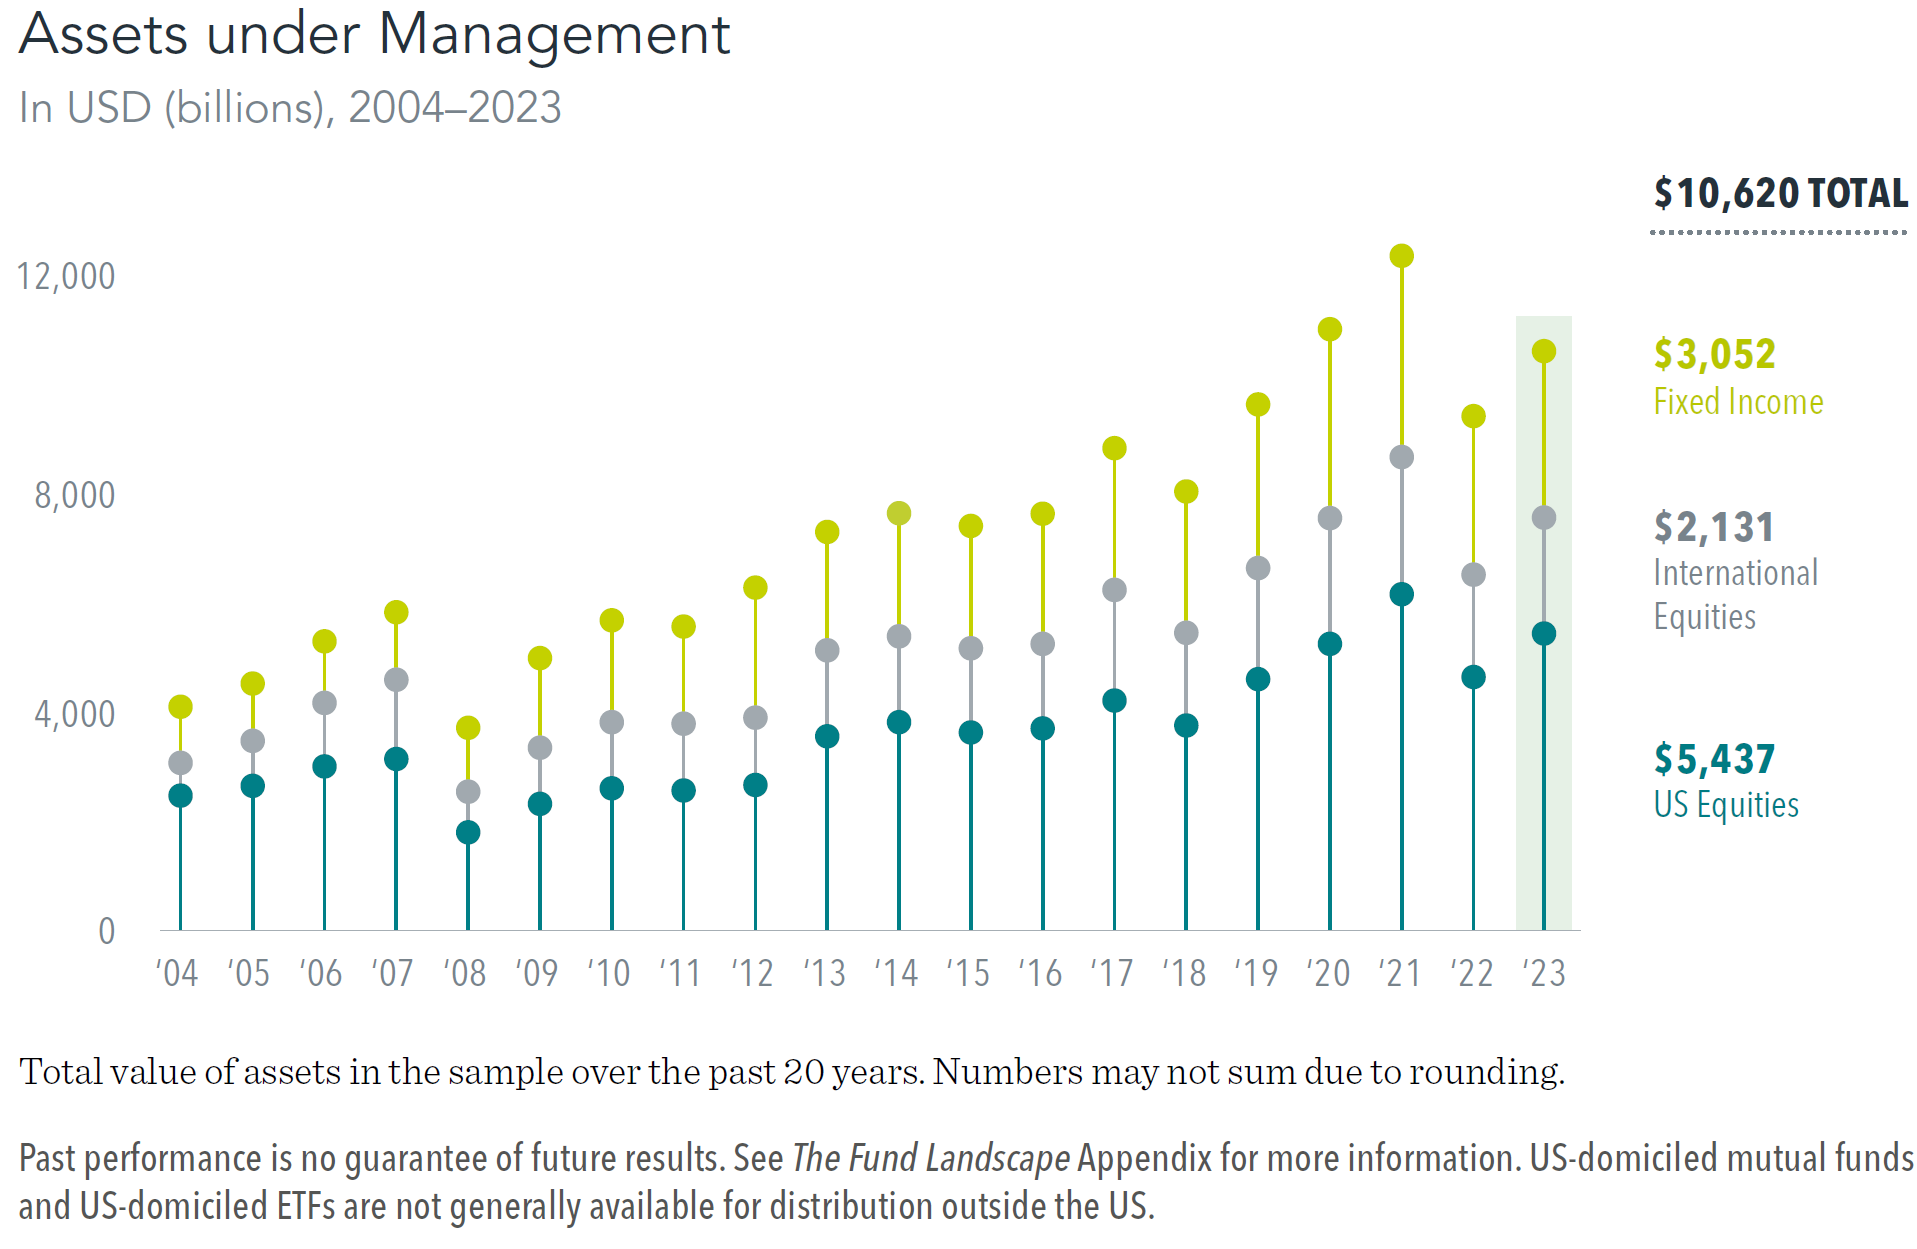
Industry parlance aside, alpha appears to be more myth than fact. At least that's the conclusion of a long-running research series undertaken by Dimensional Fund Advisors. In its latest update ("The Fund Landscape 2024"), DFA took a comprehensive deep dive into 4,722 U.S.-domiciled mutual funds and exchange-traded funds (ETFs). At the end of 2023, these represented a marketplace with $10.62 trillion in total assets under management. (See chart below.)
The Landscape report's conclusion was fairly stark: An overwhelming majority of fund managers failed to deliver index-beating returns after costs. And that proved to be the case both in shorter- and longer-periods reviewed over a 20-year span. The authors summarized that "results of this study suggest that investors are best served by relying on market prices." As they put it:
"The global financial markets process millions of trades worth hundreds of billions of dollars each day. These trades reflect the viewpoints of buyers and sellers who are investing their capital. Using these trades as inputs, the market functions as a powerful information-processing mechanism, aggregating vast amounts of dispersed information into prices and driving them toward fair value. Investors who attempt to outguess prices are pitting their knowledge against the collective wisdom of all market participants." 1
Given the size and scope of the U.S. funds market, active stock and bond jockeys often muddle performance data to skew it in their favor. This sort of shell game with return numbers is done by shuttering or merging underperforming funds into those with better records. Although such an occasional maneuver might be plausible from a logistics standpoint, the DFA Landscape research found that investors might be surprised "by how many funds disappear over time."
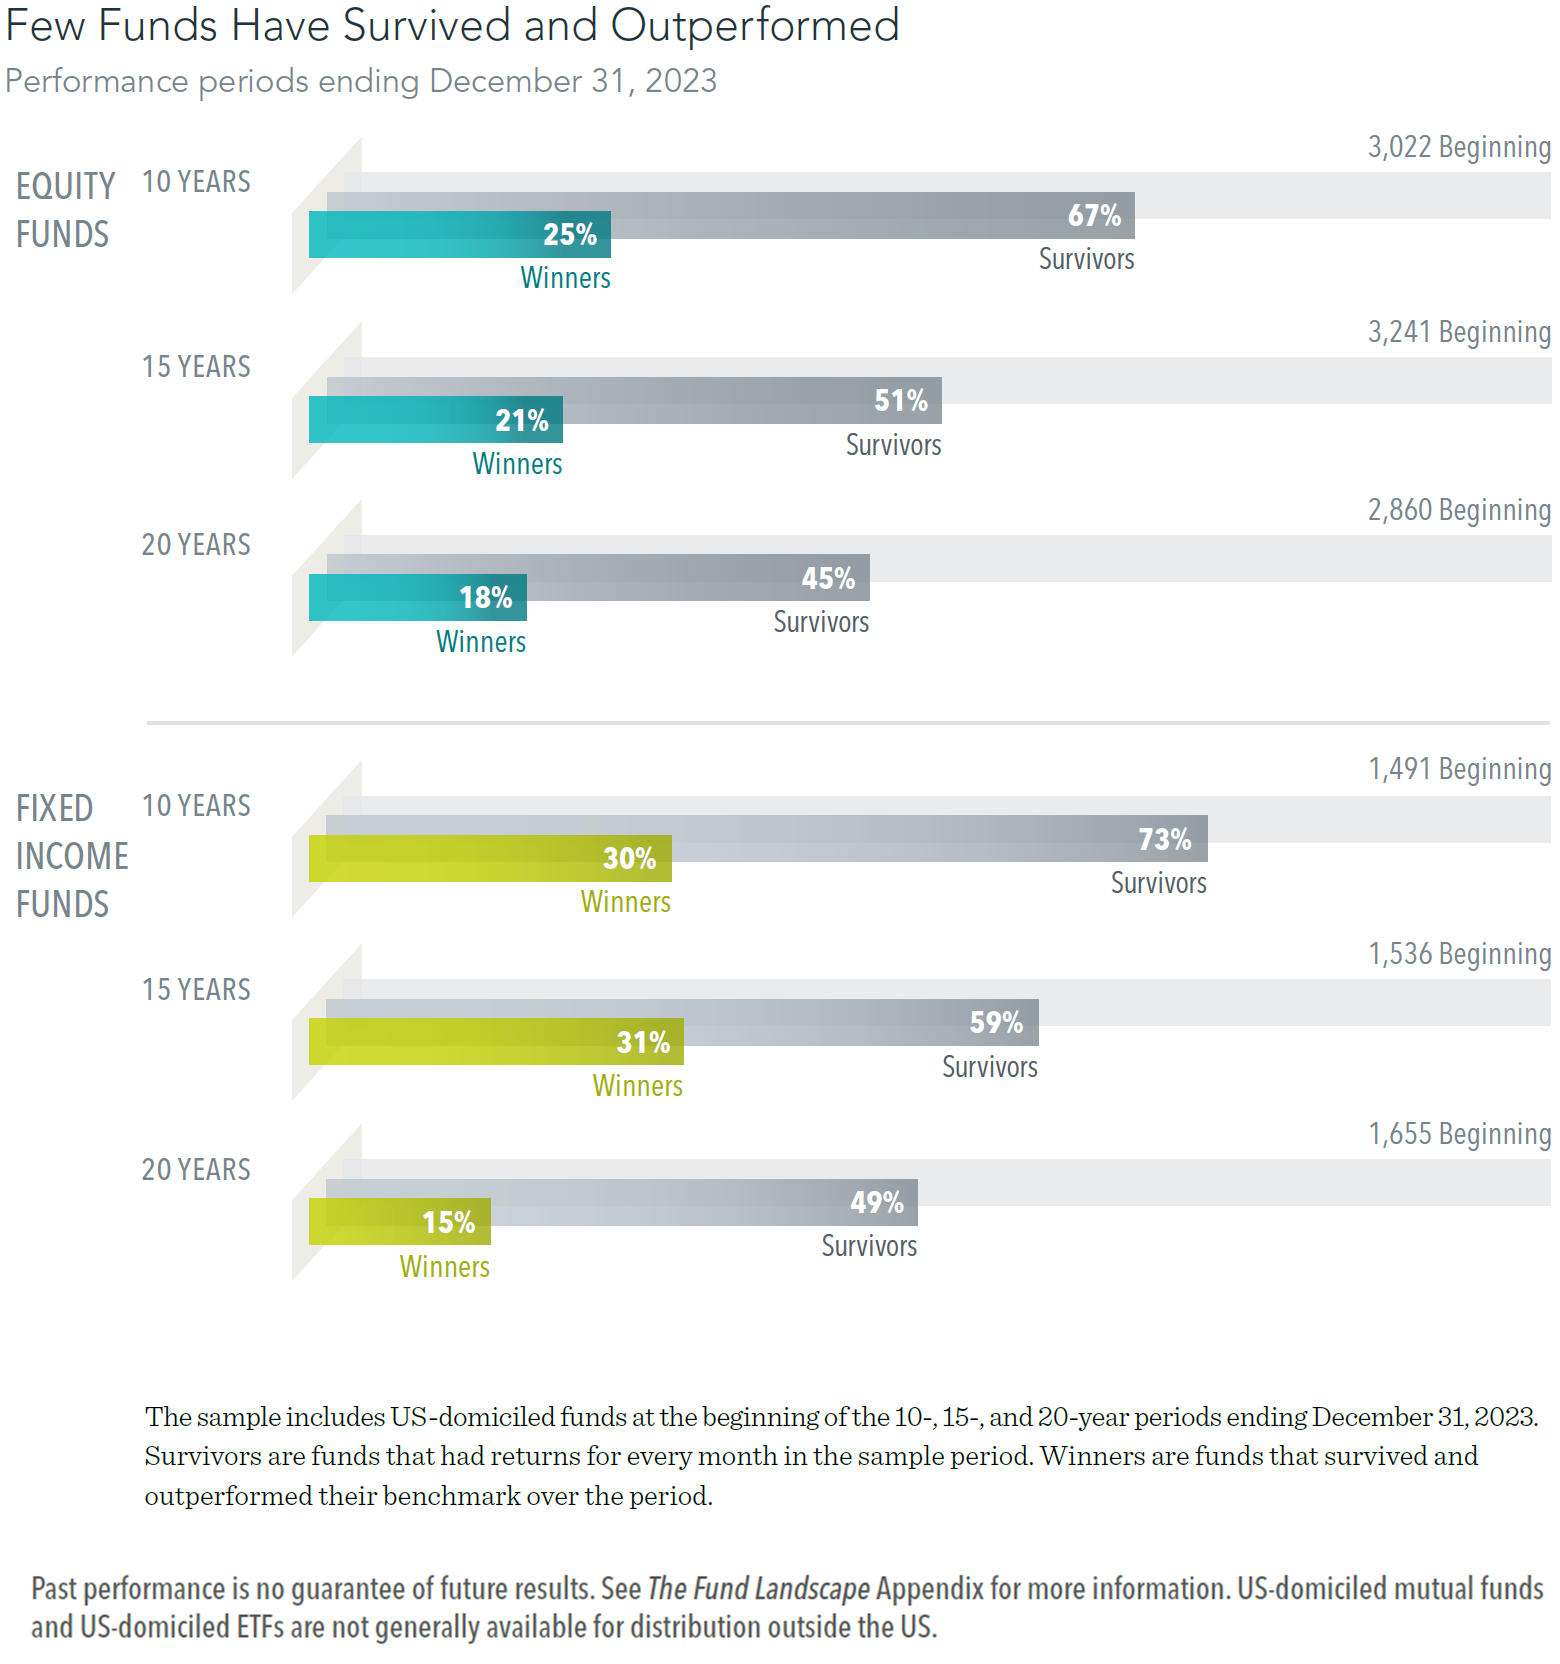
The report revealed that "at least half" of all equity and fixed-income funds starting in 2004 "were no longer available" to U.S. investors by the end of 2023. "The evidence suggests that only a low percentage of funds in the original sample were 'winners' — defined as those that both survived and outperformed benchmarks," noted DFA's Landscape researchers.
The graphic below depicts those results. Besides looking at the entire 20-year period, DFA's sample included U.S.-domiciled funds at the beginning of the 10- and 15-year timeframes (ended December 31, 2023). Survivors were funds that had returns for every month in the sample period. Winners were funds that survived and outperformed each fund's respective benchmark during each specific period.
Notice how relatively low survival and outperformance rates turned out over all periods. For the past 20 years (through 2023), just 18% of stock funds and 15% of fixed-income funds survived and outperformed each respective benchmark. Since active managers close and merge their offerings so frequently, scrubbing returns data for "survivorship bias" errors is critical for proper evaluation of a fund, DFA's researchers pointed out.
Choosing a fund based on past returns raises other red flags. Namely, even when data is calculated in a fairly consistent and accurate manner, "sometimes good track records happen by chance," DFA's researchers observed. The problem, though, is that even in those instances outperformance tends to be short-term in nature and "fails to repeat," according to the Landscape report.
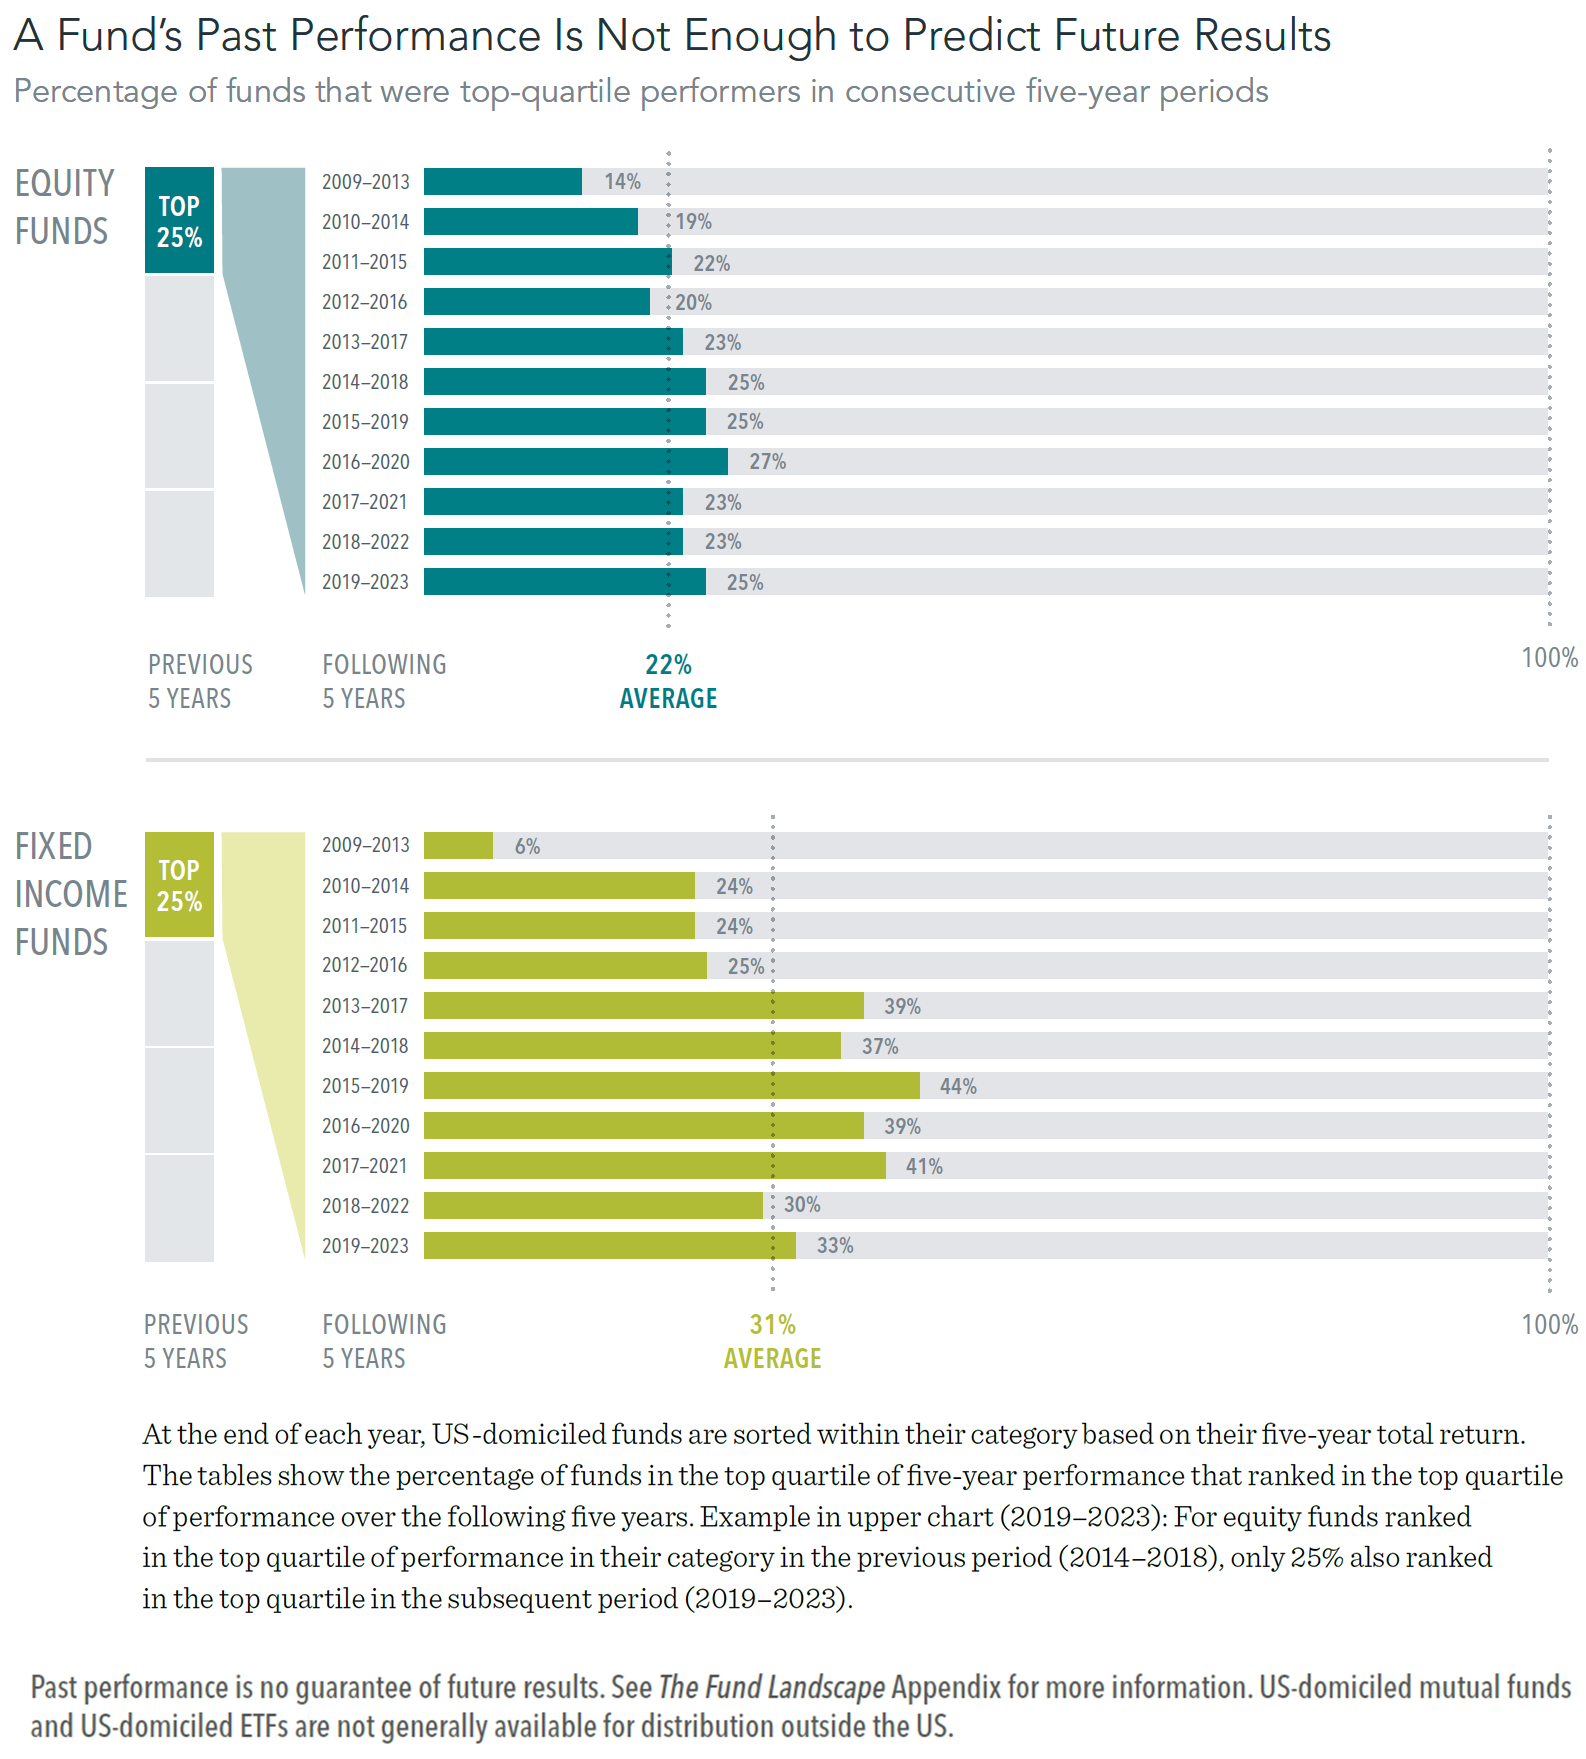
Researchers sorted data for all U.S.-domiciled mutual funds and ETFs within each respective category based on five-year total returns. At the end of each year, U.S.-based mutual funds and ETFs were sorted within each respective category (or asset class) based on five-year total returns. The tables below show the percentage of funds in the top quartile (25%) of five-year performance that ranked in the top quartile over the following five years.
For equity funds ranked in the top quartile of performance in each fund's respective category in the previous period of 2014-2018, for example, only 25% of those funds produced top-quartile gains in the subsequent five years (2019-2023). Notice, too, for all such five-year periods reviewed the average was 22% — in other words, 78% of 'winning' active fund managers in a single five-year period weren't able to sustain such outperformance over the succeeding five years. "The assumption that strong past performance will continue often proves faulty," the Landscape report noted, "leaving many investors disappointed."
Why do so many funds underperform? A major factor can stem from the active churning of portfolios. Such turnover in securities can "add substantially" to a fund's overall costs to investors, the Landscape report found. Specifically, it warned that equity trading costs alone "can be just as large as a fund's expense ratio."
This relates to active managers being prone to incurring a greater amount of brokerage fees and paying higher bid-ask spreads from their increased trading activities. The impact of more frequent trading can also raise "market impact" costs for investors — i.e., how much stock and bond prices are influenced by trading maturations of larger and more closely followed funds.
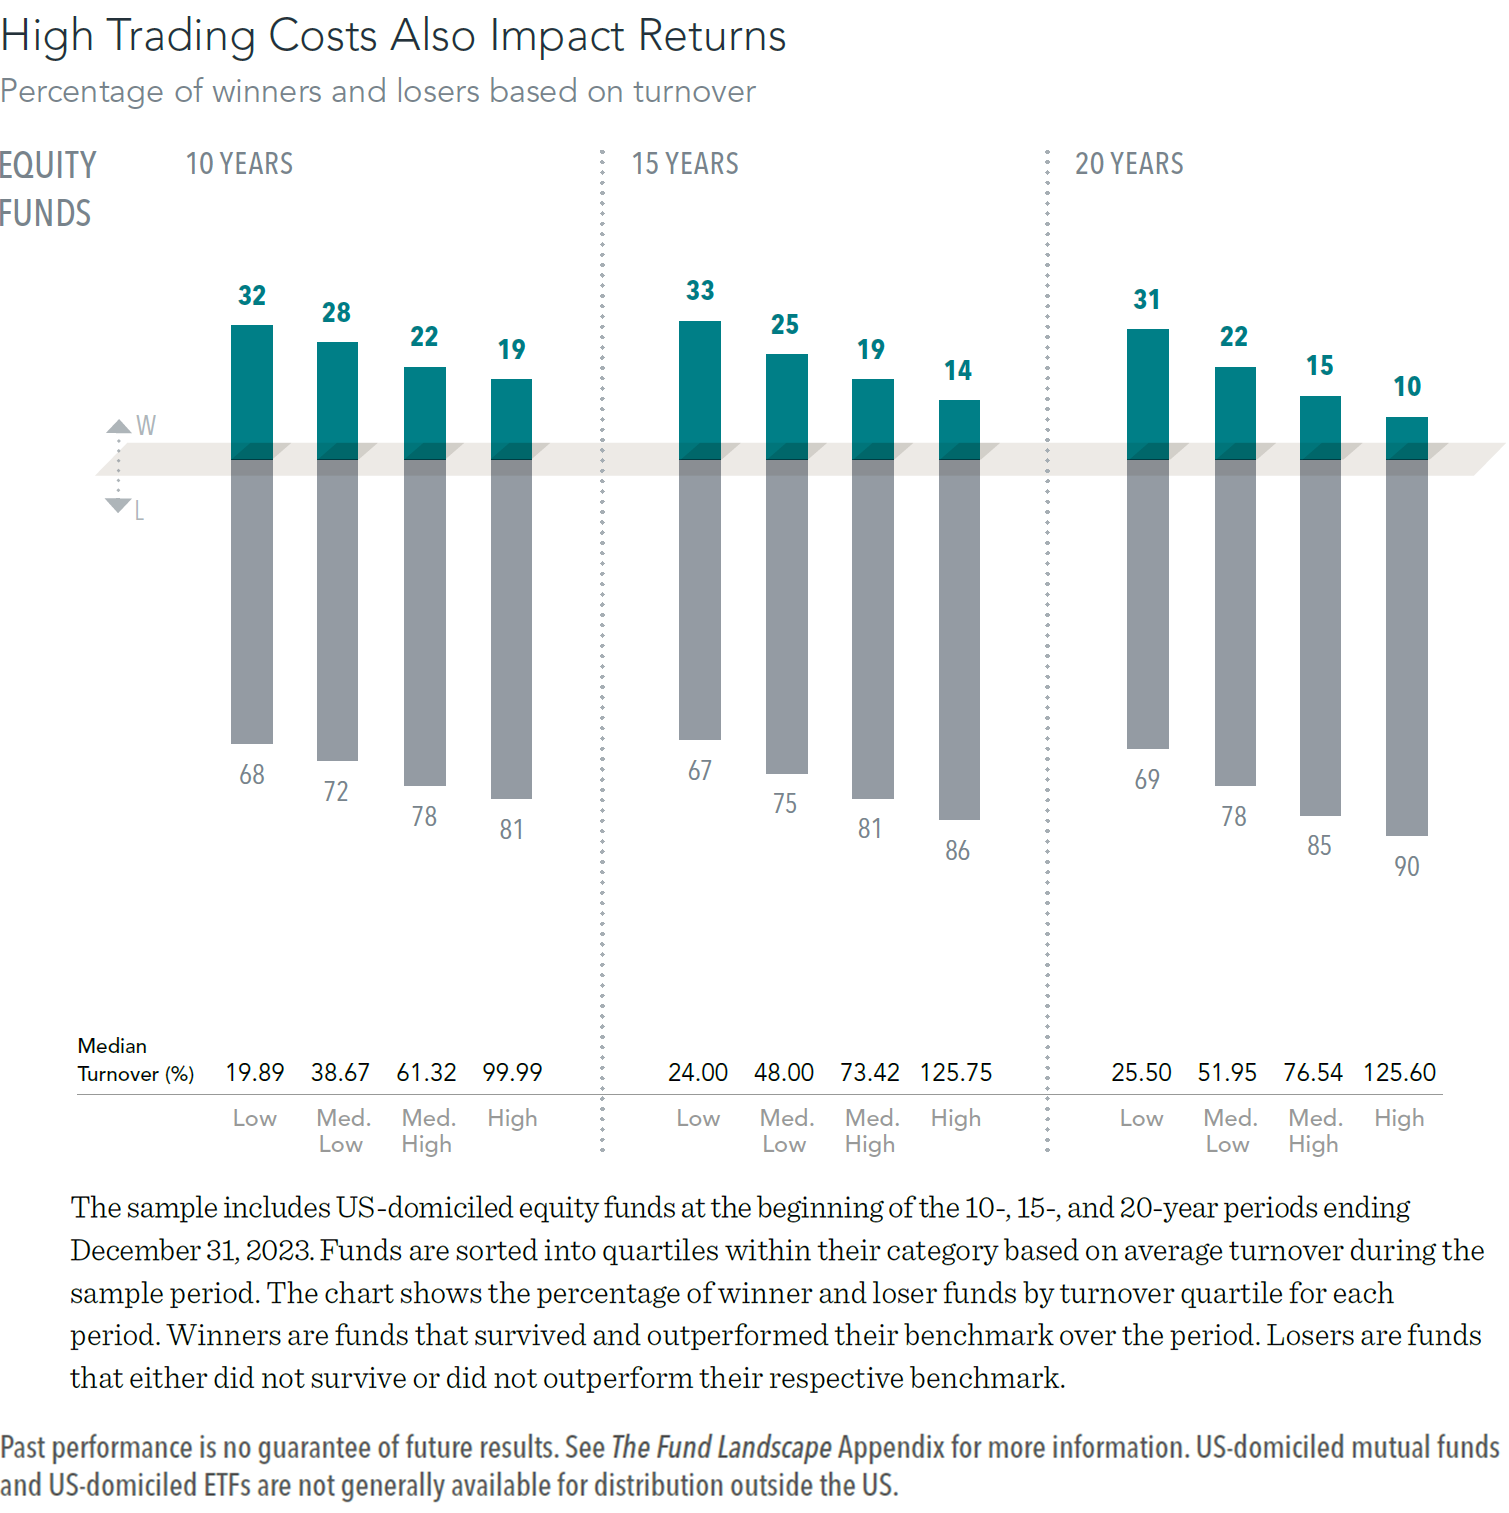
It's not surprising, then that DFA's researchers uncovered that "funds with higher turnover are more likely to underperform their benchmarks." The underlying issue, they added, was that high turnover "creates higher trading costs, which can detract from returns."
The chart below sampled U.S.-domiciled stock funds at the beginning of 10-, 15- and 20-year periods (through 2023). Funds were sorted into quartiles within each category based on average turnover during the period. The graphic shows the percentage of winner and loser funds by turnover quartile for each timeframe. Winners are representative of funds that survived and outperformed the respective benchmark during the period. Those that either didn't survive or lagged the respective benchmark were counted as losing funds.
The clear takeaway from the latest Landscape study: Investors are best served by relying on market prices. "Investment approaches based on a manager's efforts to outguess market prices have resulted in underperformance for the vast majority of funds," the report concluded. It added:
"We believe the research highlights an important investment principle: The capital markets do a good job of pricing securities, which intensifies a fund's challenge to beat its benchmark and other market participants. When fund managers charge high fees and trade frequently, they must overcome high cost barriers as they try to outperform the market."
As a result, we urge IFA's clients to take advantage of our complimentary offer to create an individually tailored investment plan. Also, a necessary first step in our asset allocation process is to take IFA's Risk Capacity Survey. It's designed to methodically assess how much risk a person really needs to be exposed to in order to meet his or her long-term financial goals.
Footnote:
1.) Dimensional Fund Advisors, "The Fund Landscape 2024: A Study of US-Domiciled Mutual Fund and Exchange-Traded Fund Performance," April 3, 2024.
The exhibits on this page were republished here with permission of Dimensional Fund Advisors LP. No further republication or redistribution is permitted without the consent of Dimensional Fund Advisors LP.
This is not to be construed as an offer, solicitation, recommendation, or endorsement of any particular security, product or service. There is no guarantee investment strategies will be successful. Investing involves risks, including possible loss of principal. Performance may contain both live and back-tested data. Data is provided for illustrative purposes only, it does not represent actual performance of any client portfolio or account and it should not be interpreted as an indication of such performance. IFA Index Portfolios are recommended based on time horizon and risk tolerance. Take the IFA Risk Capacity Survey (www.ifa.com/survey) to determine which portfolio captures the right mix of stock and bond funds best suited to you. For more information about Index Fund Advisors, Inc, please review our brochure at https://www.adviserinfo.sec.gov/ or visit www.ifa.com.

