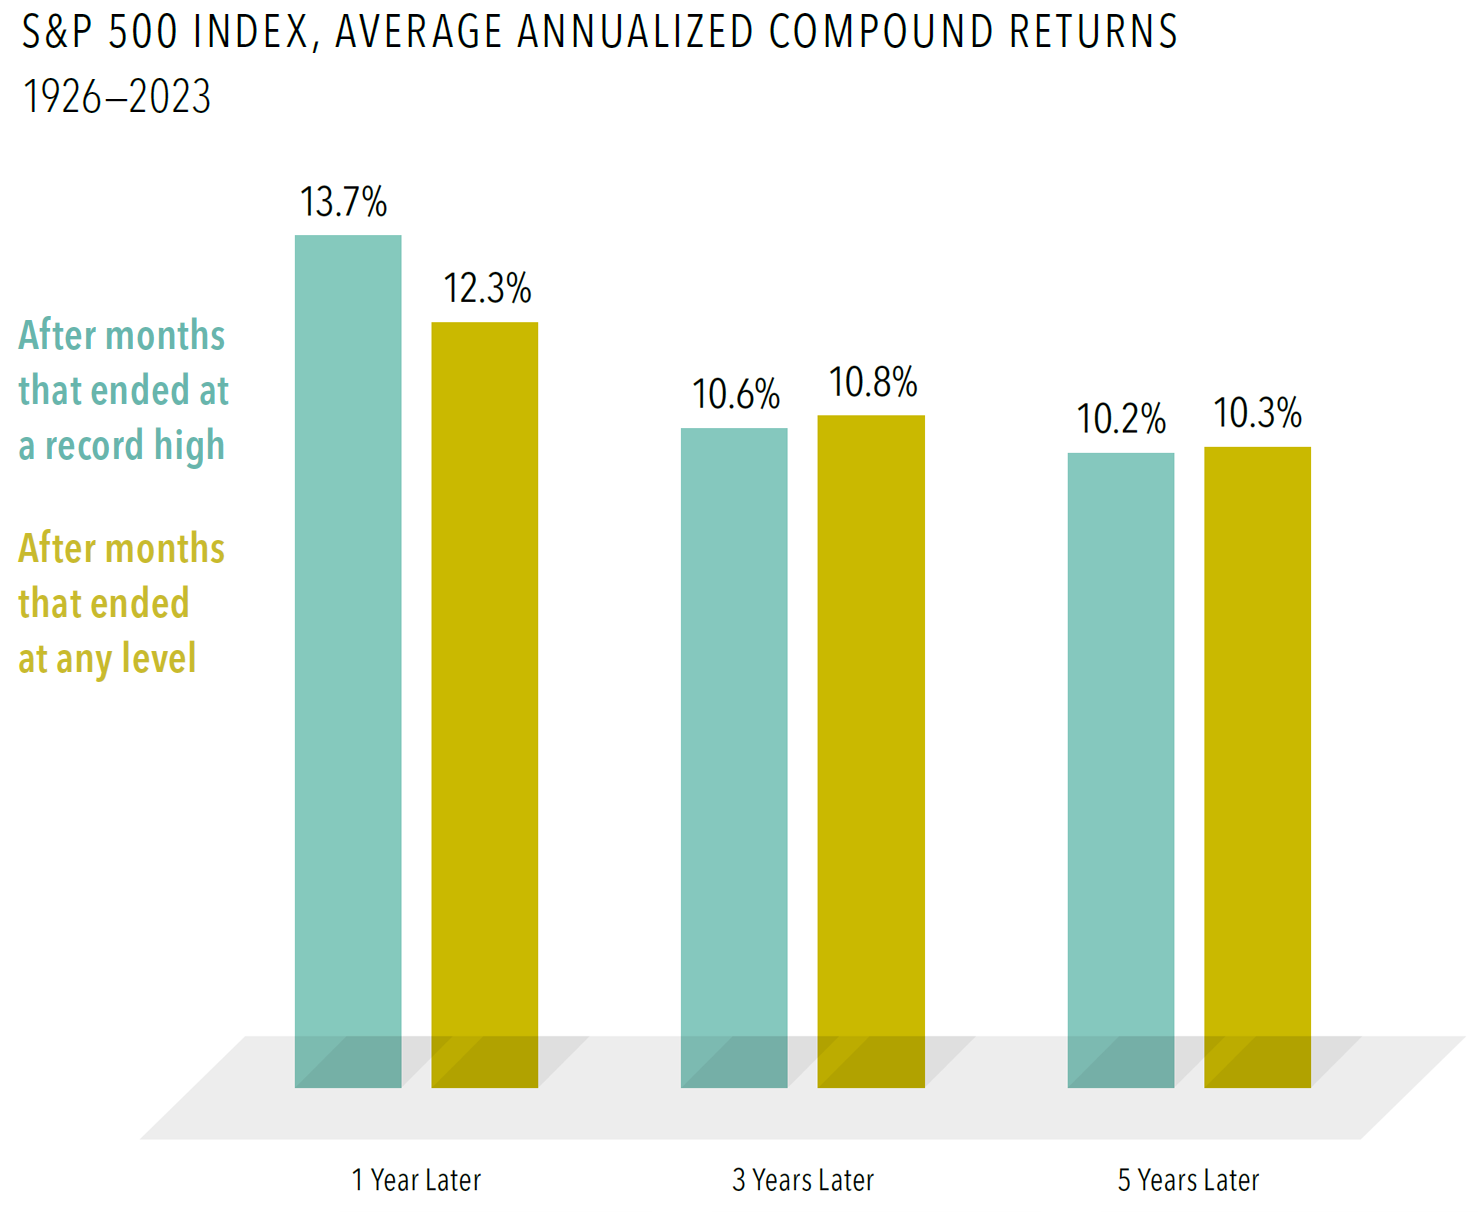
Many investors may think a market high is a signal stocks are overvalued. However, they may be surprised to find that the average returns one, three, and five years after a new month-end market high are similar to those after months that ended at any level.

  • In looking at all monthly closing levels between 1926 and 2023 for the S&P 500 index; 31% of them were new highs.
  • After those highs, the annualized returns ranged from almost 14% one year later to more than 10% over the next five years, which were close to average returns over any period of the same length.

Stocks are priced to deliver a positive expected return for investors, so reaching record highs regularly is the outcome one would expect.


Past performance is no guarantee of future results. Indices are not available for direct investment. Their performance does not reflect the expenses associated with the management of an actual portfolio.

In US dollars. For illustrative purposes only. New market highs are defined as months ending with the market above all previous levels for the sample period. Annualized compound returns are computed for the relevant time periods subsequent to new market highs and averaged across all new market highs observations. There were 1,175 observation months in the sample. January 1926–December 1989: S&P 500 index, Stocks, Bonds, Bills and Inflation Yearbook™, Ibbotson Associates, Chicago. January 1990–present: S&P 500 index (total return), S&P data © 2024 S&P Dow Jones Indices LLC, a division of S&P Global. All rights reserved.

This article originally appeared February 21, 2024. It is republished here with permission of Dimensional Fund Advisors LP. No further republication or redistribution is permitted without the consent of Dimensional Fund Advisors LP.


Dimensional Fund Advisors LP is an investment advisor registered with the Securities and Exchange Commission.
Investment products: • Not FDIC Insured • Not Bank Guaranteed • May Lose Value
Dimensional Fund Advisors does not have any bank affiliates.


This information is provided for registered investment advisors and institutional investors and is not intended for public use. Dimensional Fund Advisors LP is an investment advisor registered with the Securities and Exchange Commission. Consider the investment objectives, risks, and charges and expenses of the Dimensional funds carefully before investing. For this and other information about the Dimensional funds, please read the prospectus carefully before investing. Prospectuses are available by calling Dimensional Fund Advisors collect at (512) 306-7400 or at dimensional.com. Dimensional funds are distributed by DFA Securities LLC.

About Index Fund Advisors

Index Fund Advisors, Inc. (IFA) is a fee-only advisory and wealth management firm that provides risk-appropriate, returns-optimized, globally-diversified and tax-managed investment strategies with a fiduciary standard of care.

Founded in 1999, IFA is a Registered Investment Adviser with the U.S. Securities and Exchange Commission that provides investment advice to individuals, trusts, corporations, non-profits, and public and private institutions. Based in Irvine, California, IFA manages individual and institutional accounts, including IRA, 401(k), 403(b), profit sharing, pensions, endowments and all other investment accounts. IFA also facilitates IRA rollovers from 401(k)s and 403(b)s.

Learn more about the value of IFA, or Become a Client. To determine your risk capacity, take the Risk Capacity Survey.

SEC registration does not constitute an endorsement of the firm by the Commission nor does it indicate that the adviser has attained a particular level of skill or ability.

About the Author

DimensionalFund Advisors

Dimensional Fund Advisors

Dimensional is a global investment manager dedicated to implementing the great ideas in finance. Founded in 1981, Dimensional Fund Advisors has a long history of applying academic research to practical investing. Headquartered in Austin, Texas, Dimensional Fund Advisors has offices internationally in Canada, Australia, Japan, and Hong Kong.

IFA's

— Risk Capacity —

Survey

Please estimate when you will need to withdraw 20% of your current portfolio value, such as a need for a house down payment or some other major financial need.

  • Less than 2 years
  • From 2 to 5 years
  • From 5 to 10 years
  • From 15 to 20 years
  • More than 15 years

Find a portfolio that matches your Risk Capacity


Learn IconLearn About an Evidence-Based Approach to Investing

Index Funds: The 12-Step Recovery Program for Active Investors
Amazon

Audiobook Kindle Paperback Hardcover

Investing in U.S. Financial History: Understanding the Past to Forecast the Future
Amazon

Audiobook Kindle Hardcover

Galton Board Stock Market Edition
Galton Board
Amazon
Mac App Download
Android Download