Any discussion about how markets set prices essentially starts and ends with a fundamental understanding – markets are efficient.
According to 2013 Nobel Laureate and University of Chicago Professor Eugene Fama, this means that at any point in time "prices reflect all available information so that ... it is basically impossible to beat the market ... because investors are always paying fair prices. So the task of investors is simplified -- they just have to decide how much risk they want to take to get more or less expected return. Investors don't need to worry about picking stocks or timing the market because they can operate under a presumption that stocks will be fairly priced."
Fama also has noted (see video below) that "my expected value (expected return) is always the historical return."
So, investors could presume that if they had a history of 600 monthly returns (50 years worth) of a backtested globally diversified portfolio of indexes -- and the average gain was 1.0% per month -- today's fair prices are continuing to reflect all available information so that the expected monthly return remains at about 1% per month.
(Please note that professor Fama was referring to expected return, not realized return, and there has been a wide range of realized returns relative to the expected return.)
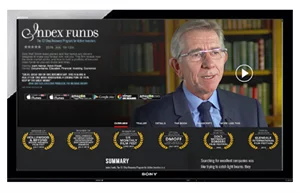
We urge you to carefully watch the video below where Eugene Fama, Rex Sinquefield, and Kenneth French discuss some very important lessons for investors. These include market efficiency, expected returns and how markets price assets. Professor French discusses how the risk characteristics of companies drive their stock returns, not the news about those companies. This is because the news is rapidly incorporated into the price, positioning the expected return back to the level of return that is appropriate given that firm's level of risk.
The Nobel Prize-winning ideas in the video explain how free markets work to obtain fair prices for buyers and sellers. A well-functioning market reduces the chance that active investors will end up with returns higher than expected, given the risk characteristics embedded in their portfolios. As a result, market-beating returns otherwise known as abnormal returns would instead be due to insider-trading, misrepresentation, or just plain luck. Since luck doesn't persist, and orange jumpsuits are not the preferred attire for investors, we don't recommend that investors engage in any form of active investing.
Once we understand that market prices incorporate all available information into the price, we can extrapolate that fair prices have the objective of providing a risk-appropriate fair return for investors.
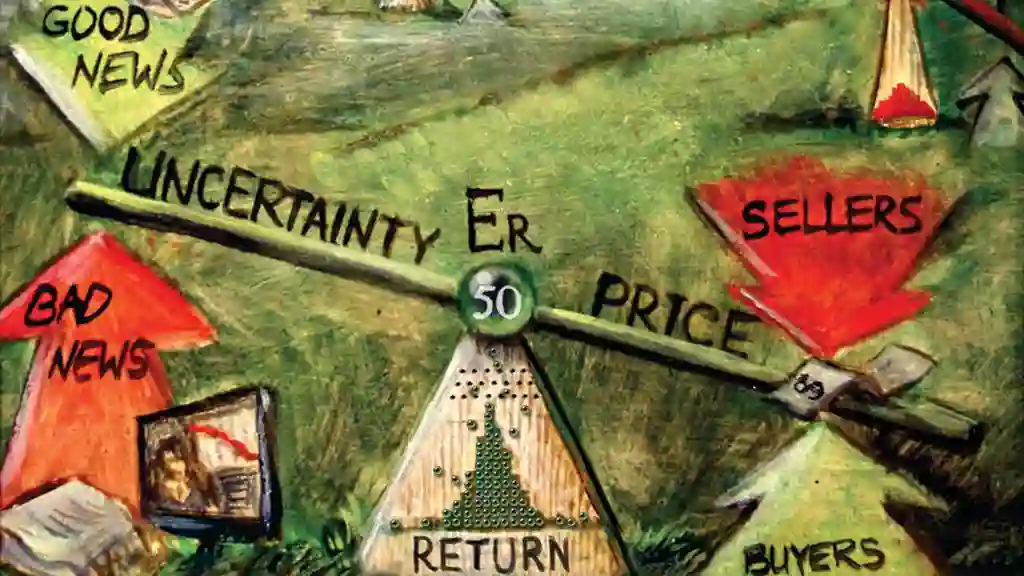
The Hebner Model provides a framework for investor expectations by breaking down the free-market forces impacting investments into three simple variables: uncertainty, return and price. The model illustrates that fair prices are continually changing inversely proportional to the uncertainty of realizing the expected return of an investment in the future.
Investors would be well advised to assume that the expected return for a consistent level of investment risk remains essentially constant over time. They also need to understand that investment risk requires that there are surprises and sometimes significant differences between the expected return and realized returns. In fact, realized returns look something like a bell curve, with the center of the curve being the expected return when sample sizes are very large.
The distribution of large samples of 600 or more simulated and backtested monthly returns of index portfolios has been very close to a normal distribution. When samples of returns are large enough, investors can assume that future large samples of monthly returns should approximate the normal distribution, where returns are expected to be denser in the center and less dense in the tails. Also, extremely high and low returns, meaning those returns beyond three standard deviations from the average are expected to be slightly more than estimated by the normal distribution. They are also equally likely to be positive or negative and equally unlikely to occur.
To be more specific, in a globally diversified and small value tilted equity portfolio, we have seen about 1% of the historical monthly returns (7 out of 600) occurring beyond three standard deviations from the average on the combined positive and negative sides of the average. Based on a standard normal distribution, we would have expected about 0.3% (2 out of 600) and one in each tail of the curve. In the chart below, you can see a dynamic chart of monthly rolling 600-month return periods for many different index portfolios and an overlay of the normal distribution and the standard deviation lines. Select different allocations of stock and bond indexes by clicking on the numbered buttons, where the number indications the allocation to stock indexes. You can also change the sample size and data period in the bottom left corner.
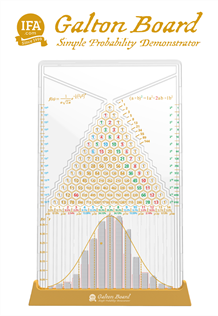
Here is an illustration of the normal distribution.
Since prices discovered in high-volume and free-market security exchanges result in fair prices, investors would also be well-advised to assume that the only way to increase the expected return of a globally diversified investment, such as an index portfolio, would be to increase the exposure to academically tested and accepted risk factors embedded in that index portfolio. These risk factors are often referred to as the dimensions of expected returns. Shown below are the dimensions that explain the vast majority of equity returns. Several asset pricing models are applied to arrive at the dimensions of expected returns and those models assume the efficient market hypothesis (prices are fair) to be an accurate explanation of how markets work.
The Hebner Model assumes the exposure to these dimensions of returns and their expected returns are held substantially constant over time. It also assumes that the percentage change in the price equals the inverse of the percentage change in the uncertainty of that expected return. For example, if the fair price -- set by willing sellers agreeing with willing buyers in a free market -- fell 2%, investors can assume that the uncertainty of the expected return went up 2%, guided by news and information that would have an impact on the uncertainty of the expected return.
Alternatively, if the price increased by 3.75%, investors can assume that uncertainty fell by 3.75%, thereby allowing an investor's assumptions of the expected return at the time of buying the investment to remain essentially constant, regardless of the news in the world or the previous sequence of returns.
To visualize how markets work, imagine an essentially constant risk-appropriate monthly expected return for a given investment portfolio set at the fulcrum of a teeter-totter. The intersection of good and bad news results in a level of uncertainty on one side and the price that millions of buyers and sellers agree to is on the other side. The price moves inversely proportional to the uncertainty so that the expected return is held essentially constant. See a dynamic illustration of the Hebner Model below.
This is free-market capitalism and the power of the markets at work, where the cost of capital for shareholders of the firm equals the expected return for providers of the capital.
In summary, the Hebner Model provides a simplified framework to gain a better understanding of how markets work. It also illustrates the fundamental reasons for being a passive investor and avoiding all forms of active investing.
This is not to be construed as an offer, solicitation, recommendation, or endorsement of any particular security, product or service. There is no guarantee investment strategies will be successful. Investing involves risks, including possible loss of principal. Performance may contain both live and back-tested data. Data is provided for illustrative purposes only, it does not represent actual performance of any client portfolio or account and it should not be interpreted as an indication of such performance. IFA Index Portfolios are recommended based on time horizon and risk tolerance. Take the IFA Risk Capacity Survey (www.ifa.com/survey) to determine which portfolio captures the right mix of stock and bond funds best suited to you. For more information about Index Fund Advisors, Inc, please review our brochure at https://www.adviserinfo.sec.gov/ or visit www.ifa.com.


