"Reversion to the mean," Jack Bogle once said, "is the iron rule of financial markets."
And if you understand nothing else about how investing works, grasping this one simple concept will give you a better chance of succeeding at it than supposedly more sophisticated investors.
In the investing sense, mean reversion is the theory that, however high or low they seem to be at any one point in time, the returns delivered by financial securities will eventually gravitate back towards the very long term historical mean.
Some people try to use mean reversion to outperform the market. For example, they will move money out of asset classes that have produced strong short term returns and into those that have been performing poorly over the short term. But studies have shown little or no evidence that a trading strategy built on short term mean reversion will outperform a simple buy-and-hold strategy. Why? Because although returns do, generally, revert to the mean over the long term, working out exactly when, and how quickly, they're going to do so is all but impossible to predict with any degree of accuracy or consistency.
So, as an investor, how do you make mean reversion work for you and not against you? First, you should invest for a very long time; secondly, you should diversify across different assets, sectors and regions; and thirdly, if only to limit the temptation to bail out when stock markets inevitably fall, you should periodically rebalance your portfolio to restore your original asset allocation.
For the afore-mentioned Jack Bogle, there is another important aspect to mean reversion, and it concerns active fund performance. Active funds can and do outperform the market for several years; indeed, there are so many funds to choose from that there are bound to be winners at any one time, and those are precisely the funds that tend to be advertised and to be written about it in the media. But, as academic research, and the on-going SPIVA analysis, tells us, consistent, long-term outperformance is extremely rare. Sooner or later, a winning fund will become a losing fund, and the cruel twist for investors is that mean reversion often begins to happen just as they start piling in.
Choosing to avoid active funds altogether, therefore, and instead simply capturing market returns using low-cost index funds is a fourth way of keeping mean reversion on your side.
So how was the concept of mean reversion first developed? In fact, it was first observed in the 1870s by the Victorian statistician, Francis Galton, who, as far as we know, had little or no interest in investing. What fascinated Galton was heredity, and the extent to which hereditary traits are passed from parents to their children.
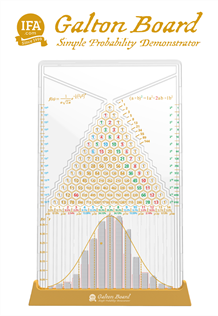
To illustrate reversion, or regression to the mean, Galton developed a bean machine, sometimes known as a quincunx. The machine consisted of a vertical board with interleaved rows of pins. Beads were dropped from the top and bounced either left or right as they hit the pins. Eventually, they collected into bins at the bottom, and the height of stacked beads accumulated in the bins eventually approximated a bell curve.
The idea was that every time a ball hit a pin, it had a 50:50 chance of bouncing left or right. Very rarely a ball would go left every time and end up in the bin furthest to the left; and occasionally a ball would go right every time and end up in the furthest bin on the right. Most of the beads, however, would end up somewhere in the middle — accumulating around the average and forming the shape of the bell curve.
The Galton Board is a way of visualizing the returns you can expect from financial markets. Markets are competitive; in other words, there are two sides to every trade. They're also broadly efficient, meaning that they reflect all known information. On any one day, the odds of stock returns being above the average or below the average are 50:50, just like the beads hitting the pegs. But, over the long term, as market history shows us, stock returns have been positive. So, you're bound to have a bad week, month or year from time to time and, occasionally, a particular asset class will languish in the doldrums for extended periods. But over periods of 10 years or more investors should expect positive returns from investing in globally diversified portfolios of low cost index funds.
I have a replica of the Random Walker on my desk. Every time — yes, every time — the balls are released, they end up in the shape of a bell-curve at the bottom. From an investment point of view, that's actually very reassuring. As long as you invest for very long term, diversify, rebalance and stay the course, while keeping costs low throughout, your chances of achieving a decent net return are really very good indeed.
Watch this, the third and final video of our series, Francis Galton, Flawed Genius, for more information on mean reversion, and for a demonstration of the original Galton Board in action:
If you missed the first two videos in the series you can watch them here:
Francis Galton: Whenever You Can, Count (Video 1/3)
Francis Galton: The Wisdom of the Crowds (Video 2/3)
Video Transcript:
One of the most important concepts for investors to understand is reversion to the mean.
It's a phenomenon that's also widely used in statistics.. and it was first observed by Francis Galton in the early 1870s.
And this is the machine he designed himself to illustrate it. It's variously called the Galton Board, probability machine or quincunx.
Subhadra Das, curator of the Galton Laboratory at University College London says: "It has got his hand-writing on it. And his hand-writing is a set of handy instructions on how to use the device. You have to turn it topsy-turvy, as he said. As I let it go, all the little ball bearings feed through the funnel, and they're channeled through the quicken pattern of nails. And there at the bottom, every time you do it, you get the normal distribution of the bell-shaped curve."
So, why the bell-shaped curve? Well, it's all to do with what mathematicians call binomial distribution.
Subhadra Das says: "For every single one of the balls, whenever it hits one of the pins, it's got a 50-50 chance of going one way or the other. And what the device demonstrates is that the odds of one of the balls hitting the pins and constantly going to the right are considerably less than the odds of it travelling into the middle. Why Galton was interested in this was because he wanted to understand about the laws of heredity and how traits are passed from parents to their children. This bell-shaped curve became rather iconic when a Belgian statistician called Adolphe Quetelet observed that if you measured for a particular trait within a population, you always got the bell-shaped curve."
Investment author Mark Hebner believes Galton's machine is an excellent way of illustrating stock market returns — so much so that that he commissioned a large replica, which takes pride of place in the office of his firm, Index Fund Advisors, in Irvine, California.
Hebner says: "So, one of the results that's really interesting is that, going forward, you should anticipate about half of those returns being greater than the average expected return, and half being less than those returns. And the further your returns end up being from the average, the less likely it is to occur."
The probability machine in Mark Hebner's office is eight feet tall, so, to help spread the message for and wide, he's produced a desktop version. And here it is. It's called the Random Walker.
Investors are constantly surrounded by noise — people are telling us to buying this or sell that. Well, this machine teaches us humility. In the short term, price movements are random. Returns can be very negative, or very positive.
But, if we stay invested and globally diversified, the long-term outcome we can expect is pretty much constant.
And that's the second, and rather reassuring, lesson for investors from the Victorian genius Francis Galton.
Robin Powell is the Creative Director at Index Fund Advisors (IFA). He is also a financial journalist and the editor of The Evidence-Based Investor. This article reflects IFA's investment philosophy and is intended for informational purposes only.
This article is intended for informational purposes only and reflects the perspective of Index Fund Advisors (IFA), with which the author is affiliated. It should not be interpreted as an offer, solicitation, recommendation, or endorsement of any specific security, product, or service. Readers are encouraged to consult with a qualified Investment Advisor for personalized guidance. Please note that there are no guarantees that any investment strategies will be successful, and all investing involves risks, including the potential loss of principal. Quotes and images included are for illustrative purposes only and should not be considered as endorsements, recommendations, or guarantees of any particular financial product, service, or advisor. IFA does not endorse or guarantee the accuracy of third-party content. For additional information about Index Fund Advisors, Inc., please review our brochure at https://www.adviserinfo.sec.gov/ or visit our website at www.ifa.com.


